Introduction
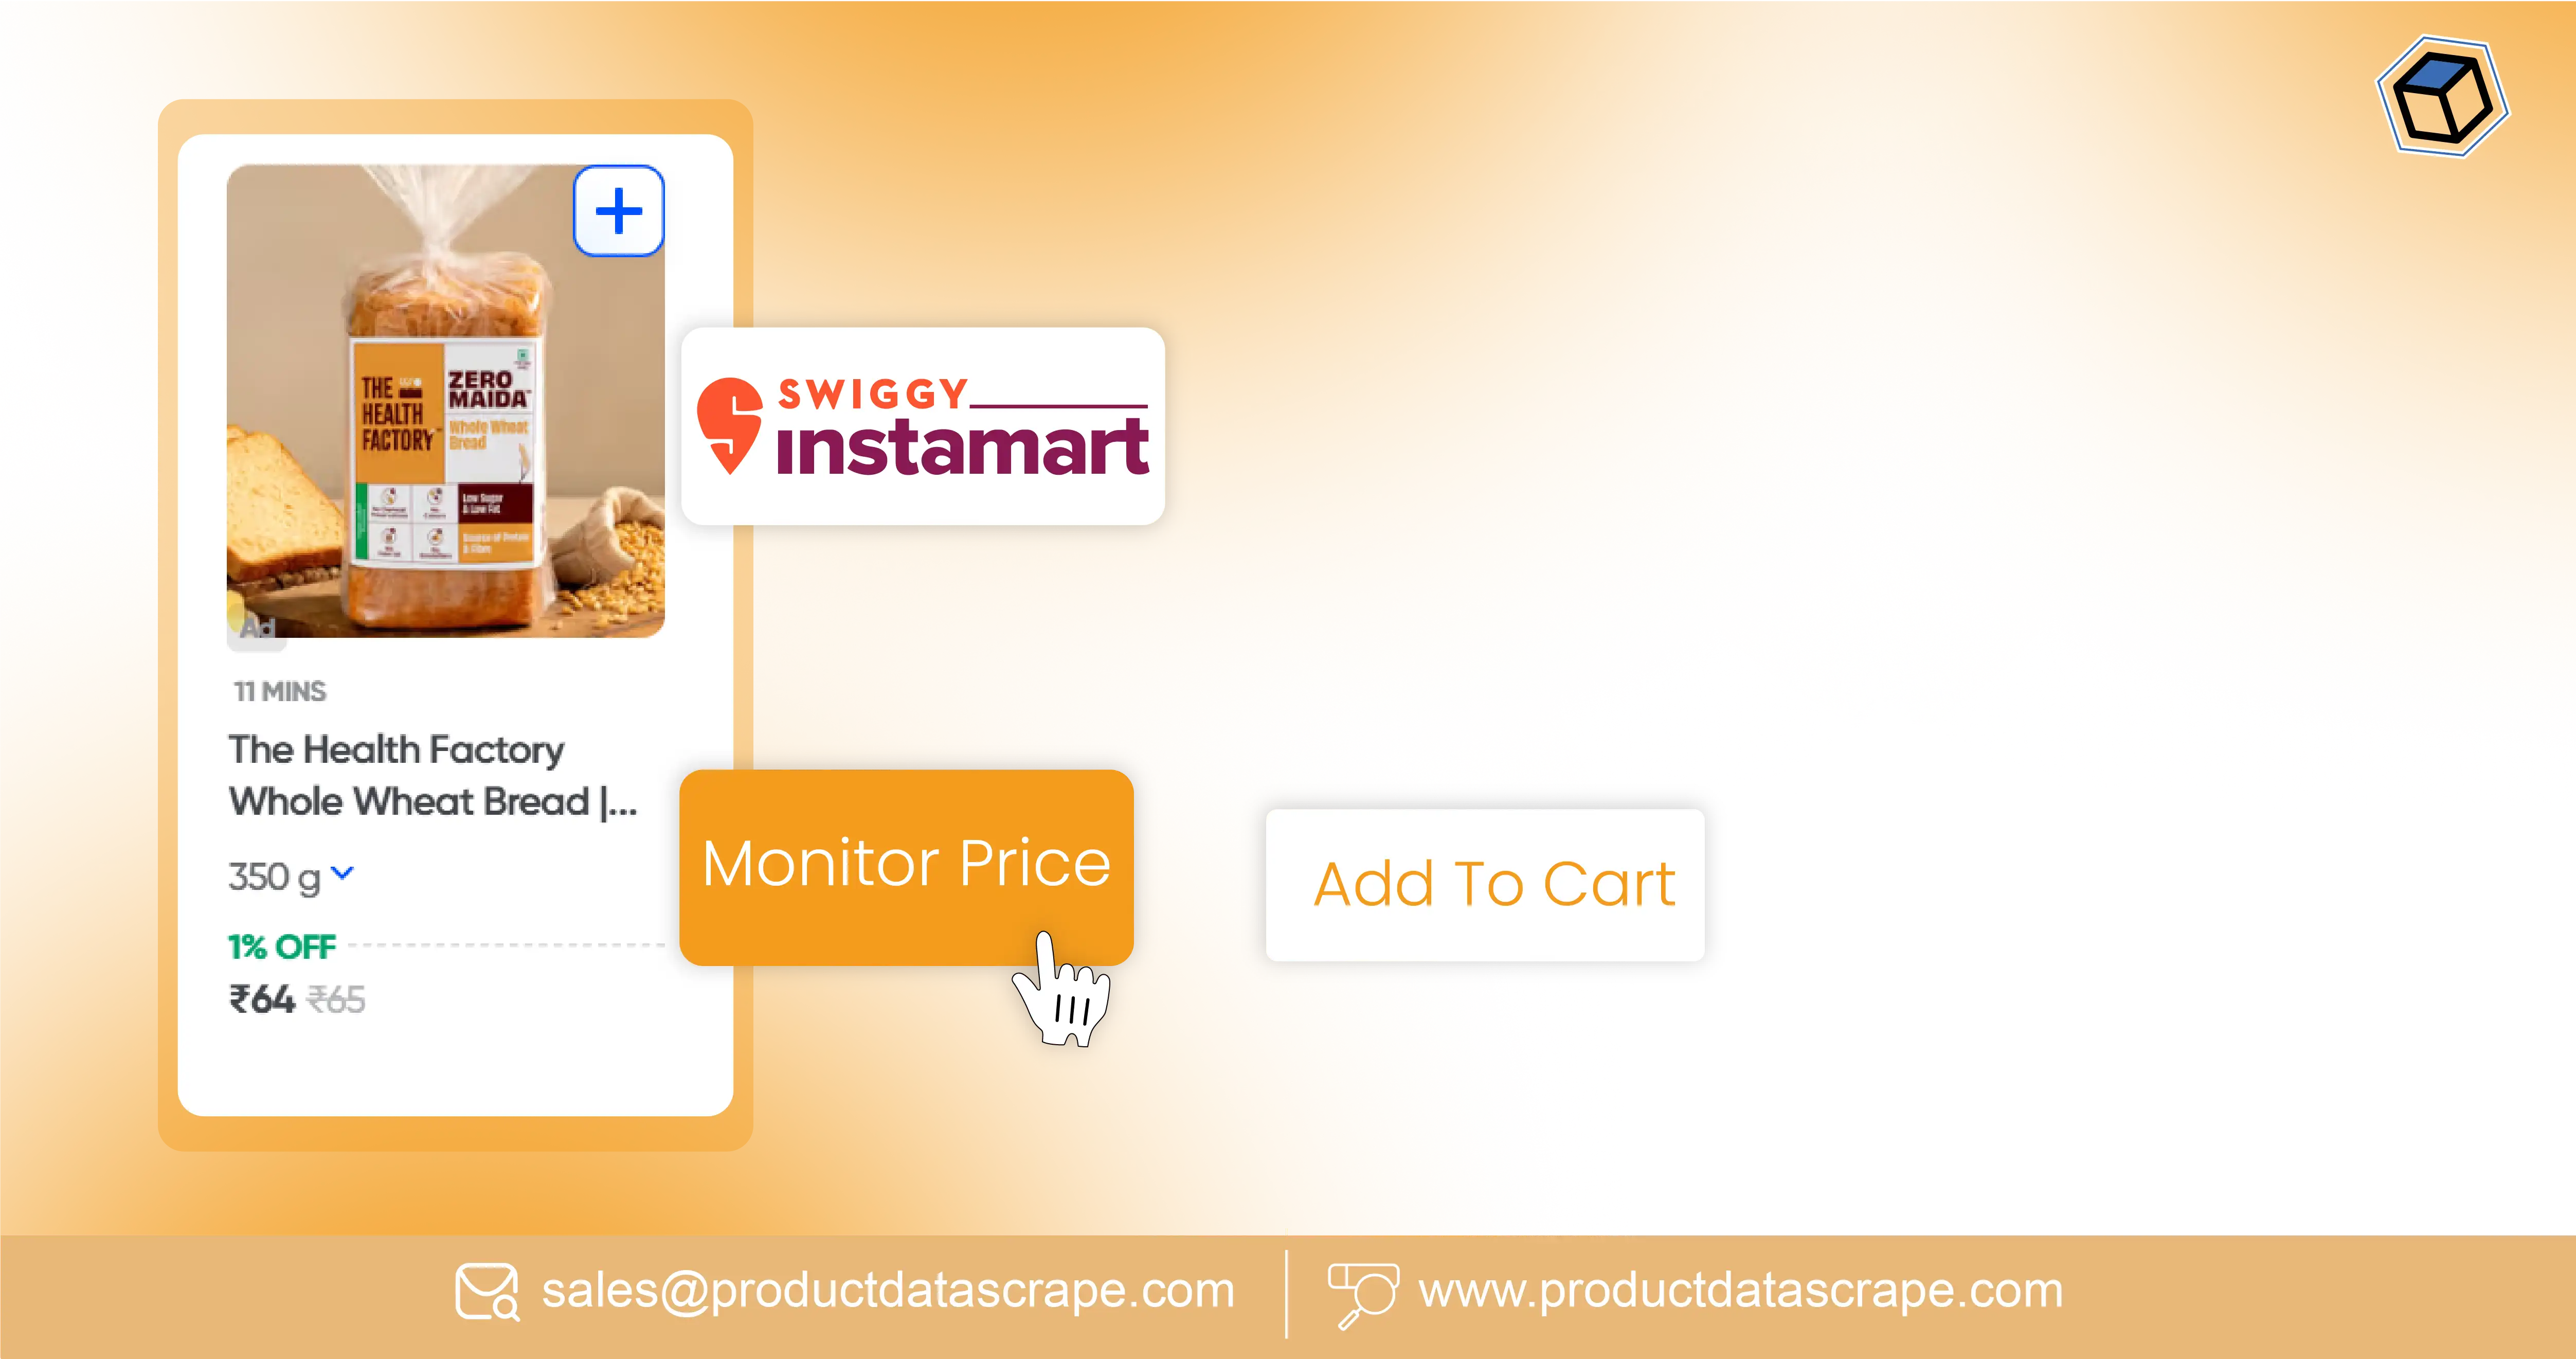
Businesses can monitor changing quick-commerce prices by collecting product-level price, discount, availability, and promotional signals at regular intervals. Track Dynamic Discounts on swiggy instamart helps pricing teams identify when offers change, how discounts vary by product or location, and how promotional activity affects competitive positioning.
A Swiggy Instamart scraper can organize publicly accessible product and pricing information into structured records for recurring analysis. Instead of relying on manual screenshots or occasional checks, businesses can create historical observations that show the difference between list price, selling price, displayed discount, and promotional messaging.
This capability is increasingly relevant as quick commerce expands beyond conventional groceries. Swiggy launched Instamart in August 2020, and its FY2024-25 annual report states that the service had expanded to 124 cities and 1,021 active dark stores, with quick-commerce GOV reaching ₹14,683 crore in FY2024-25.
For brands, retailers, FMCG companies, marketplaces, and pricing analysts, the key challenge is not simply seeing today's discount. The real requirement is understanding how that discount changes over time and whether the change is linked to product, location, demand, inventory, or promotional activity.
How Can Businesses Build a Better View of Dynamic Pricing?
Instamart Dynamic Pricing Intelligence helps businesses convert repeated price observations into a historical view of marketplace behavior. A pricing team can capture product identifiers, product names, MRP, selling price, displayed discount, offer text, pack size, availability, timestamp, and location. Once stored consistently, these fields can reveal pricing movements that are difficult to identify through manual browsing.
For example, a retailer may discover that a particular FMCG product moves from full price to a 10% promotion and later to a 20% promotion within a defined period. Another product may maintain the same selling price while its displayed promotional message changes. These distinctions matter because discount percentages alone do not explain the complete pricing picture.
| Data point |
Why it matters |
Example analysis |
| MRP |
Reference price |
Price positioning |
| Selling price |
Actual displayed price |
Competitive comparison |
| Discount percentage |
Promotional intensity |
Offer benchmarking |
| Offer text |
Promotion context |
Campaign classification |
| Product availability |
Supply context |
Discount vs. stock analysis |
| Timestamp |
Historical accuracy |
Price-change detection |
| Location |
Geographic comparison |
City-level analysis |
The 2020–2026 development of Instamart provides useful context. Instamart launched in 2020, and by April 2022 Swiggy said it operated in 28 cities after reducing delivery times through store, technology, and logistics expansion. In 2022, Swiggy also reported strong growth in tea and coffee orders on Instamart. By 2024, Instamart had expanded beyond groceries into 35+ categories. In 2025, it reached 100 cities and more than 30,000 products. Swiggy's FY2024-25 report recorded 124 cities and 1,021 active dark stores. In FY2026, Swiggy reported quick-commerce revenue of ₹10,935 crore for the year ended March 31, 2026, compared with ₹6,418 crore in FY2025.
The actionable insight is simple: businesses should store price observations with timestamps and locations rather than replacing yesterday's values with today's values. A Swiggy Instamart Grocery Delivery Scraping API can support this structured collection process, helping businesses maintain historical records that create the foundation for meaningful discount analysis.
What Makes Automated Monitoring Useful for Pricing Teams?
Instamart Automated Discount Monitoring enables businesses to replace sporadic manual checks with repeatable data collection. The system can be configured around selected SKUs, brands, categories, cities, or stores and can record price observations at defined intervals.
This matters because quick-commerce pricing is highly time-sensitive. A discount observed at 10 AM may not remain unchanged at 6 PM. A product may also show different availability or promotional information depending on location. For pricing teams, the objective is therefore to capture the state of the marketplace at multiple points rather than treating a single observation as permanent.
| Monitoring requirement |
Manual approach |
Automated approach |
| SKU tracking |
Periodic checking |
Scheduled collection |
| Price changes |
Spreadsheet updates |
Timestamped records |
| Discount changes |
Manual comparison |
Automated comparison |
| Large catalog |
Difficult to scale |
Structured collection |
| Historical analysis |
Limited |
Snapshot-based |
| Alerts |
Manual review |
Rule-based detection |
The timeline from 2020 to 2026 demonstrates why scale has become increasingly important. Instamart began in August 2020 as a quick-commerce grocery service. By 2022, Swiggy reported 28 cities, while its corporate presentation records 25 cities, 400+ dark stores, and 8,400+ SKUs in 2022. In 2024, the service expanded into more than 35 categories. In January 2025, it reached 76 cities, and by April 2025 it reached 100 cities with more than 30,000 products. By FY2024-25, Swiggy reported 124 cities and 1,021 active dark stores. In FY2026, quick-commerce revenue reached ₹10,935 crore.
As catalog and geographic coverage expand, automated monitoring becomes useful because the number of price observations increases rapidly. A defined collection schedule also makes historical comparisons more reliable.
How Can Brands Identify Changing Promotions?
Businesses can Scrape swiggy Instamart Dynamic Discounts from permitted publicly accessible sources to create structured records of promotional changes. The objective should be to understand discount behavior, not merely collect a list of today's offers.
A useful dataset separates base price, selling price, discount percentage, offer wording, pack size, product identifier, availability, and timestamp. This allows analysts to distinguish a genuine price reduction from a change in promotional presentation. It can also help identify products that repeatedly enter promotional cycles.
| Analytical measure |
What it reveals |
| Discount depth |
Size of displayed price reduction |
| Discount frequency |
How often an item is promoted |
| Promotion duration |
How long an offer remains visible |
| Price variance |
Movement in selling price |
| SKU coverage |
Share of catalog under promotion |
| Category discount rate |
Promotional intensity by category |
The 2020–2026 period provides a useful scale perspective. Instamart launched in 2020 and initially focused heavily on grocery convenience. By 2022, Swiggy was reporting expanding grocery demand and new-city adoption. In 2024, Instamart expanded to 35+ categories, increasing the potential range of products requiring price monitoring. In 2025, the platform reached 100 cities and more than 30,000 products. Swiggy's FY2024-25 annual report subsequently reported 124 cities, 1,021 active dark stores, and ₹14,683 crore in quick-commerce GOV. For FY2026, Swiggy reported quick-commerce revenue of ₹10,935 crore, up from ₹6,418 crore in FY2025.
For pricing teams, this expansion means monitoring should be prioritized. High-value SKUs, frequently promoted products, competitor-sensitive categories, and products with volatile prices can be monitored more frequently than low-priority items.
How Can Product-Level Analysis Reveal Pricing Patterns?
Instamart Product-Level Discount Analysis allows businesses to evaluate promotional behavior at SKU level rather than treating an entire category as one pricing unit. This distinction is valuable for FMCG brands and retailers because two products within the same category may experience completely different pricing patterns.
A product-level dataset can calculate the highest observed discount, average discount, number of promotional appearances, price changes, duration of offers, and availability during promotional periods. Analysts can then compare these indicators across brands, pack sizes, categories, or cities.
| Product-level metric |
Business question |
| Average discount |
How aggressively is the SKU promoted? |
| Maximum discount |
What is the deepest observed offer? |
| Discount frequency |
How regularly is it promoted? |
| Selling-price variance |
How stable is its displayed price? |
| Offer duration |
How long do promotions last? |
| Availability during offer |
Is the product consistently in stock? |
From 2020 through 2026, the expanding assortment makes SKU-level analysis increasingly relevant. Instamart launched in 2020, while Swiggy's 2022 corporate presentation recorded more than 8,400 SKUs across 25 cities. In 2024, Swiggy said Instamart had moved beyond groceries into 35+ categories. By April 2025, the platform had more than 30,000 products across 100 cities. Its FY2024-25 annual report reported 124 cities and megapods capable of holding up to 50,000 SKUs, compared with 10,000–20,000 for normal dark stores. By FY2026, Swiggy reported ₹10,935 crore in quick-commerce revenue for the year.
This progression shows why SKU-level historical data can be more actionable than category-level snapshots. Businesses can identify which individual products drive promotional intensity and which remain comparatively stable.
How Can Companies Track Offer Prices Across Locations?
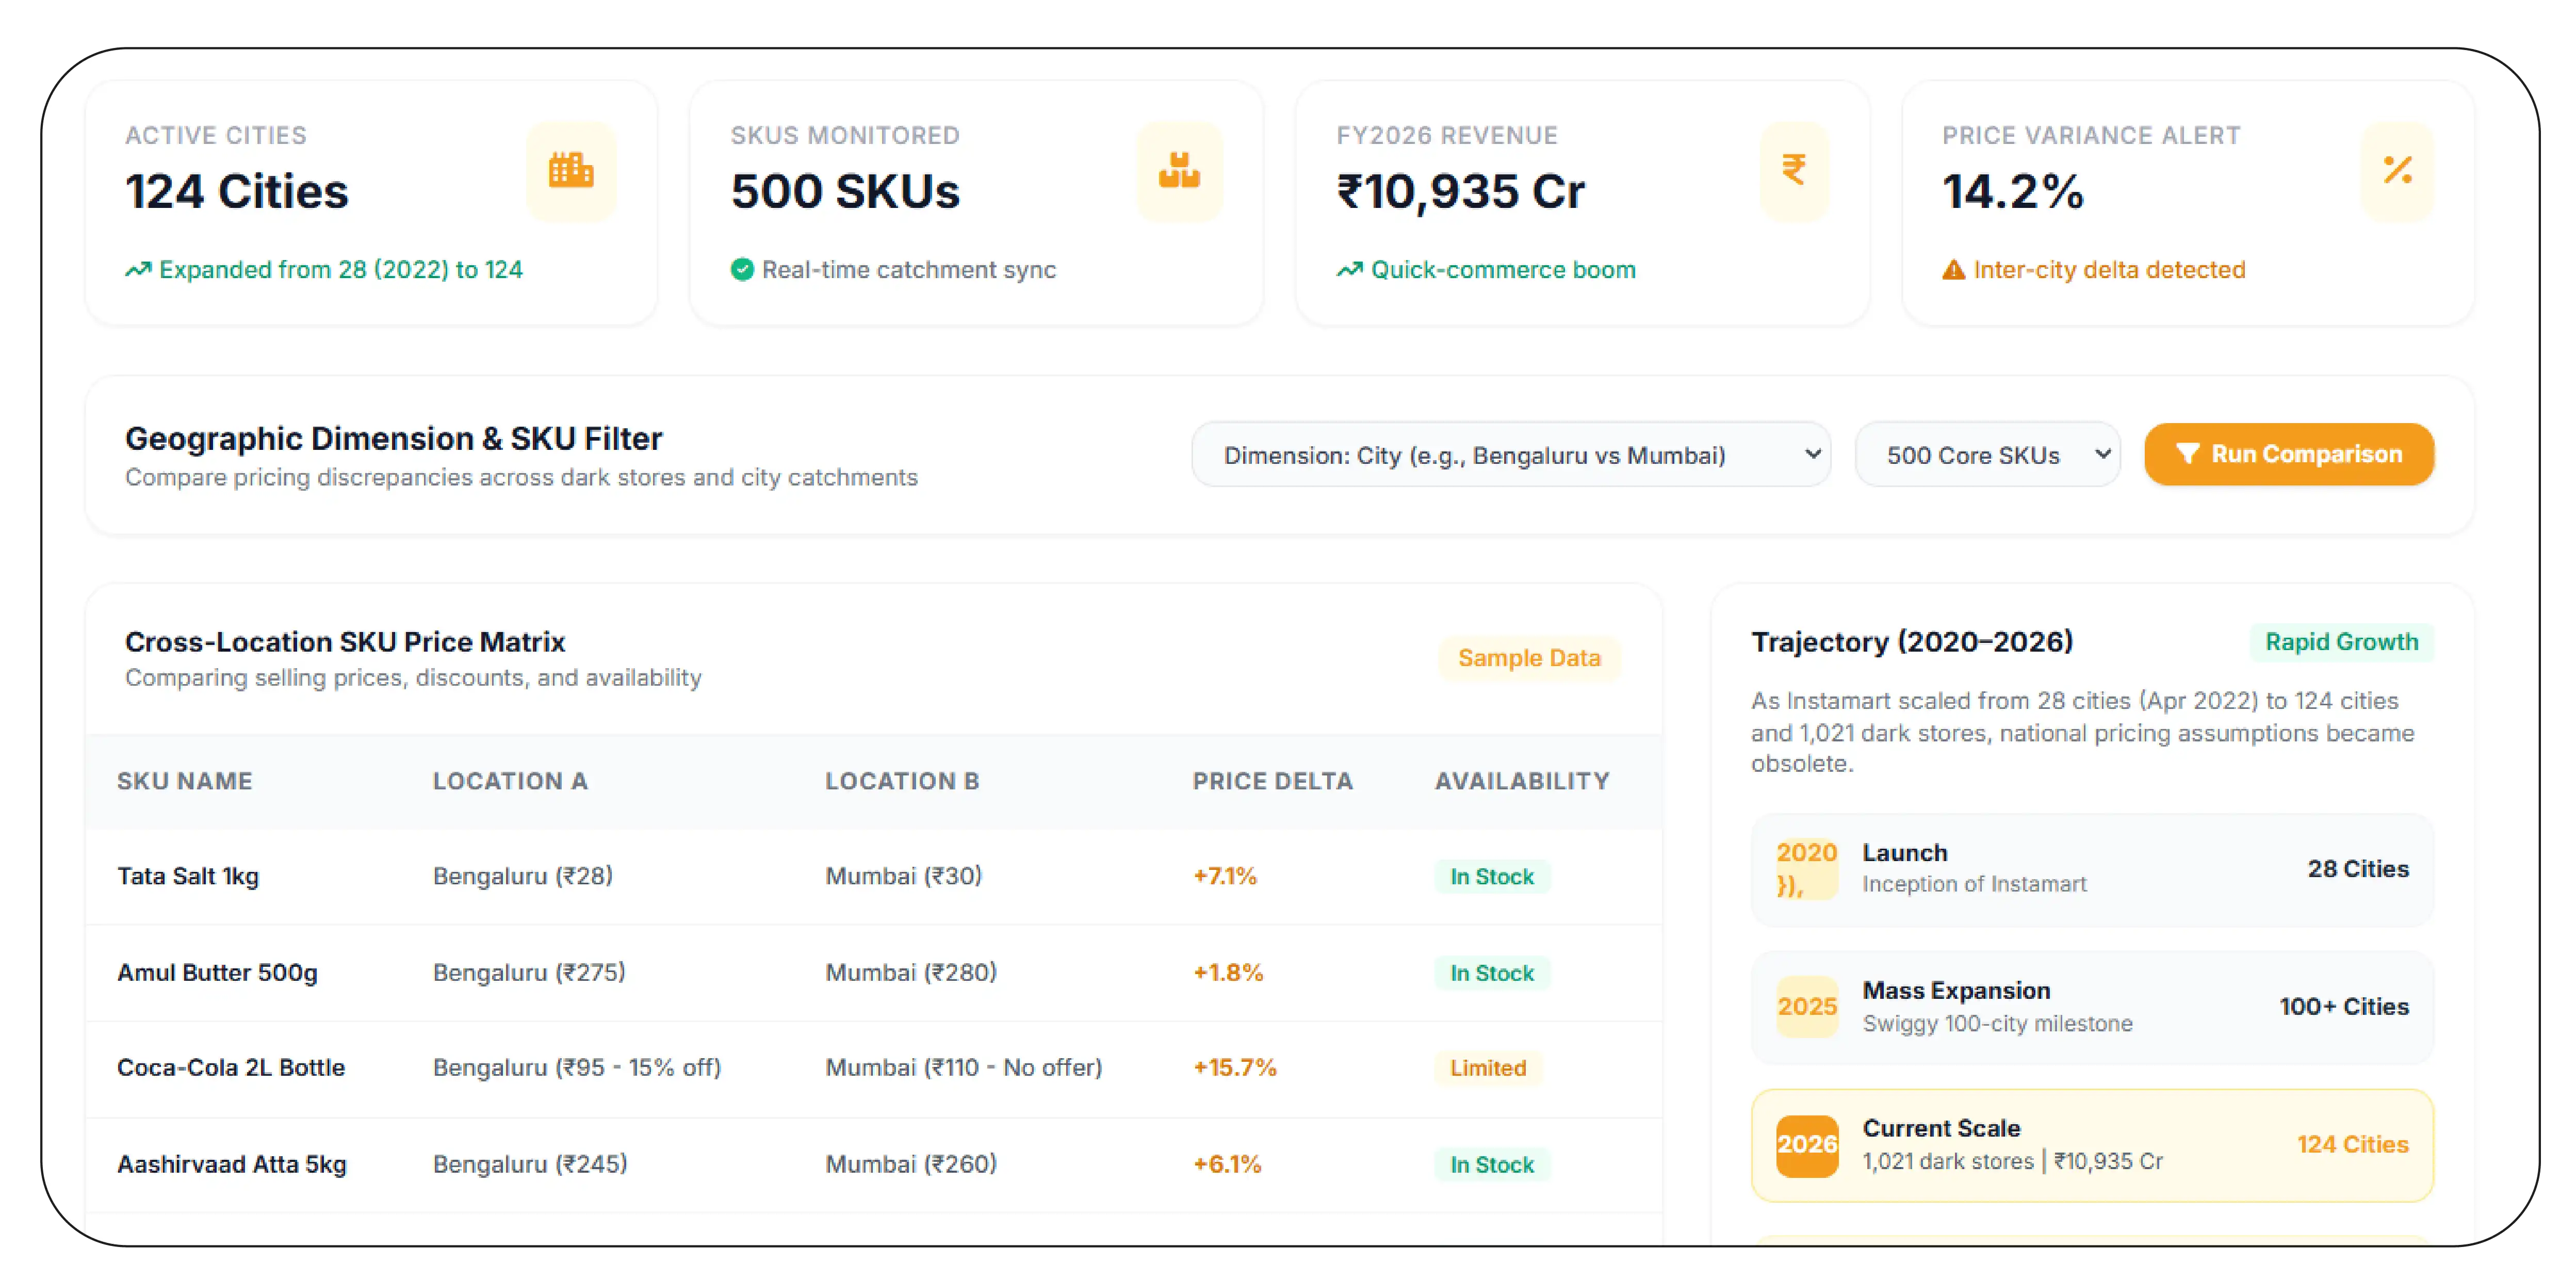
Instamart Offer Price Tracking can help businesses compare displayed prices and promotions across cities, locations, categories, or defined store catchments. Geographic context is important because quick-commerce fulfillment depends on local inventory and dark-store networks.
For example, a brand could compare the same 500 SKUs across several cities and identify differences in selling price, discount percentage, availability, and offer duration. This can reveal whether a promotion appears broadly or only within selected geographic markets.
| Geographic dimension |
Example comparison |
| City |
Bengaluru vs. Mumbai |
| Region |
North vs. South India |
| Store catchment |
Store A vs. Store B |
| SKU |
Same product across locations |
| Category |
Beverages by city |
| Time |
Morning vs. evening |
The 2020–2026 trajectory makes geographic monitoring increasingly relevant. Instamart began in 2020 and expanded to 28 cities by April 2022. In January 2025, Swiggy announced expansion to 76 cities, followed by the 100-city milestone in April 2025. Swiggy's FY2024-25 annual report later reported 124 cities and 1,021 active dark stores. A Swiggy hiring update also described the expansion from 580 to more than 1,000 dark stores between September 2024 and March 2025. In FY2026, Swiggy reported quick-commerce revenue of ₹10,935 crore.
As geographic coverage expands, a single national price assumption becomes less useful for operational analysis. Location-level snapshots allow businesses to understand how promotions and availability vary within the quick-commerce network.
How Can Analytics Turn Price Data Into Business Decisions?
Swiggy Instamart analytics can help convert collected pricing and promotional observations into measurable business indicators. The purpose is to connect raw marketplace data with decisions involving pricing, promotions, assortment, competitive positioning, and category management.
A dashboard can show the number of monitored SKUs, average displayed discount, price changes by category, products entering or leaving promotions, and geographic differences. Historical data can also support trend lines that show whether promotional intensity is increasing, declining, or remaining stable.
| Dashboard KPI |
Business application |
| Average discount |
Promotion benchmarking |
| Discounted SKU share |
Category monitoring |
| Price-change frequency |
Volatility analysis |
| Offer duration |
Promotion lifecycle |
| Availability rate |
Stock context |
| City-level variance |
Geographic benchmarking |
The development from 2020 to 2026 reinforces the need for scalable analytics. Instamart launched in 2020 as a grocery-focused service. In 2022, Swiggy reported expansion into new cities and strong growth in several grocery categories. In 2024, the service expanded its assortment to 35+ categories. In 2025, it reached 100 cities and more than 30,000 products. The FY2024-25 annual report reported 124 cities, 1,021 active dark stores, 7.1 million monthly transacting users, and ₹14,683 crore in quick-commerce GOV. In FY2026, quick-commerce revenue reached ₹10,935 crore, while quarterly GOV growth reported in May 2026 was 68.8% year over year.
The practical lesson is that analytics should measure change, not merely volume. Businesses can combine price, discount, availability, time, and location dimensions to identify actionable patterns.
Why Choose a Specialized Data Partner?
A reliable data workflow should deliver more than raw product records. It should provide consistent fields, historical snapshots, validation, normalization, and delivery formats that fit existing analytics systems. For brands and retailers, Product Pricing and Promotions data can support competitor benchmarking, assortment analysis, promotion measurement, and category strategy.
A structured pipeline can also reduce manual monitoring across large SKU inventories. Instead of checking products individually, businesses can define the categories, locations, brands, and frequency that matter most. Timestamped records then provide an auditable history for trend analysis. The approach should remain focused on permitted publicly accessible information and applicable platform requirements.
For pricing teams, the biggest advantage is consistency. A standardized dataset makes it easier to compare products across time and locations and turn repeated observations into actionable commercial intelligence.
Conclusion
Dynamic quick-commerce pricing requires continuous observation because displayed prices, discounts, availability, and promotions can change over time. Swiggy Instamart Product Dataset workflows can help businesses preserve these observations as structured historical records for pricing, competitor, assortment, and promotional analysis.
The platform's expansion from its 2020 launch to 124 cities and 1,021 active dark stores reported for FY2024-25 demonstrates the growing scale of the marketplace. In FY2026, Swiggy reported ₹10,935 crore in quick-commerce revenue for the year ended March 31, 2026.
Partner with Product Data Scrape to build scalable quick-commerce price and promotion datasets that help your team monitor market changes and make faster data-driven decisions!
Frequently Asked Questions
What does dynamic discount monitoring involve?
Track Dynamic Discounts on swiggy instamart involves recording product prices, displayed discounts, promotional messages, availability, locations, and timestamps to identify changes across defined monitoring periods.
How does a scraper support quick-commerce research?
A Swiggy Instamart scraper can organize publicly accessible product and pricing information into structured records, helping businesses compare products, promotions, availability, and pricing patterns over time.
Why is pricing intelligence useful for retailers?
Instamart Dynamic Pricing Intelligence helps retailers evaluate discount depth, promotional frequency, product-level price movement, geographic variation, and competitive pricing signals using historical observations.
How can businesses automate discount tracking?
Instamart Automated Discount Monitoring uses scheduled collection and timestamped datasets to identify price and promotional changes without depending entirely on manual product-by-product checks.
Can Product Data Scrape provide dynamic discount datasets?
Yes. Scrape swiggy Instamart Dynamic Discounts workflows can be structured around permitted public data fields, defined SKUs, locations, schedules, validation rules, and delivery requirements.


 Singapore
 EMAIL
EMAIL
 PHONE
PHONE


.webp "thumb")













.webp)






