Quick Overview
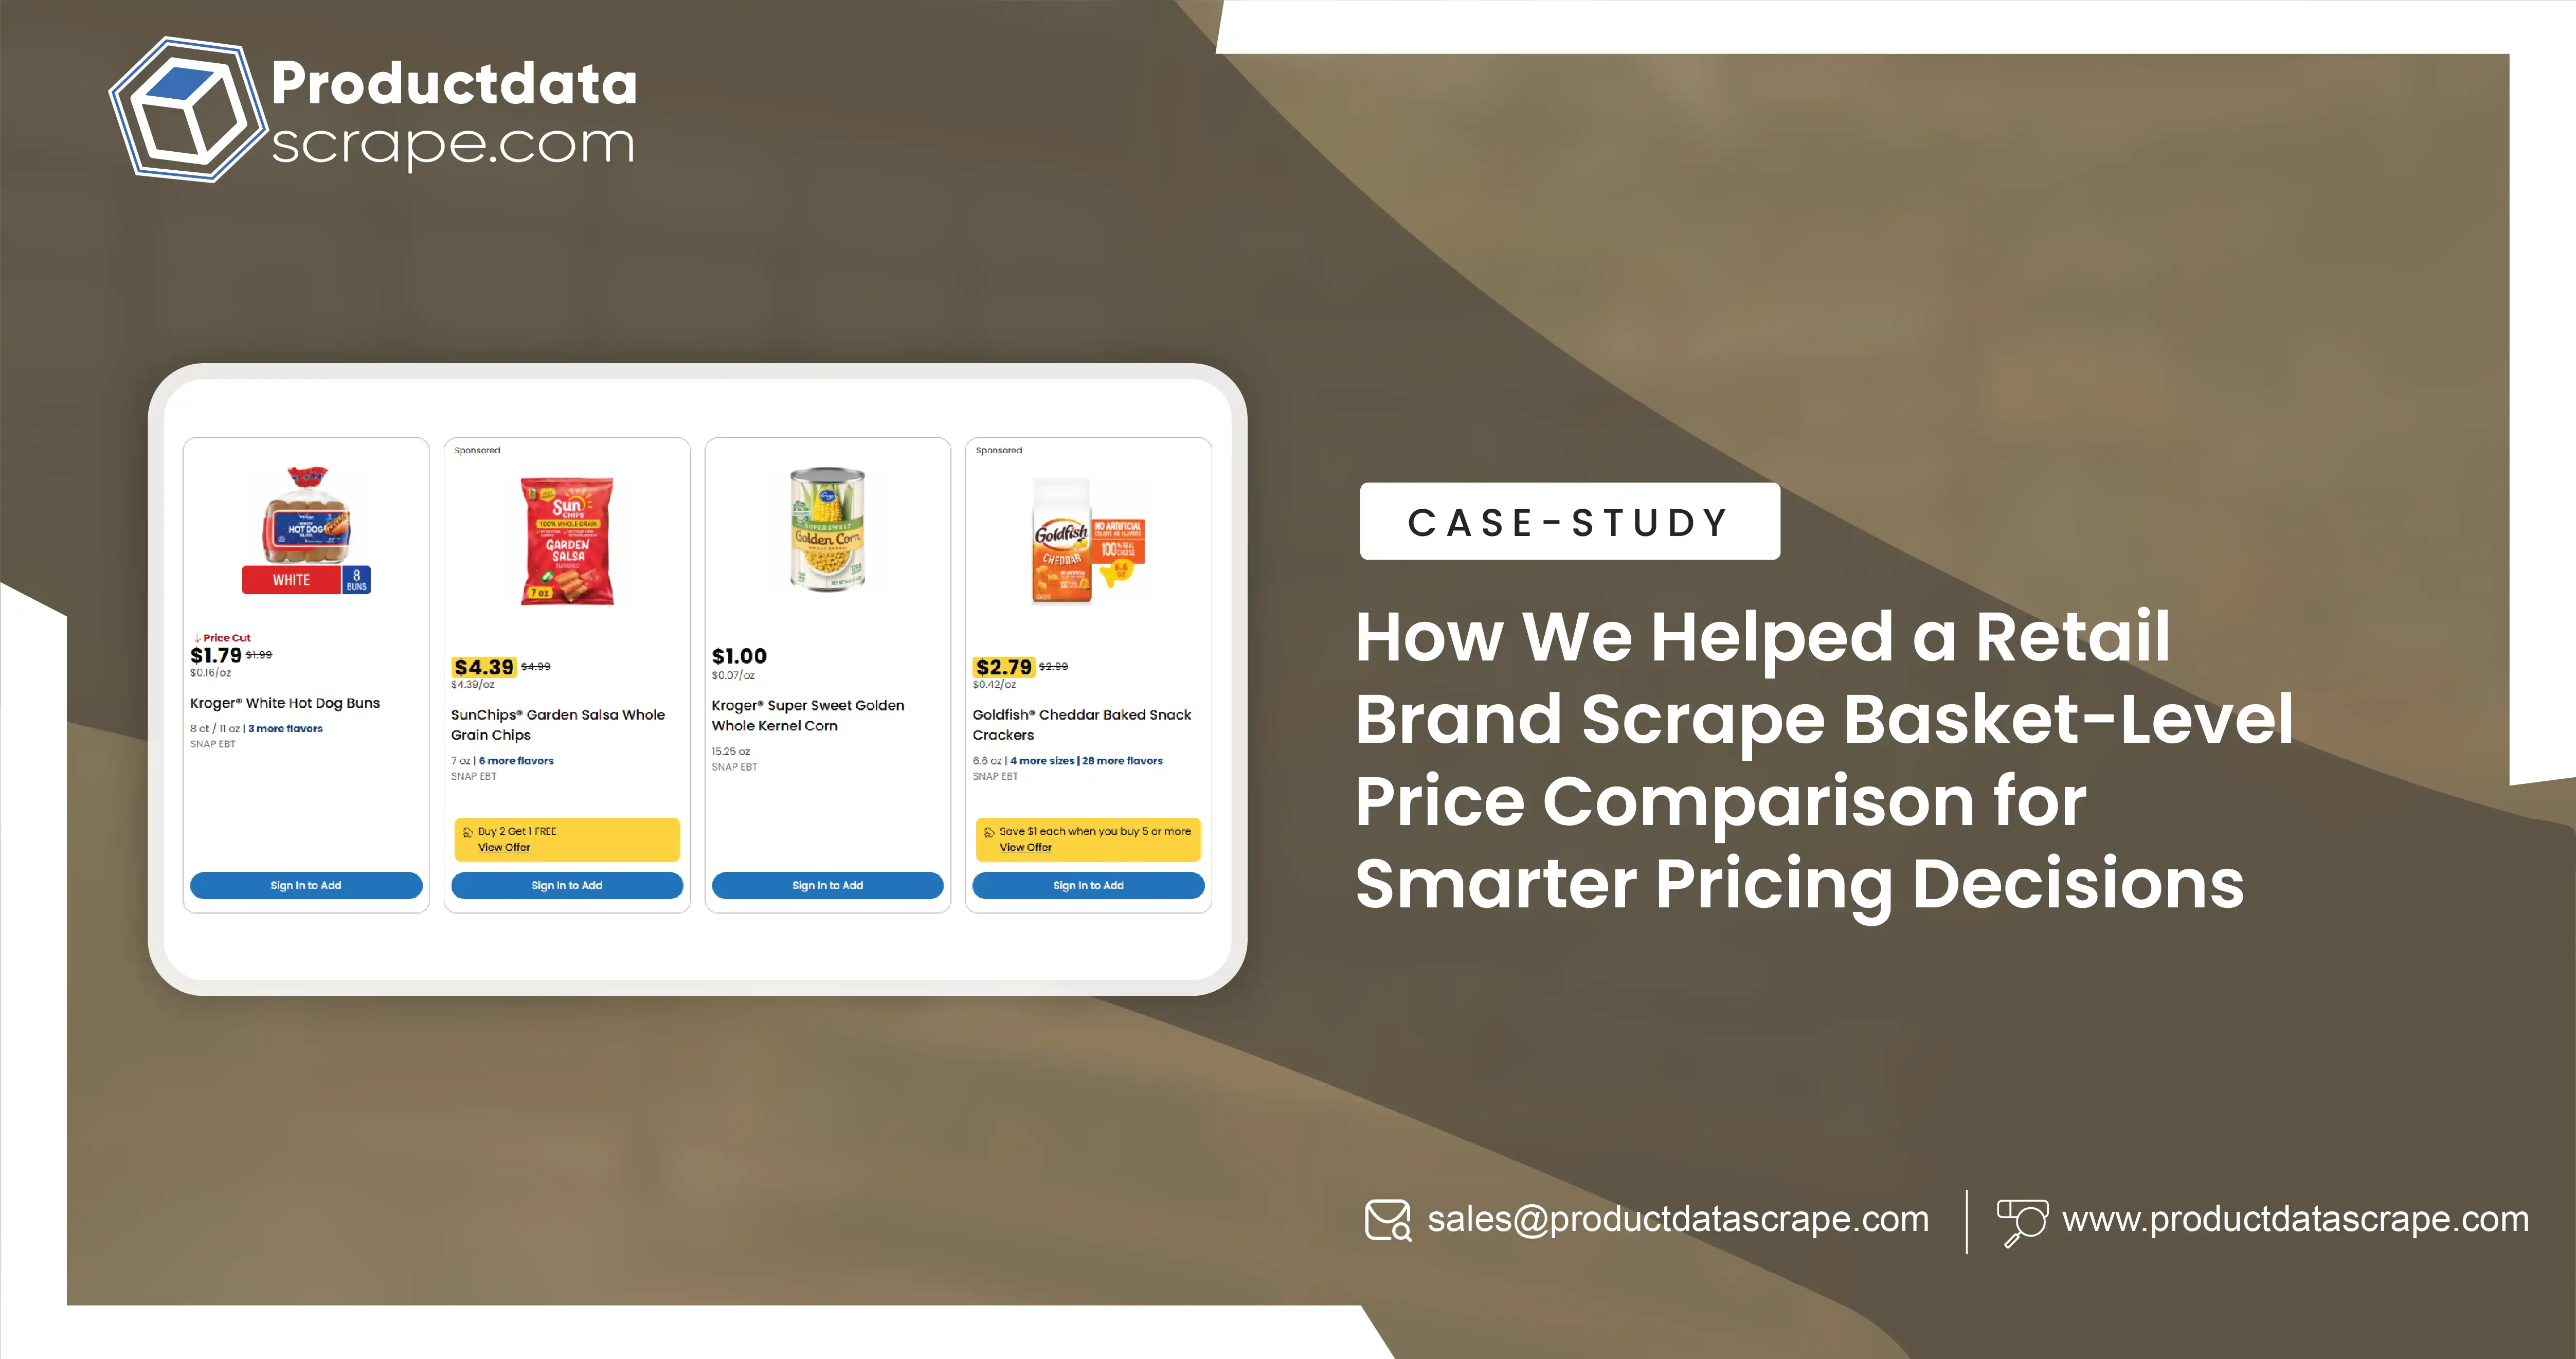
A leading multi-category retail organization partnered with Product Data Scrape to strengthen competitive pricing intelligence across grocery and everyday-consumer products. The project focused on Retailers and Restaurant Chains Scrape capabilities to capture comparable basket-level pricing signals across five major retail chains. The organization needed faster visibility into product prices, discounts, pack sizes, assortment, and availability for frequently purchased grocery baskets. Product Data Scrape implemented an automated data collection and normalization framework that enabled consistent retailer-wise comparisons. The solution delivered 95%+ data accuracy, reduced manual monitoring effort by approximately 80%, and shortened basket comparison cycles from days to hours, helping pricing teams respond faster to competitive market movements.
Client Name / Industry: Leading Retail & FMCG Organization
Service / Duration: Grocery Basket Data Scraping & Competitive Price Intelligence / 6 Months
Key Impact Metrics: 95%+ data accuracy | 80% reduction in manual monitoring | 70% faster competitive price analysis
The Client
The client was a large retail and FMCG organization operating across multiple grocery and household-product categories. Its assortment included everyday products such as milk, bread, rice, flour, cooking oil, breakfast cereals, snacks, beverages, detergents, personal-care products, and household essentials. The portfolio competed with widely recognized brands such as Coca-Cola, Pepsi, Nestlé, Kellogg's, Lay's, Tide, Dove, Britannia, and Unilever across major retail channels.
The grocery market was becoming increasingly price-sensitive as shoppers compared prices across Walmart, Kroger, Target, Aldi, and other online and offline retail formats. Promotions, loyalty offers, private-label alternatives, pack-size variations, and regional pricing were making it difficult for the client to understand the actual cost of a complete shopping basket.
The organization therefore required reliable Grocery Basket Price Benchmarking to compare the total value offered by competing retailers rather than evaluating products individually. Before the partnership, pricing analysts relied heavily on spreadsheets, manual browsing, and periodic competitor checks. This approach was slow, inconsistent, and difficult to scale across hundreds of products and multiple locations.
The client also lacked centralized Assortment and availability monitoring, making it challenging to determine whether price differences were caused by genuine pricing strategies, promotional activity, product substitutions, or simple product unavailability. A scalable data-driven transformation became essential to support faster pricing decisions and stronger competitive positioning.
Goals & Objectives
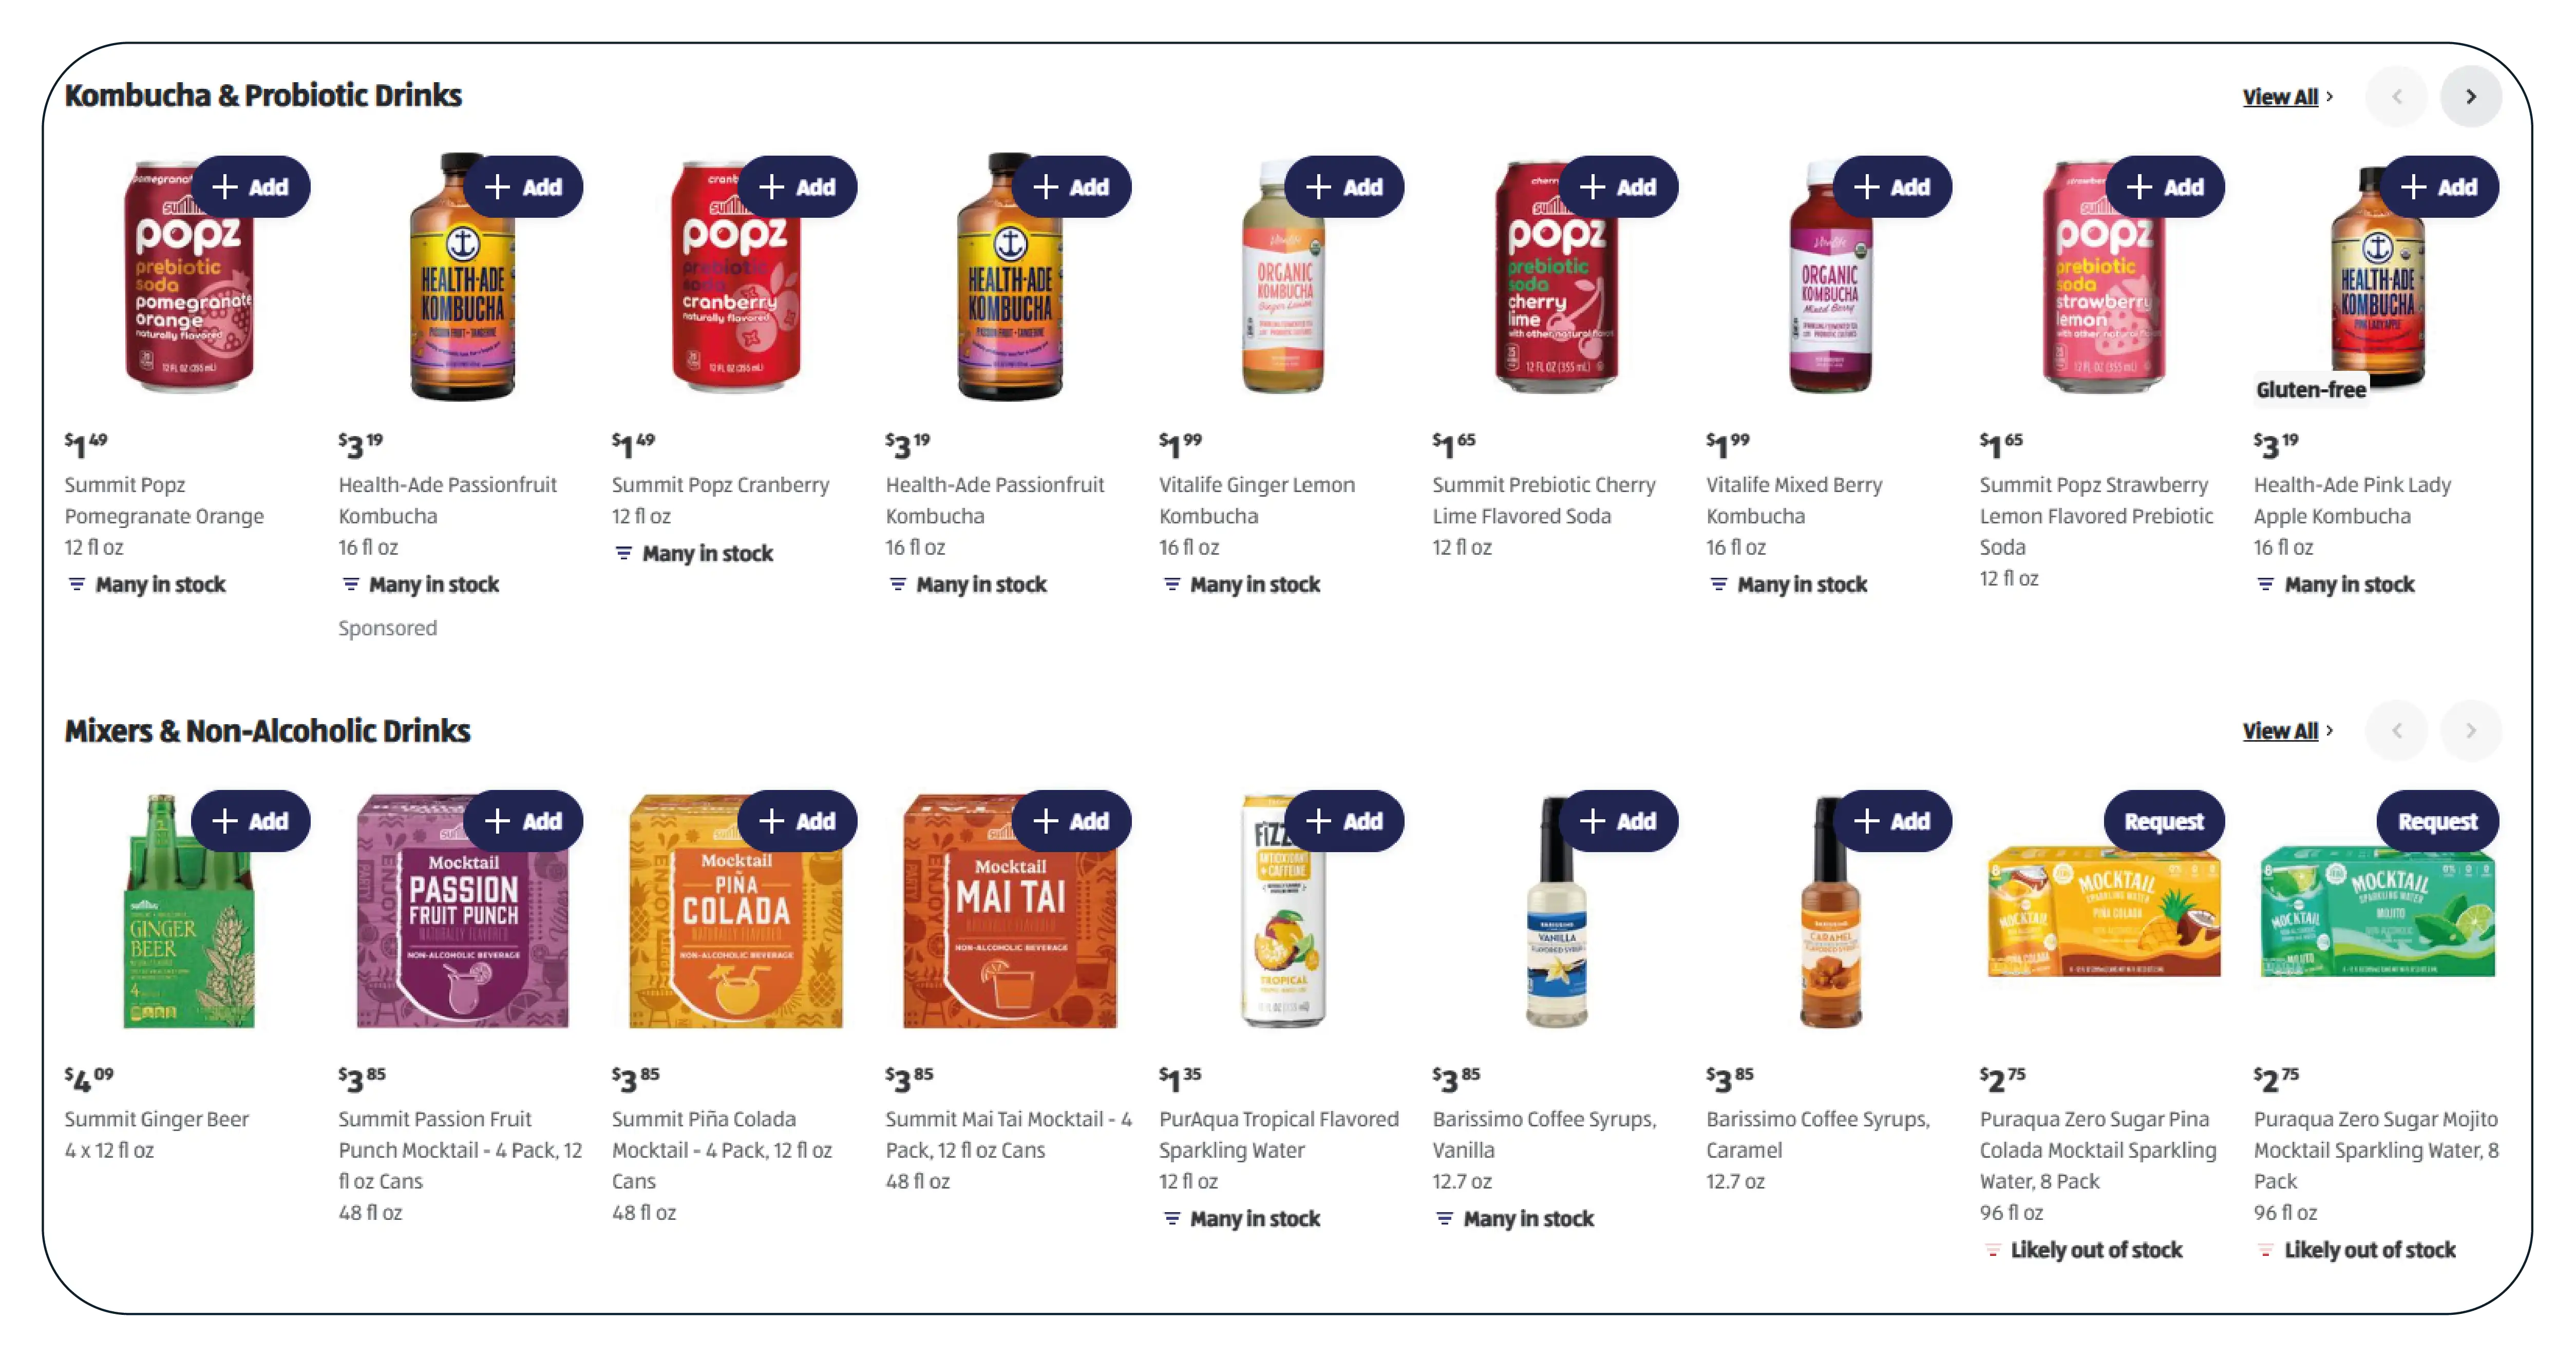
The project was designed to create a scalable framework for collecting, standardizing, comparing, and analyzing grocery basket data. The client wanted to move from periodic manual checks toward automated intelligence that could support pricing teams, category managers, and business leaders.
The primary goal was to Scrape Grocery Basket Prices Across 5 Chains and establish a consistent competitive benchmark for frequently purchased grocery products.
Improve pricing visibility across competing retail chains.
Increase scalability across categories, products, and locations.
Improve the speed and accuracy of competitor monitoring.
Identify basket-level pricing gaps and promotional differences.
Support category managers with actionable competitive intelligence.
Track changes in everyday grocery prices more consistently.
The technical objectives focused on building an automated pipeline capable of collecting product-level information from multiple sources and converting it into standardized basket datasets.
Automate product discovery and data extraction.
Capture product name, brand, SKU, pack size, price, discount, and availability.
Normalize different pack configurations for meaningful comparisons.
Match equivalent products across competing retailers.
Integrate collected data into dashboards and analytics workflows.
Support recurring data refreshes for near-real-time monitoring.
Achieve 95%+ data accuracy.
Reduce manual monitoring effort by 80%.
Reduce competitive analysis turnaround time by 70%.
Maintain 90%+ successful product matching across retailers.
Increase monitoring coverage across targeted grocery categories.
Deliver scheduled datasets without significant processing delays.
The Core Challenge
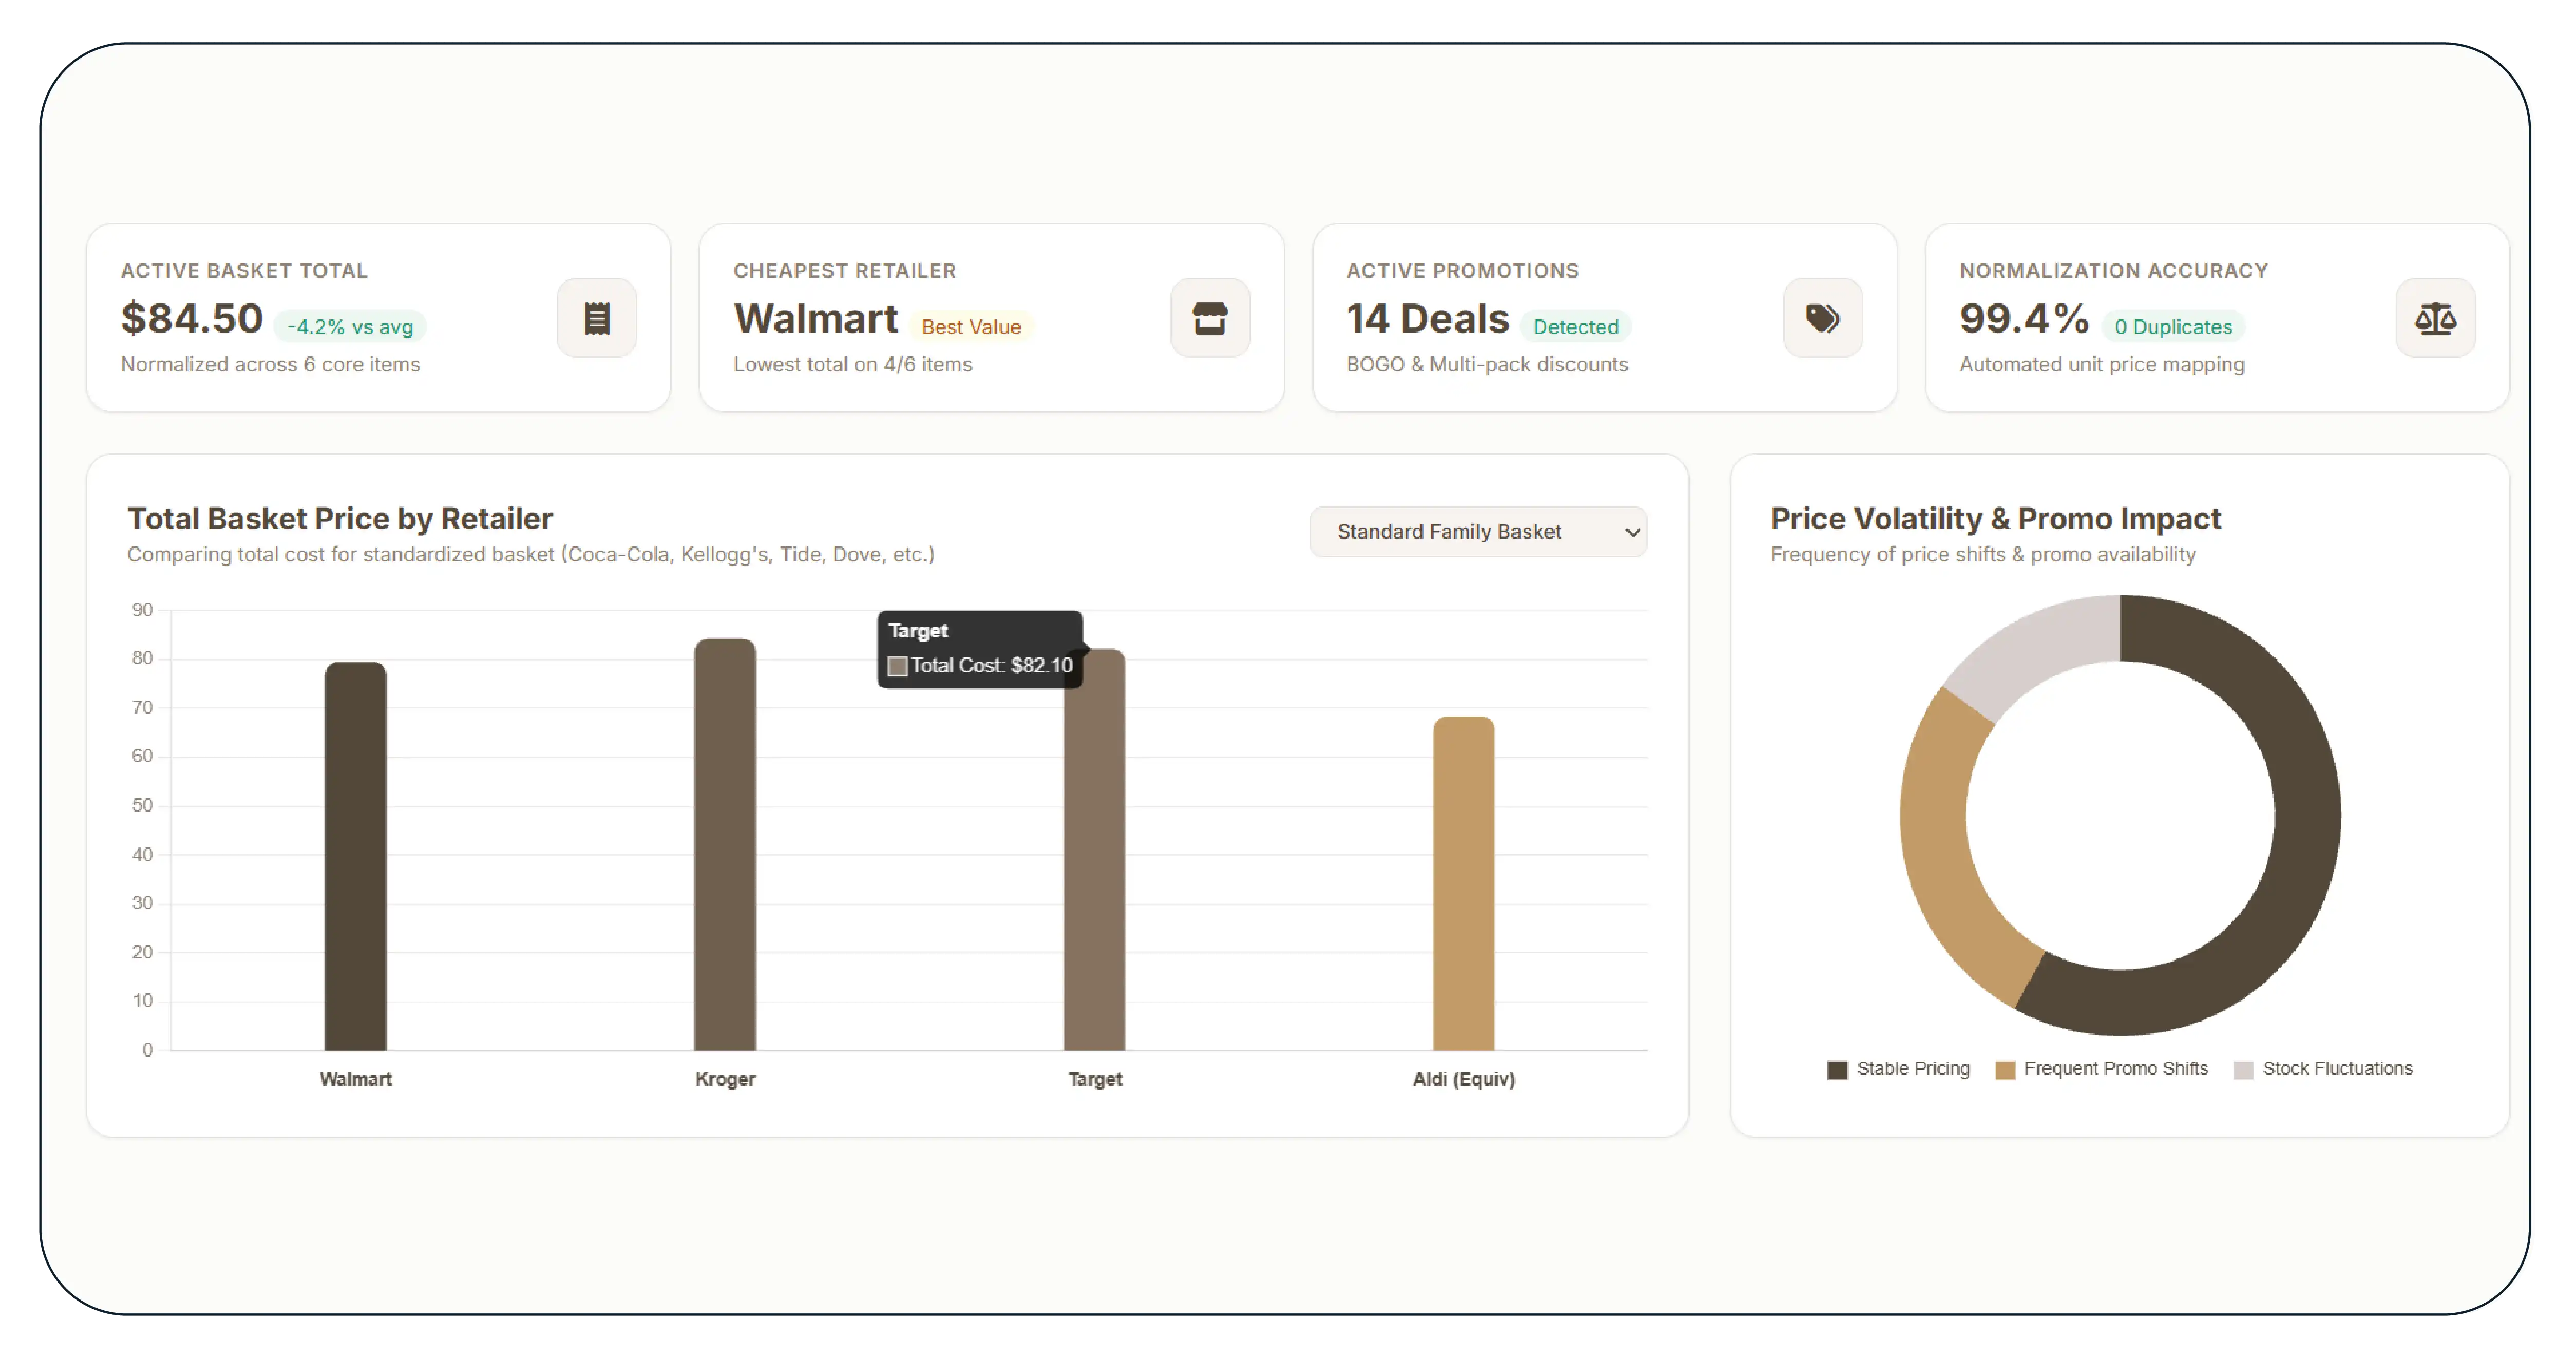
The client's biggest challenge was the fragmented nature of grocery pricing information. Equivalent products could appear under different titles, pack sizes, promotional structures, or availability conditions across Walmart, Kroger, Target, Aldi, and other retail channels. A simple product-by-product comparison therefore did not accurately represent the shopper's total spending experience.
The existing workflow required analysts to manually search retailer websites, record prices in spreadsheets, compare pack configurations, and calculate basket totals. This process became particularly difficult when monitoring products such as Coca-Cola multipacks, Nestlé cereals, Kellogg's breakfast products, Lay's snacks, Tide detergent, or Dove personal-care items.
Another challenge involved frequent pricing changes. Discounts could appear or disappear within short periods, while stock availability could vary by location. This made periodic snapshots less useful for strategic pricing decisions.
The client needed reliable Retailer-Wise Grocery Basket Price Analysis that could distinguish between regular prices, promotional prices, pack-size differences, and availability-related changes. Without automated normalization and matching, analysts risked comparing non-equivalent products and drawing inaccurate conclusions.
Operationally, the organization also faced data-quality issues caused by inconsistent product naming, duplicate listings, missing attributes, and changes in website structures. These bottlenecks slowed reporting and reduced confidence in competitive insights.
Product Data Scrape therefore needed to build a system that combined automated extraction, product matching, validation, normalization, and recurring monitoring into a single scalable workflow.
Our Solution
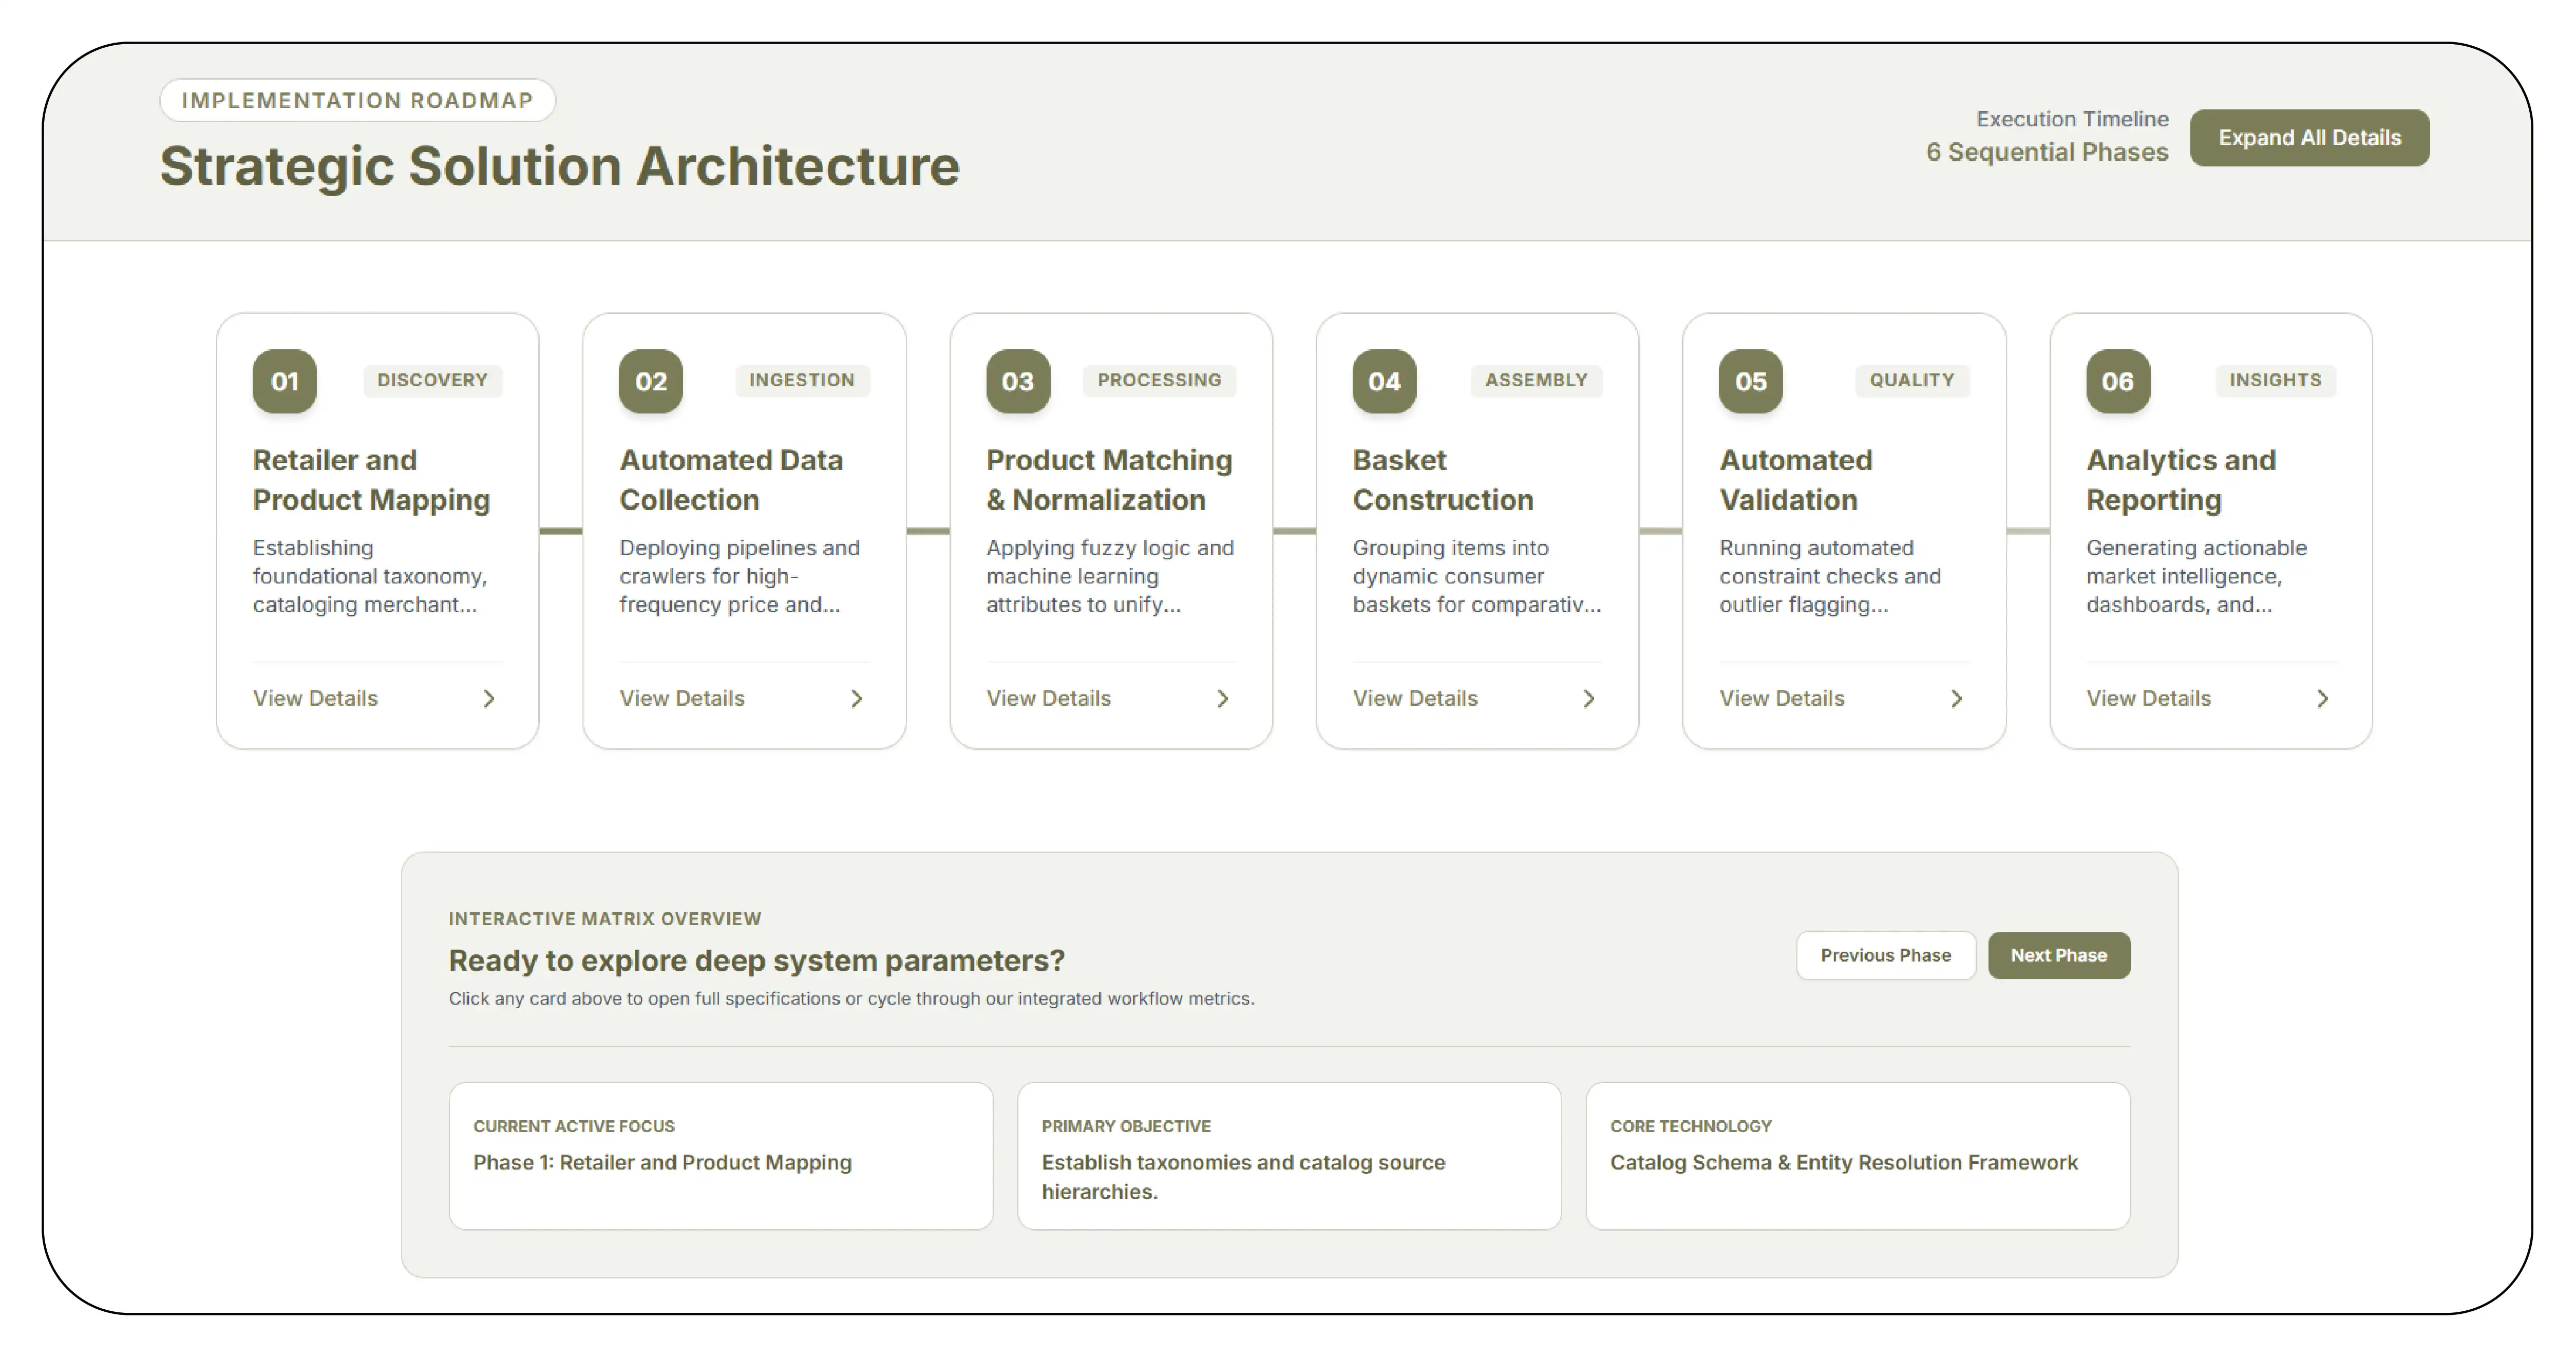
Product Data Scrape implemented a phased data-engineering solution designed around the client's five-chain grocery monitoring requirement. The architecture focused on automation, consistency, scalability, and actionable basket-level insights.
Phase 1: Retailer and Product Mapping
The first stage established a standardized product universe covering core grocery and household categories. Products were mapped across five retail chains based on brand, product name, pack size, SKU, category, and other relevant attributes. The product universe included items such as Coca-Cola beverages, Pepsi products, Nestlé cereals, Kellogg's breakfast foods, Lay's snacks, Tide detergent, Dove personal-care products, bread, milk, rice, flour, cooking oil, and household essentials.
Phase 2: Automated Data Collection
A scalable extraction framework was developed to collect product information from targeted retail channels. The system captured product name, brand, SKU or product identifier, category, pack size, regular price, promotional price, discount, availability, product URL, retailer, and location where applicable. Automated scheduling enabled recurring collection rather than one-time snapshots.
Phase 3: Product Matching and Normalization
One of the most important components was product equivalency matching. Different retailers frequently use different product titles or descriptions for comparable items. The system standardized units such as ounces, pounds, liters, grams, and count-based packs. It then matched products using combinations of brand, product attributes, pack configuration, and SKU-level information. This helped prevent misleading comparisons between a 12-pack and a 24-pack or between different product variants.
Phase 4: Basket Construction
The normalized product data was grouped into predefined consumer baskets. For example, a basket could contain milk, bread, eggs, rice, cooking oil, cereal, snacks, soft drinks, detergent, and personal-care products. The system calculated comparable basket totals across the five monitored retailers, allowing analysts to identify which retailer offered the most competitive overall basket.
Phase 5: Automated Validation
Validation rules checked for missing prices, unexpected price changes, duplicate records, unavailable products, and abnormal values. Failed records were flagged for review while valid records continued through the pipeline.
Phase 6: Analytics and Reporting
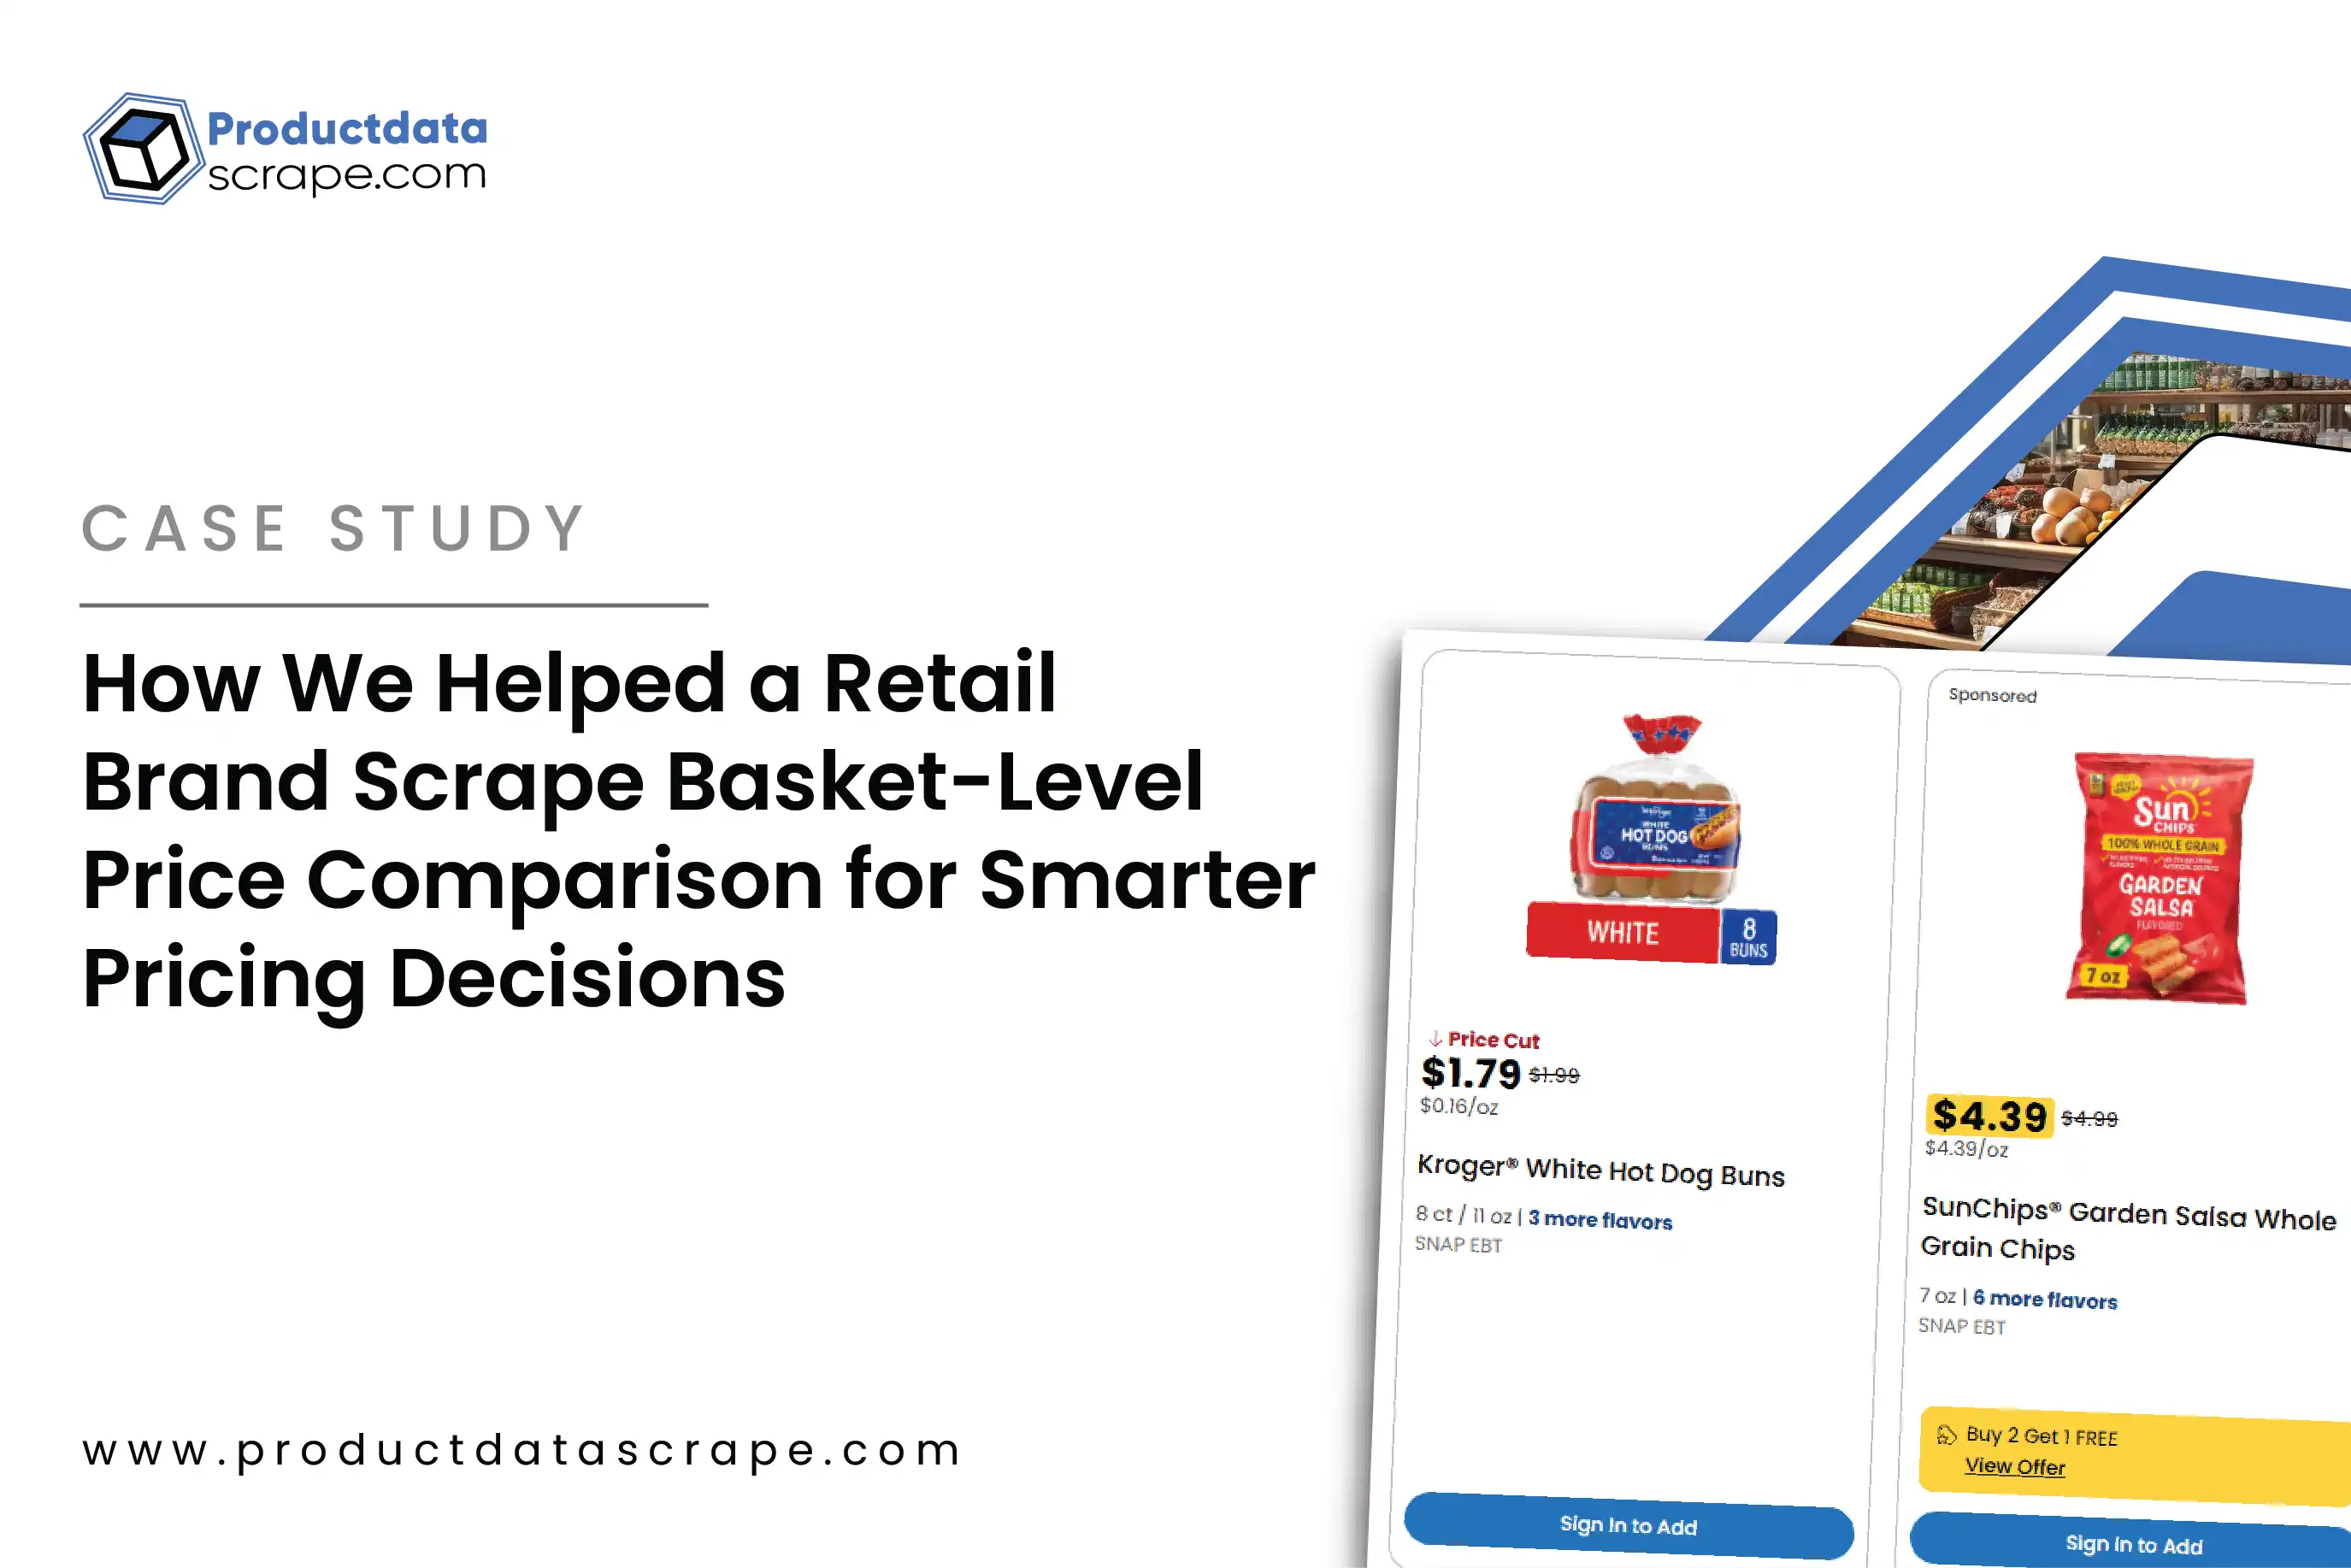
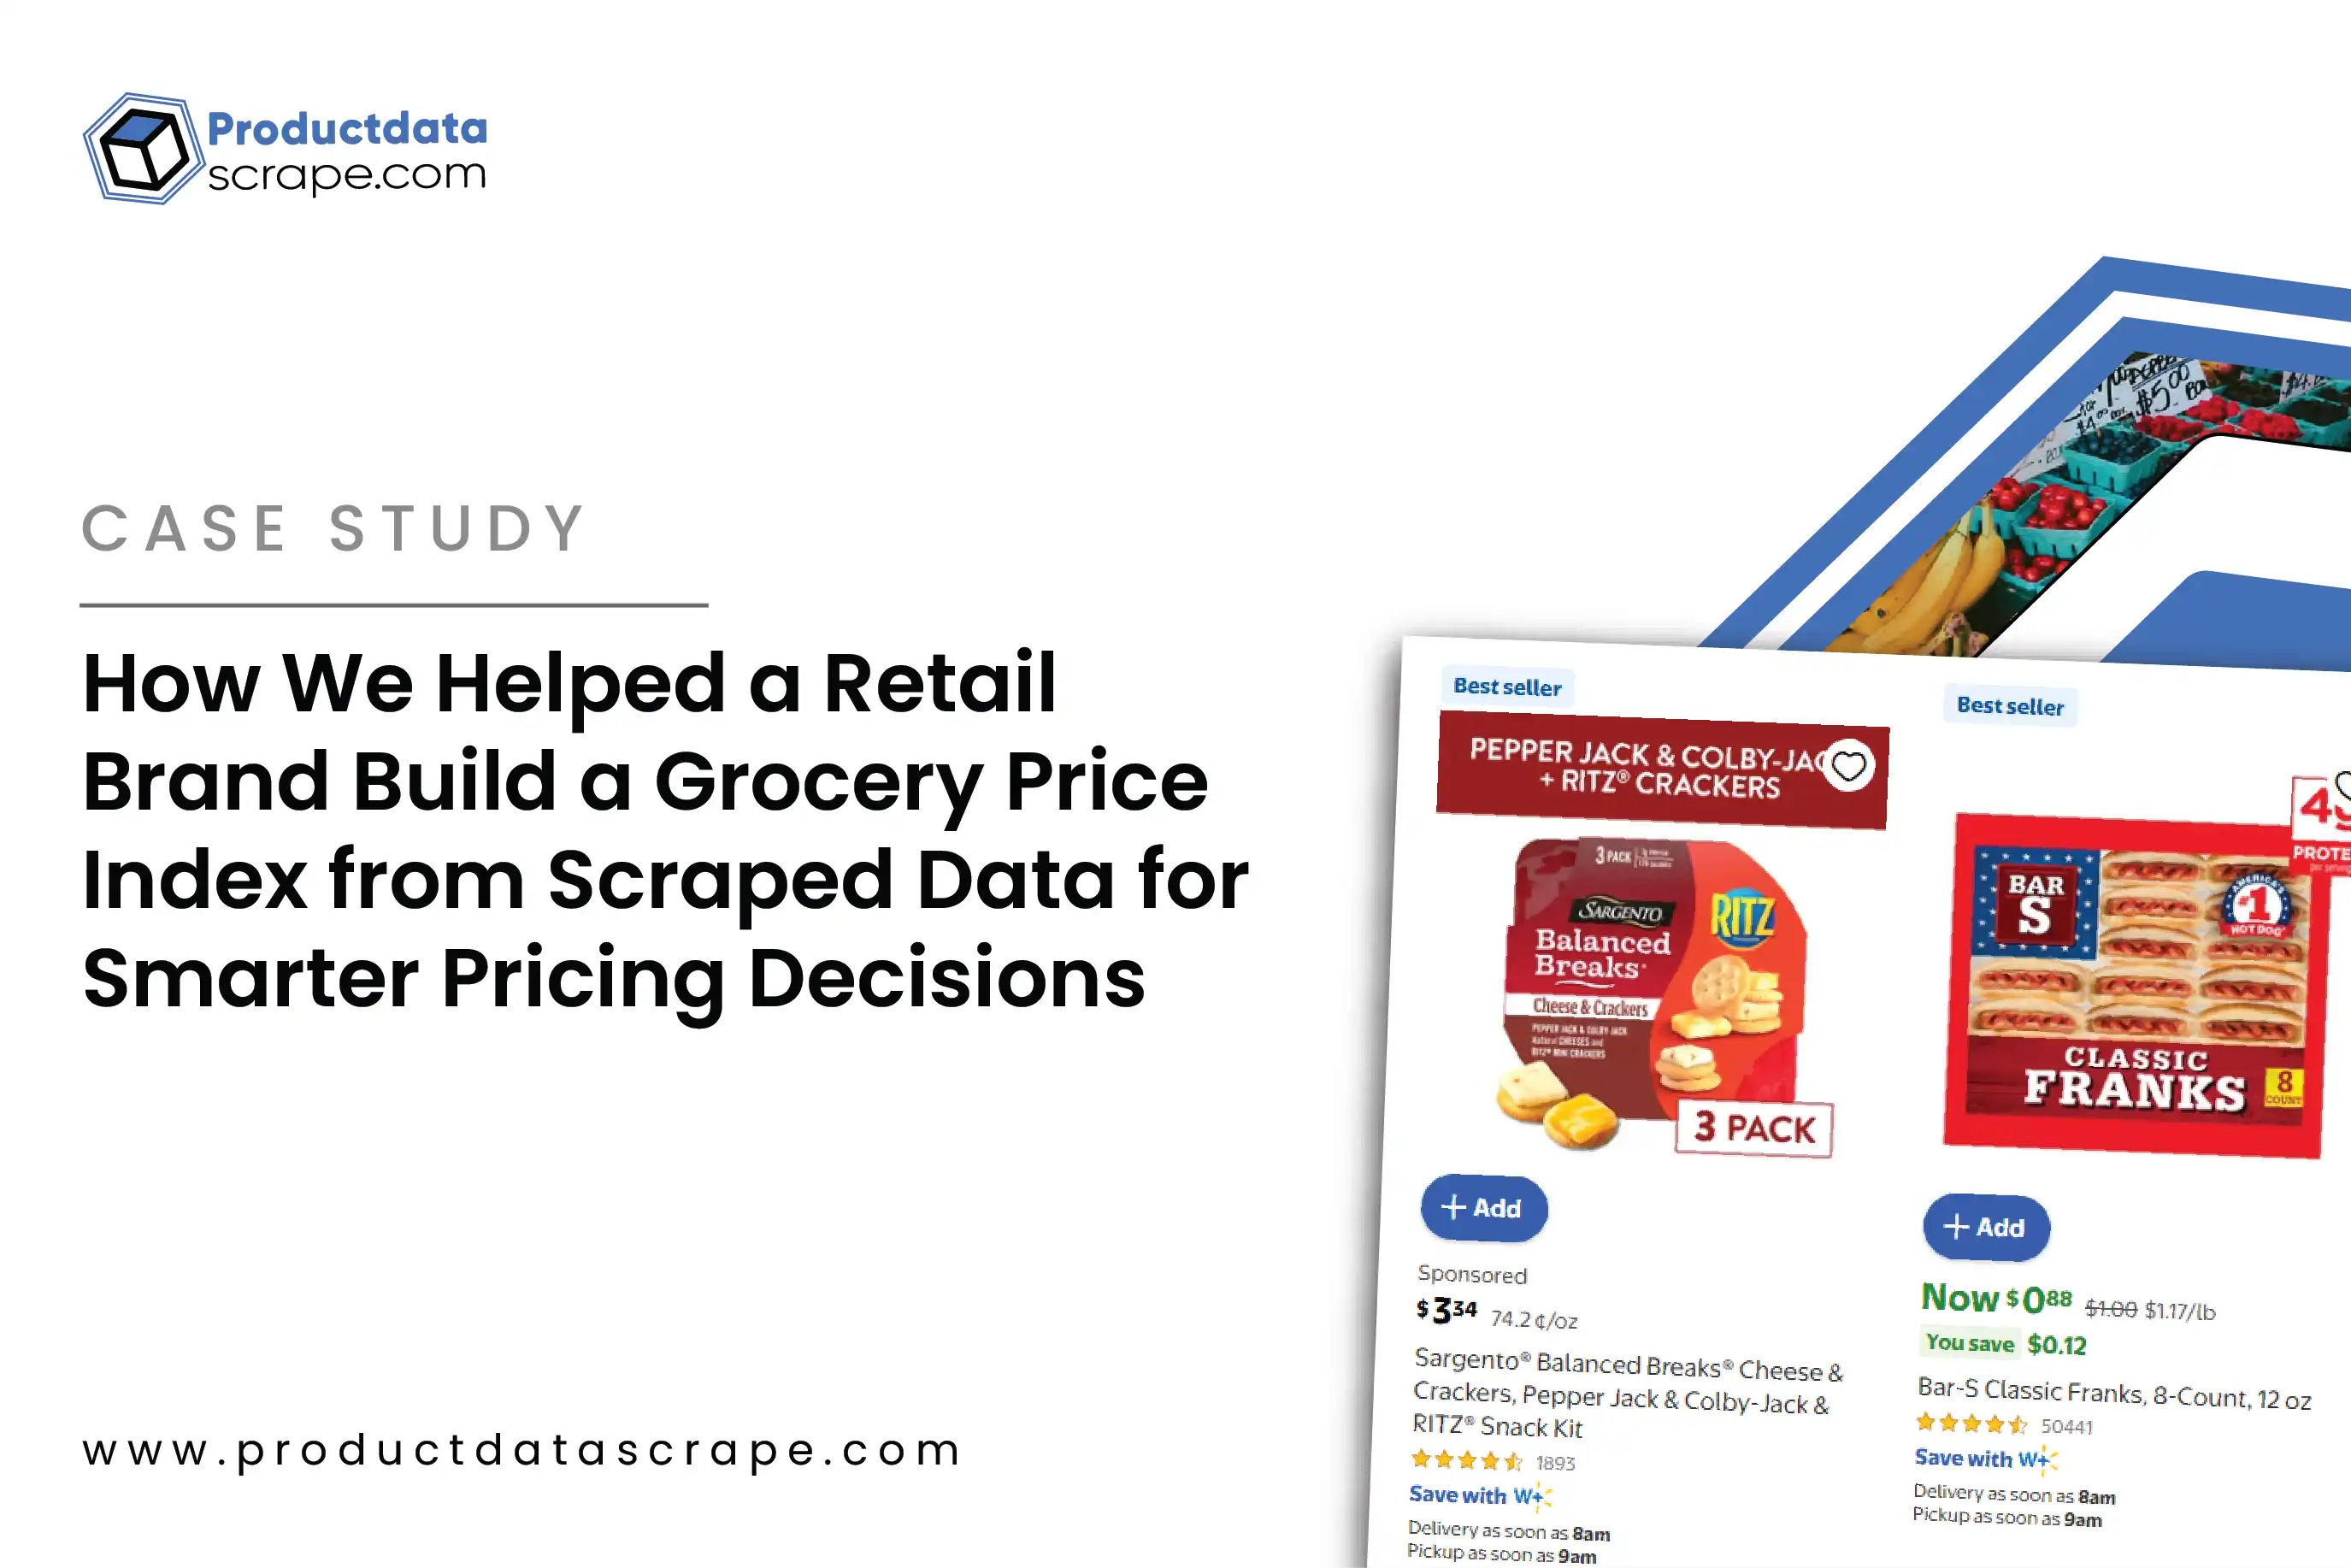
The final datasets were delivered into analytics workflows where pricing teams could monitor basket totals, retailer differences, product-level movements, promotional activity, and availability changes. The complete framework supported Grocery Basket Price Monitoring Across Multiple Chains while maintaining consistent data structures for historical analysis. The result was a scalable Scrape Basket-Level Price Comparison workflow that transformed fragmented online grocery data into structured competitive intelligence.
Results & Key Metrics
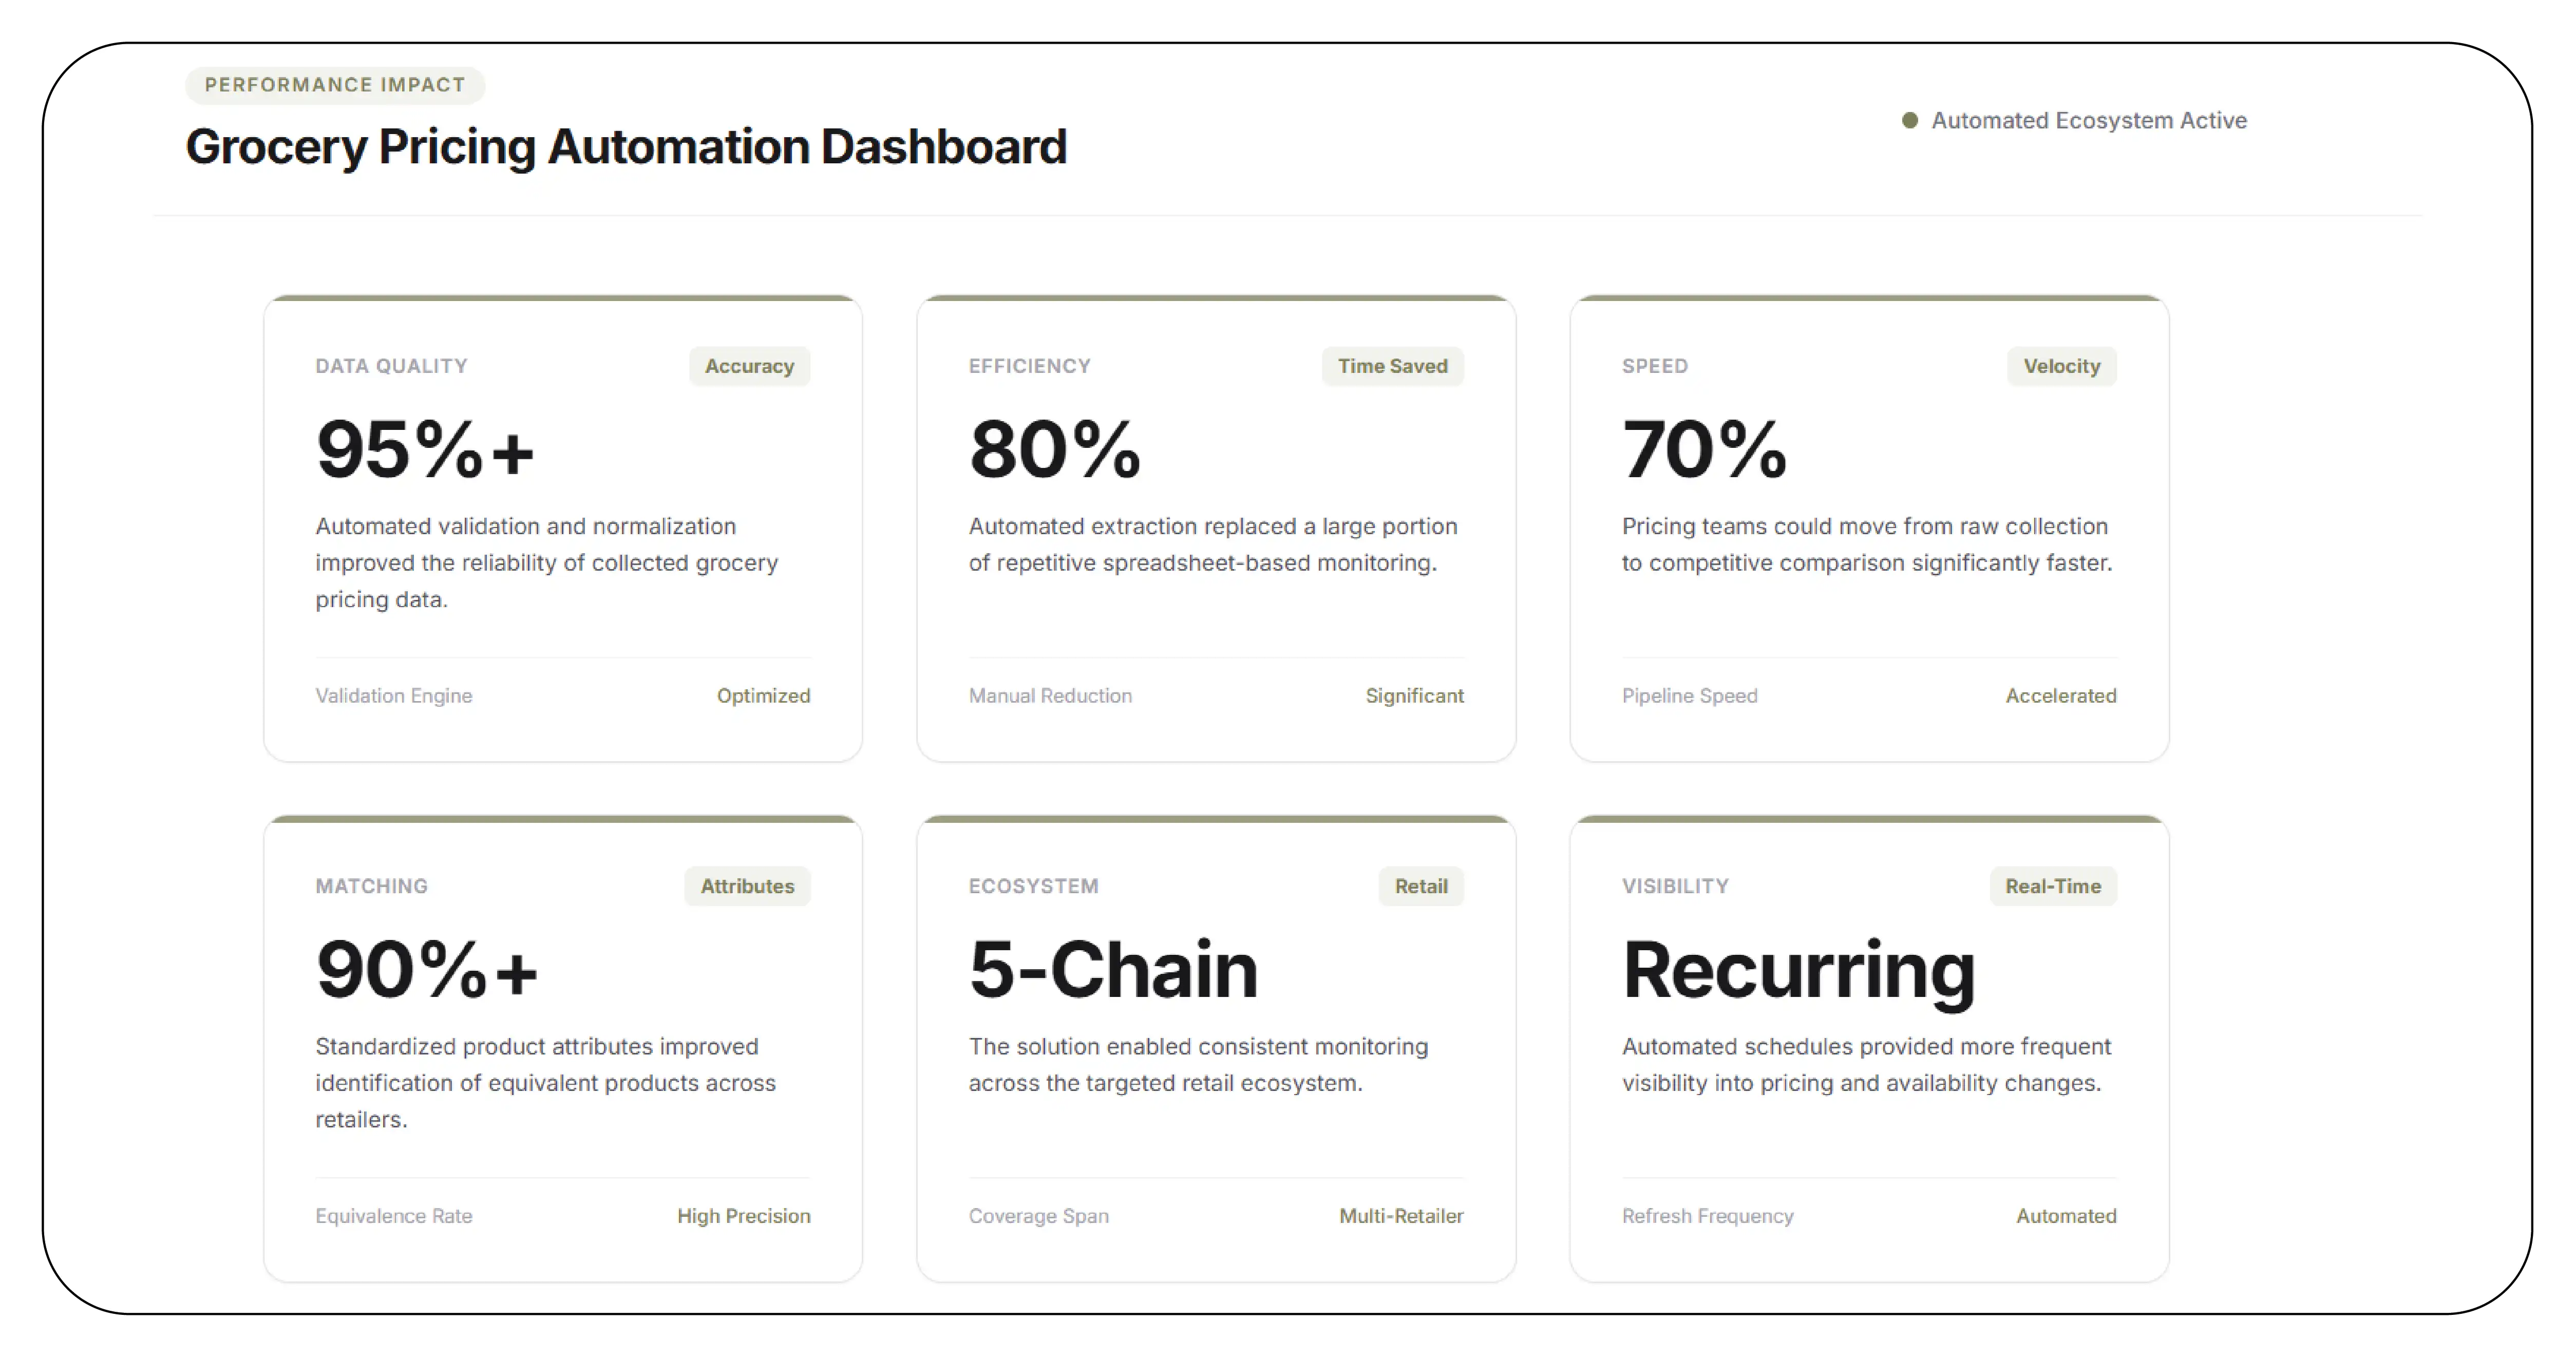
95%+ data accuracy: Automated validation and normalization improved the reliability of collected grocery pricing data.
80% lower manual effort: Automated extraction replaced a large portion of repetitive spreadsheet-based monitoring.
70% faster analysis: Pricing teams could move from raw collection to competitive comparison significantly faster.
90%+ product matching: Standardized product attributes improved identification of equivalent products across retailers.
5-chain coverage: The solution enabled consistent monitoring across the targeted retail ecosystem.
Recurring refreshes: Automated schedules provided more frequent visibility into pricing and availability changes.
Results Narrative
The organization successfully Scraped Retailer Prices for Basket Comparison across five major retail chains and converted fragmented product information into a standardized competitive dataset. Pricing teams could compare complete baskets instead of relying only on individual SKU prices, helping them understand the real value proposition presented to shoppers.
The improved workflow also made it easier to identify pricing gaps involving products such as Coca-Cola, Pepsi, Nestlé, Kellogg's, Lay's, Tide, and Dove. With faster refresh cycles and stronger product matching, analysts could identify promotional changes and competitive movements earlier. The new Scrape Basket-Level Price Comparison framework ultimately gave category and pricing teams a more consistent foundation for competitive decision-making.
What Made Product Data Scrape Different
Product Data Scrape combined automated collection with intelligent normalization and product matching rather than simply delivering raw retailer listings. The framework was designed to understand grocery products in the context of comparable baskets, pack sizes, brands, and retailer availability.
Its automated Price monitoring capabilities allowed recurring collection and validation without requiring analysts to manually revisit every retailer. Data-quality checks helped identify anomalies, missing values, duplicate listings, and unexpected changes before information entered reporting workflows.
The solution also supported scalable category expansion. Once the framework was established, additional products, brands, retailers, locations, and basket definitions could be incorporated without redesigning the entire process.
Most importantly, the Scrape Basket-Level Price Comparison approach shifted competitive analysis from isolated SKU tracking toward a more realistic view of shopper spending and retailer positioning.
Client's Testimonial
"Product Data Scrape helped us transform the way we monitor grocery pricing. Previously, our analysts spent significant time checking individual retailer listings and consolidating information manually. The automated solution gave us a much clearer view of complete shopping baskets, competitor pricing, promotions, and product availability. The ability to Automate Grocery Data Collection has significantly improved the speed of our reporting and reduced repetitive work for our teams. We can now respond more confidently to competitive pricing changes and evaluate our assortment against major retail channels. The solution has also created a scalable foundation that we can extend into additional categories and markets as our requirements grow."
— Director of Pricing & Competitive Intelligence, Leading Retail & FMCG Organization
Conclusion
The grocery retail environment is increasingly shaped by price transparency, promotions, assortment changes, and digital shopping behavior. Grocery Chains Use Data Scraping to gain faster visibility into these market movements and understand how competitors position everyday products.
For the client, the implementation created a reliable framework for comparing complete shopping baskets across five retail chains. Automated collection, product matching, normalization, validation, and analytics significantly improved both speed and data consistency.
The project demonstrated how Scrape Basket-Level Price Comparison can help retailers move beyond isolated product tracking and understand competitive value at the total-basket level. With a scalable foundation in place, the organization can expand monitoring into additional retailers, categories, locations, and pricing scenarios while making faster, more informed decisions.
FAQs
1. What is basket-level price comparison?
Basket-level price comparison evaluates the combined cost of a predefined group of products across different retailers. Instead of comparing only one SKU, businesses can assess the total amount a shopper may spend on a typical basket. This provides a broader view of competitive pricing and helps identify which retailer offers stronger overall value.
2. Which products can be included in a grocery basket?
A basket can include everyday products such as milk, bread, eggs, rice, flour, cooking oil, cereal, snacks, beverages, detergents, and personal-care products. Branded items from Coca-Cola, Pepsi, Nestlé, Kellogg's, Lay's, Tide, and Dove can also be included where relevant.
3. Why is product matching important?
Product matching ensures that retailers are comparing equivalent or sufficiently similar products. For example, a 500g cereal pack should not be directly compared with a 1kg pack without adjusting for pack size. Matching considers brand, product attributes, size, unit, SKU, and configuration.
4. How often can grocery pricing data be collected?
Collection frequency depends on the business requirement and retailer environment. Data can be scheduled at regular intervals to support daily, weekly, or more frequent competitive monitoring. Automated refreshes help organizations detect price, promotion, and availability changes faster.
5. How can retailers use basket-level intelligence?
Retailers can use basket intelligence for competitive benchmarking, pricing strategy, promotional planning, assortment decisions, category management, and market monitoring. It can also help identify retailers with lower basket totals and reveal which products contribute most to competitive price differences.


 Singapore
 EMAIL
EMAIL
 PHONE
PHONE















.webp)






