Introduction
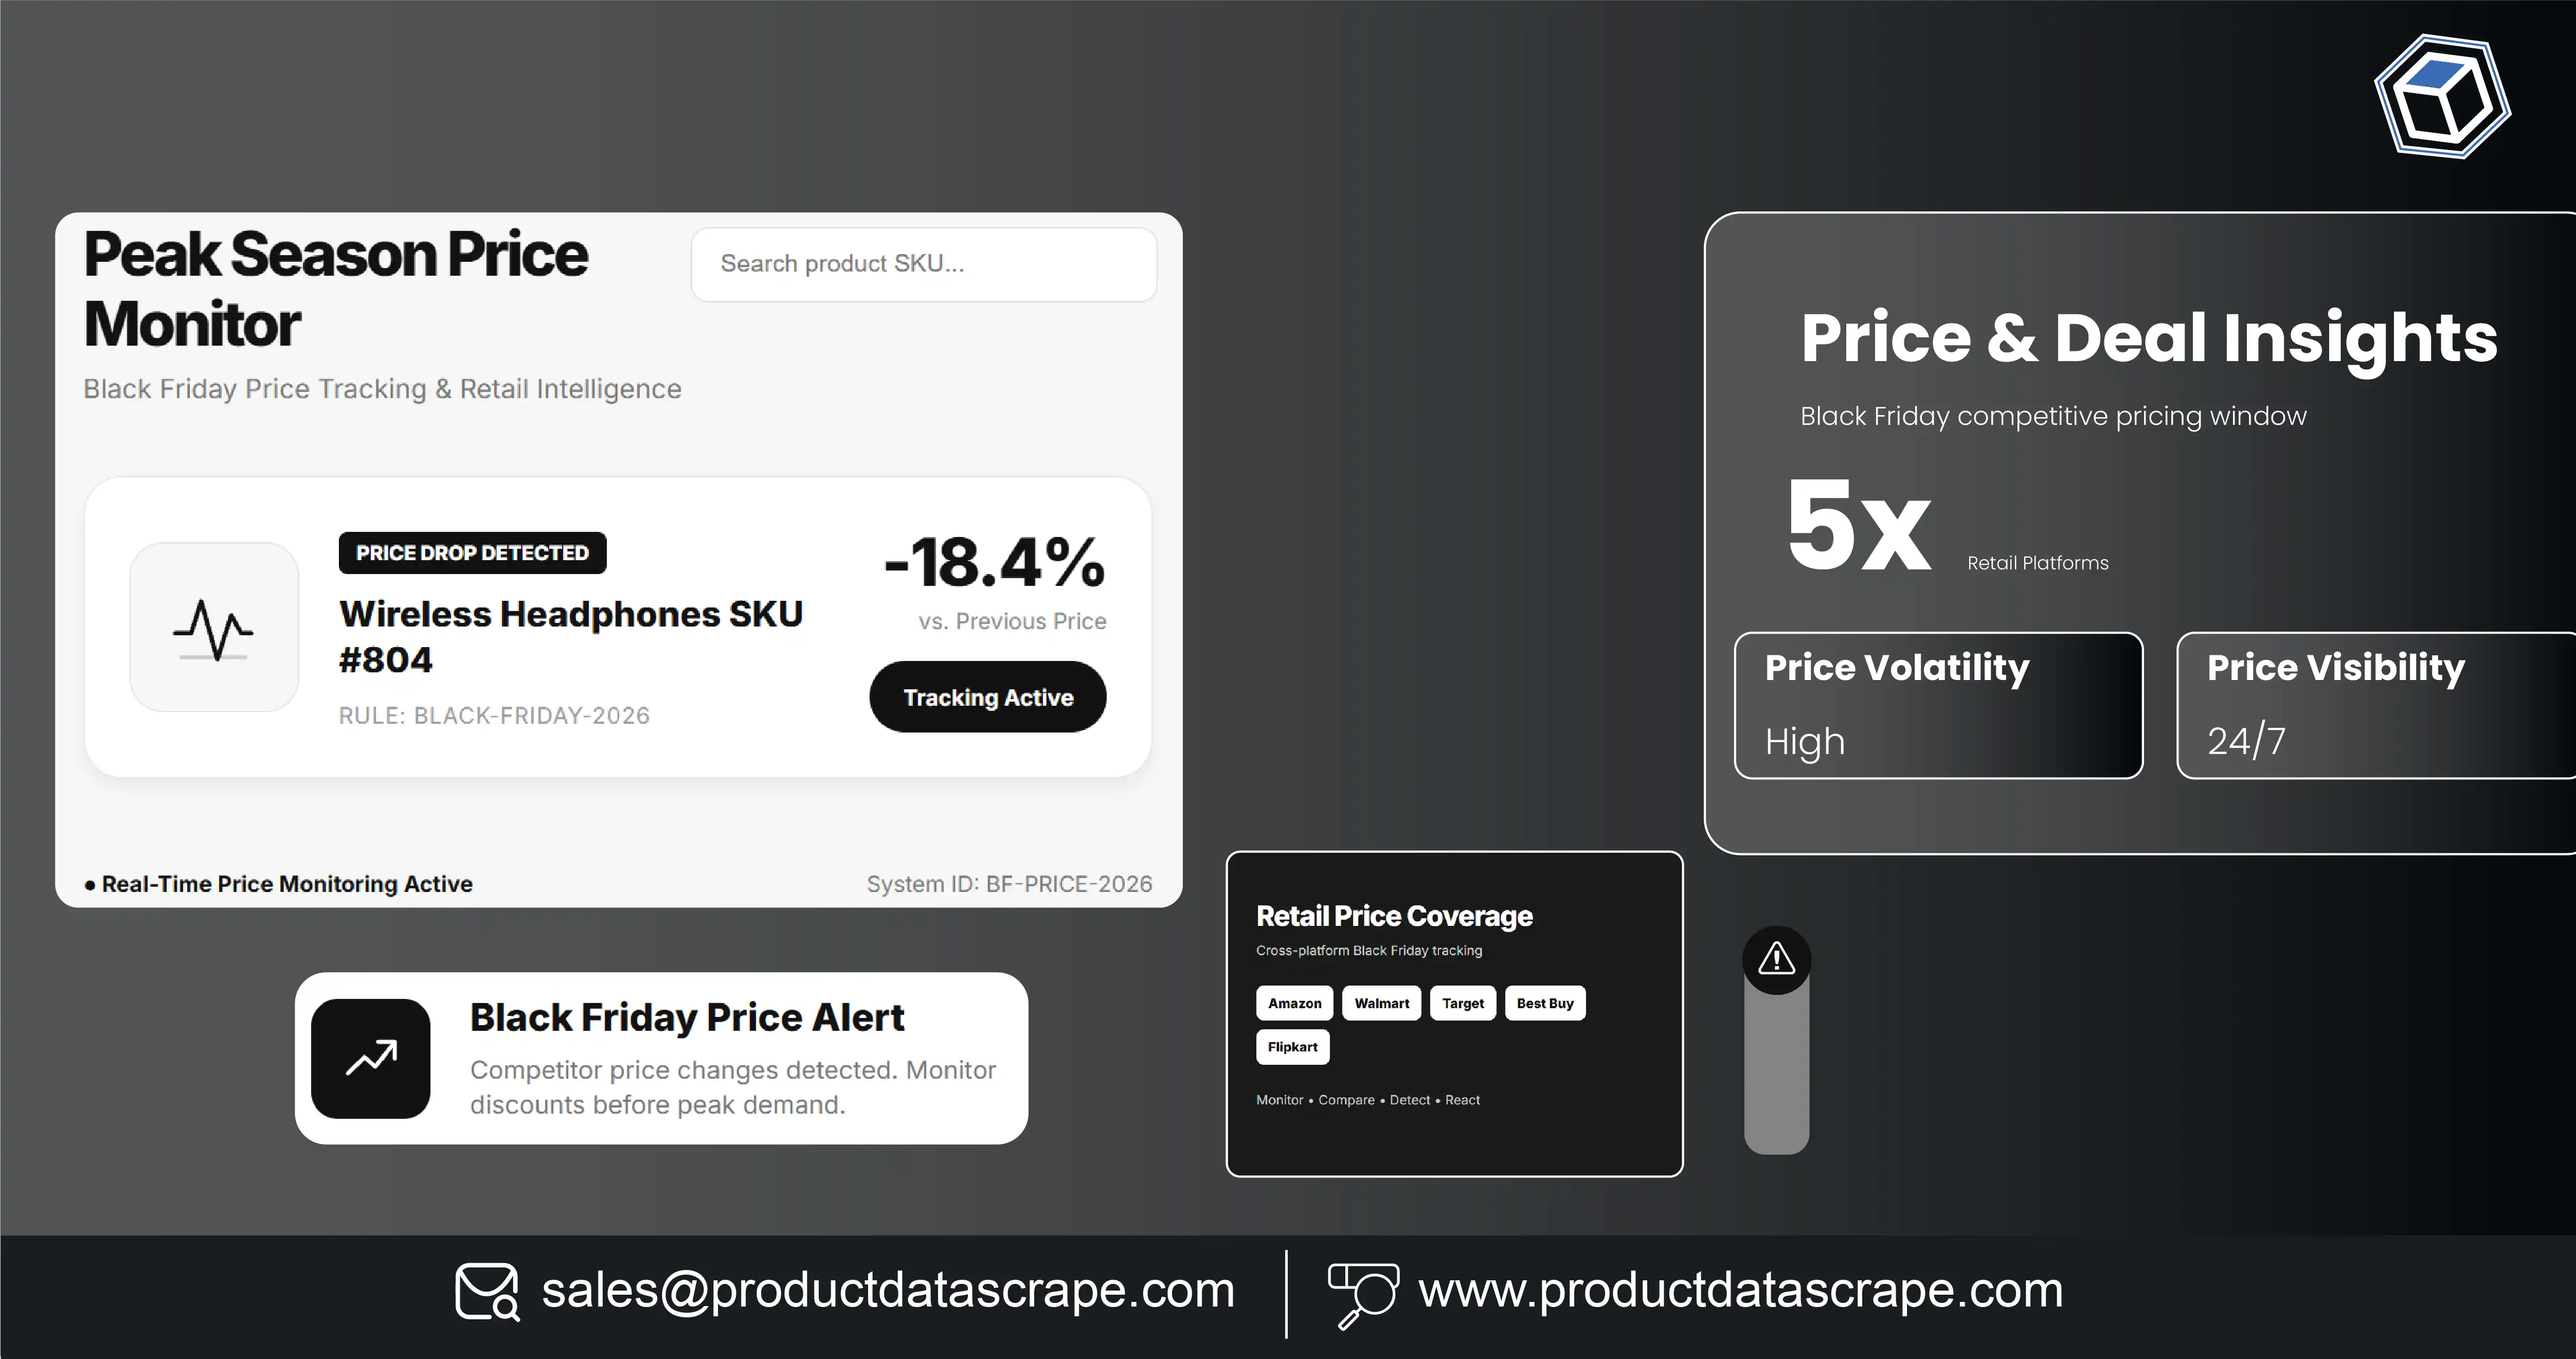
The most effective way to solve peak-season price monitoring is to automate product-level collection, normalize historical prices, and compare competitor offers continuously. Black Friday price tracking gives retailers and brands the visibility needed to identify genuine discounts, pricing changes, and promotional patterns before making decisions. Major retailers such as Amazon, Walmart, Target, Best Buy, and Flipkart can experience significant product-level pricing activity during major shopping events, making continuous monitoring valuable for competitive research.
Black Friday creates an unusually competitive retail environment. Products can move between regular prices, promotional prices, bundles, coupons, and limited-time offers within short periods. For pricing managers, e-commerce analysts, retailers, and market intelligence teams, manually checking hundreds or thousands of products is inefficient and makes historical comparison difficult.
A structured Black Friday Insights dataset can capture product names, categories, current prices, previous prices, discounts, availability, ratings, reviews, promotions, and timestamps. Historical snapshots then allow businesses to distinguish temporary promotions from meaningful price movements across marketplaces and retail websites.
The following sections explain how automated data collection can help businesses analyze price drops, identify deals, monitor competitors, and improve promotional decisions during high-volume shopping periods.
How Can Businesses Identify Genuine Discounts More Accurately?
Black Friday price drop analysis helps businesses determine how prices change before, during, and after promotional periods. The critical issue is that a displayed discount does not necessarily provide enough context to determine whether an offer represents a meaningful reduction. Historical price records provide that context.
For example, a pricing analyst can compare a Black Friday price with observations collected 7, 14, 30, or 90 days earlier. This makes it possible to calculate absolute price changes, percentage reductions, and the frequency of promotional pricing. Businesses can then classify products into stable-price, moderate-discount, and high-discount groups.
For retailers such as Amazon, Walmart, Target, Best Buy, and Flipkart, this information can support competitive benchmarking across products and categories. Brands can also evaluate how frequently retailers discount their products and whether competitor offers are changing during the same promotional window.
For consumers and deal intelligence platforms, historical records can help identify products with substantial price reductions rather than relying solely on advertised discount percentages.
The broader importance of Black Friday is visible in U.S. retail spending data. Adobe Analytics reported that online Black Friday sales reached $9.8 billion in 2023, $10.8 billion in 2024, and $11.8 billion in 2025.
| Year |
U.S. Online Black Friday Sales |
Analytical Opportunity |
| 2020 |
~$9.0B* |
Establish pandemic-era benchmark |
| 2021 |
~$8.9B* |
Compare promotional intensity |
| 2022 |
~$9.1B* |
Analyze recovery patterns |
| 2023 |
$9.8B |
Track digital demand |
| 2024 |
$10.8B |
Benchmark promotional activity |
| 2025 |
$11.8B |
Measure record online demand |
| 2026 |
Future period |
Build predictive benchmark |
*Earlier figures are rounded industry estimates; 2023–2025 figures are reported by Adobe. 2026 is a future shopping period rather than a completed result.
The actionable approach is straightforward: collect prices before the event, capture promotional-period prices, retain timestamps, and calculate changes against historical observations. This creates a more reliable basis for evaluating Black Friday offers across retailers and marketplaces.
What Data Should Businesses Collect to Understand Promotional Deals?
Black Friday deal data scraping enables retailers and market intelligence teams to collect structured information from multiple product pages and categories. The goal is not simply to capture a discounted price. A useful dataset should preserve the information required to understand the commercial context of each offer.
Relevant fields can include product title, brand, category, product URL, regular price, sale price, discount percentage, availability, product rating, review count, promotional text, collection timestamp, and product identifiers where publicly available.
Historical records are particularly valuable because Black Friday promotions often evolve across several days. A retailer such as Walmart may introduce an offer before Thanksgiving, while Amazon or Best Buy may modify a comparable product's price several times during the same period. Collecting snapshots at regular intervals allows analysts to reconstruct the price journey.
Adobe reported that Cyber Week online spending in the United States reached $38.1 billion in 2025, demonstrating the scale of the promotional period beyond Black Friday itself.
| Year |
Black Friday Online Sales |
Data Collection Focus |
| 2020 |
~$9.0B |
Capture baseline promotional behavior |
| 2021 |
~$8.9B |
Compare discount strategies |
| 2022 |
~$9.1B |
Track category-level pricing |
| 2023 |
$9.8B |
Monitor offer expansion |
| 2024 |
$10.8B |
Benchmark deal depth |
| 2025 |
$11.8B |
Analyze record digital demand |
| 2026 |
Future period |
Apply historical benchmarks |
For a pricing manager, the practical benefit is greater visibility. Instead of maintaining disconnected spreadsheets, the business can create a structured dataset that supports price comparisons across products and retailers such as Amazon, Walmart, Target, Best Buy, and other relevant marketplaces.
Deal datasets can also support downstream applications such as promotional dashboards, price alerts, competitive intelligence systems, and market research reports. The key is maintaining consistent fields and timestamps throughout the collection period.
How Can Retailers Detect Price Changes While Promotions Are Running?
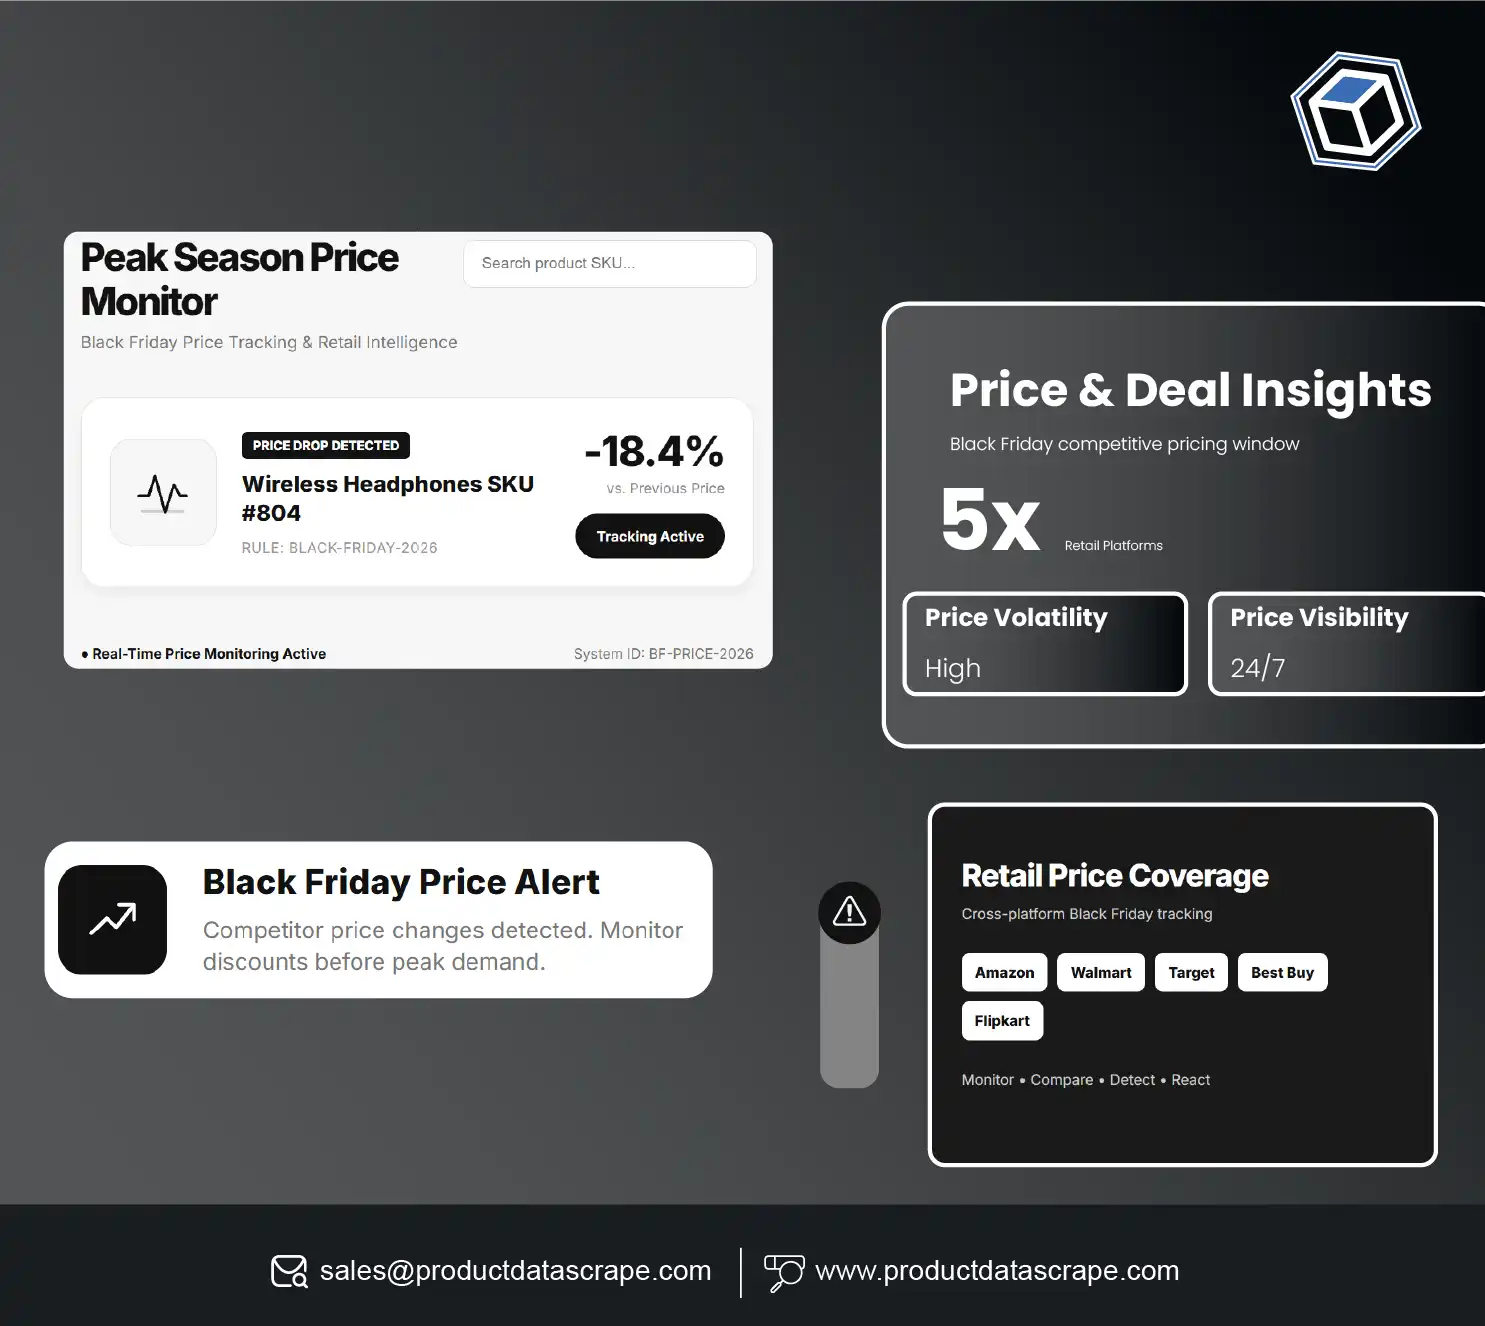
real-time Black Friday price monitoring helps businesses respond to rapid price movements instead of relying exclusively on end-of-day or post-event reports. During high-volume shopping periods, a product's price can change multiple times, making delayed data less useful for time-sensitive decisions.
A real-time or near-real-time workflow can prioritize high-value products and categories. Instead of collecting every product at identical intervals, businesses can assign different monitoring frequencies based on importance. High-revenue products, high-traffic categories, or products with aggressive competitors can receive more frequent checks.
For example, an e-commerce team tracking televisions, laptops, smartphones, gaming consoles, appliances, or other high-demand categories can compare pricing activity across Amazon, Walmart, Target, Best Buy, and Flipkart. If a major competitor changes the price of a popular product, an automated system can record the movement and make the information available for analysis.
The monitoring system can compare each new observation with the previous record. If the price changes beyond a defined threshold, the product can be flagged for analysis. Similar rules can be applied to availability, discounts, or promotional messaging.
Adobe reported that online Black Friday spending in the U.S. reached $11.8 billion in 2025, up 9.1% from the previous year. This growing transaction value increases the potential impact of pricing decisions during the event.
| Year |
Online Black Friday Sales |
Monitoring Priority |
| 2020 |
~$9.0B |
Establish monitoring baseline |
| 2021 |
~$8.9B |
Track changing consumer demand |
| 2022 |
~$9.1B |
Monitor price normalization |
| 2023 |
$9.8B |
Increase category coverage |
| 2024 |
$10.8B |
Monitor competitive promotions |
| 2025 |
$11.8B |
Strengthen real-time alerts |
| 2026 |
Future period |
Use historical models for planning |
A practical monitoring workflow should also preserve the previous value. Capturing only the newest price means businesses lose the ability to calculate the direction and magnitude of change.
For pricing teams, this creates a simple operational advantage: instead of asking, "What is the price now?", analysts can answer, "What changed, when did it change, and how does the current offer compare with its historical position?"
How Can Historical Data Improve Seasonal Pricing Decisions?
Black Friday pricing data scraping creates a historical foundation for understanding promotional behavior across products, categories, and retailers. This is especially useful for businesses planning their own campaigns because historical pricing can reveal common discount ranges and timing patterns.
A retailer can compare current promotional prices against the same product's historical observations. Analysts can also examine category-level averages to determine whether a particular offer is unusually aggressive or broadly aligned with the market.
Historical data can support several practical calculations. A business can measure average pre-event price, lowest observed price, maximum discount, price volatility, promotion duration, and recovery time after the event. These metrics can then feed pricing and merchandising decisions.
Black Friday has also become increasingly digital. Adobe reported $9.8 billion in U.S. online Black Friday sales in 2023 and $10.8 billion in 2024.
| Year |
Online Black Friday Sales |
Historical Data Application |
| 2020 |
~$9.0B |
Establish seasonal baseline |
| 2021 |
~$8.9B |
Compare price movements |
| 2022 |
~$9.1B |
Analyze promotional stability |
| 2023 |
$9.8B |
Expand product benchmarking |
| 2024 |
$10.8B |
Compare category discounts |
| 2025 |
$11.8B |
Measure promotional escalation |
| 2026 |
Future period |
Forecast and benchmark offers |
Historical datasets can also help identify false assumptions. A product marketed with "50% off" may have spent much of the preceding period at a similar price. Conversely, a smaller advertised discount may represent a substantial reduction from a stable historical price.
For this reason, effective price intelligence should evaluate both advertised discount and historical price position. That distinction helps retailers and brands make better promotional decisions and gives analysts stronger evidence for market reporting.
How Can Brands Compare Competitor Offers During Black Friday?
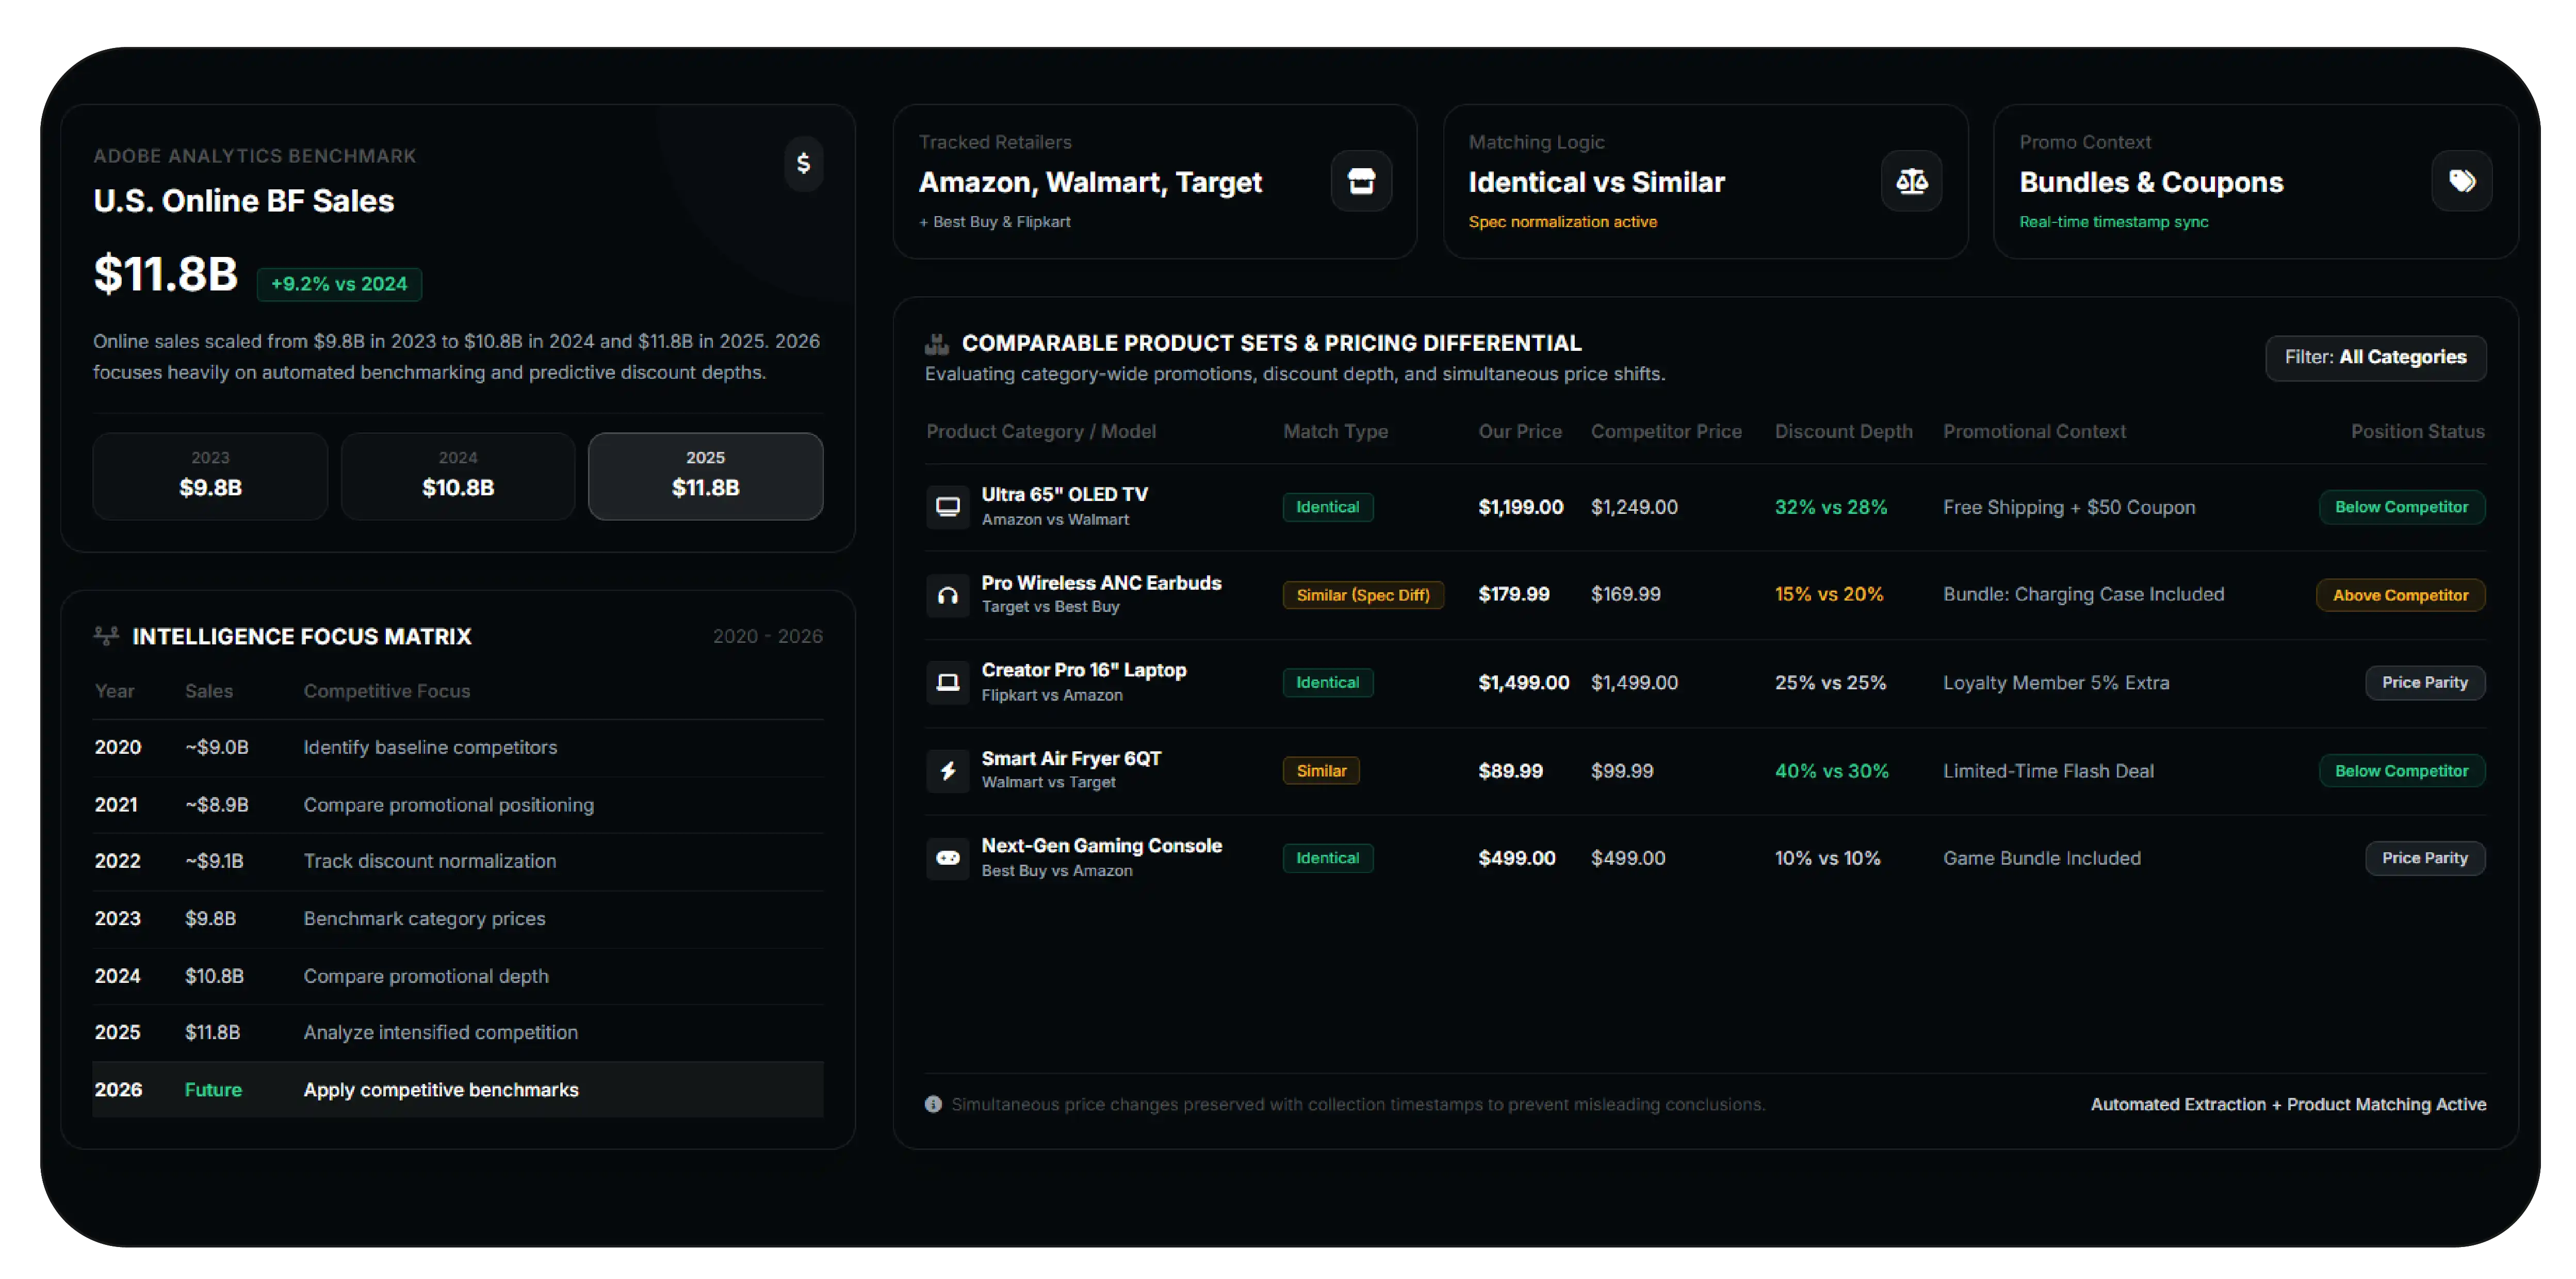
Black Friday competitor pricing analysis allows brands and retailers to understand how their offers compare with competing products during the same shopping period. Competitive analysis becomes especially useful when products are directly comparable by category, brand, specifications, size, or customer segment.
A structured dataset can group competitor products into comparable sets and calculate differences between current prices. Analysts can then identify products where their prices are above, below, or close to competitors. They can also compare discount depth rather than absolute price alone.
This matters because Black Friday competition is not limited to individual products. Retailers such as Amazon, Walmart, Target, Best Buy, and Flipkart compete through category-wide promotions, bundles, free shipping, loyalty offers, coupons, and limited-time campaigns. A comprehensive dataset therefore needs to capture promotional context wherever publicly available.
U.S. online Black Friday sales grew from $9.8 billion in 2023 to $10.8 billion in 2024 and $11.8 billion in 2025, according to Adobe Analytics.
| Year |
Online Sales |
Competitive Intelligence Focus |
| 2020 |
~$9.0B |
Identify baseline competitors |
| 2021 |
~$8.9B |
Compare promotional positioning |
| 2022 |
~$9.1B |
Track discount normalization |
| 2023 |
$9.8B |
Benchmark category prices |
| 2024 |
$10.8B |
Compare promotional depth |
| 2025 |
$11.8B |
Analyze intensified competition |
| 2026 |
Future period |
Apply competitive benchmarks |
A useful competitor dataset should preserve collection timestamps because simultaneous prices can change independently. It should also distinguish between identical products and merely similar products.
For example, two televisions may have similar screen sizes but different specifications. Comparing their prices without accounting for those differences could produce misleading conclusions.
The strongest competitive intelligence therefore combines automated extraction with product matching, normalization, historical records, and analytical rules.
How Can Continuous Competitor Monitoring Improve Black Friday Strategy?
Competitor price monitoring, Black Friday price tracking can help businesses move from reactive reporting toward proactive pricing decisions. Instead of analyzing competitor prices only after Black Friday ends, teams can monitor changes before and during the event.
A useful workflow starts several weeks before Black Friday. Businesses can establish baseline prices, identify priority products, map comparable competitor products, and collect historical observations. During the event, monitoring frequency can increase. After the event, collection can continue to measure how quickly prices return to normal.
For example, a brand selling consumer electronics could monitor comparable listings across Amazon, Walmart, Best Buy, Target, and Flipkart. A grocery or household-products business could establish category-specific monitoring rules and compare promotional behavior across relevant retailers.
This three-stage approach creates a complete seasonal dataset. Pre-event records establish context, event-period records capture promotional behavior, and post-event records reveal whether discounts were temporary or sustained.
Adobe's 2025 results show why this period deserves focused monitoring. Black Friday online spending reached $11.8 billion, while Cyber Week generated $38.1 billion in total online spending in the United States.
| Year |
Black Friday Online Sales |
Recommended Monitoring Model |
| 2020 |
~$9.0B |
Baseline collection |
| 2021 |
~$8.9B |
Seasonal comparison |
| 2022 |
~$9.1B |
Competitor mapping |
| 2023 |
$9.8B |
Pre-event monitoring |
| 2024 |
$10.8B |
Higher-frequency tracking |
| 2025 |
$11.8B |
Continuous event monitoring |
| 2026 |
Future period |
Predictive seasonal planning |
The data can then be converted into business metrics such as competitor price gap, average discount, lowest historical price, price volatility, promotional duration, and category-level discount intensity.
For e-commerce managers, these metrics can support decisions around promotional timing and product positioning. For brands, they can reveal how retailers position their products during peak demand. For market intelligence providers, the same records can become reusable datasets for client reporting.
The most important principle is to monitor the change, not merely the current value. A current price without historical context provides limited intelligence. A timestamped sequence of prices provides a story that analysts can measure.
Why Choose Product Data Scrape?
pricing data scraping becomes more valuable when it is designed around recurring business questions rather than one-time collection. Product Data Scrape helps businesses structure product-level information for price monitoring, competitor research, promotional analysis, and market intelligence.
Its workflows can support major retail environments and marketplaces, including Amazon, Walmart, Target, Best Buy, Flipkart, and other relevant sources, depending on project requirements and data availability. Structured collection can capture product information, prices, discounts, availability, ratings, reviews, and timestamps for downstream analysis.
For pricing managers and e-commerce analysts, this approach reduces repetitive manual checks while creating a more consistent analytical foundation. Teams can compare historical and current prices, identify changes, organize competitor records, and feed structured information into dashboards or research systems.
The focus remains on usable data, consistent collection, scalable workflows, and actionable commercial insights for peak shopping periods.
Conclusion
Peak-season pricing becomes difficult when product volumes and price changes outpace manual monitoring. Festive Grocery Price Scraping can extend the same intelligence approach into grocery and seasonal retail categories, while historical pricing datasets can help businesses understand promotional timing, discount depth, and competitor positioning.
The key is to establish baseline prices before an event, monitor changes during the event, and continue collecting data afterward. This creates the historical context required to distinguish genuine price reductions from short-term promotional messaging.
For retailers, brands, pricing analysts, and e-commerce intelligence teams, the objective is simple: make pricing decisions using structured evidence rather than isolated observations.
Businesses tracking major retailers such as Amazon, Walmart, Target, Best Buy, and Flipkart can use structured datasets to evaluate product-level movements, promotional intensity, and competitive positioning throughout the shopping season.
Want to strengthen your peak-season pricing strategy and price and promote your brand with reliable competitive intelligence? Partner with Product Data Scrape to build scalable pricing datasets and automated monitoring workflows for Black Friday and other major shopping events!
FAQs
1. What is Black Friday price tracking?
Black Friday price tracking monitors product prices, discounts, availability, and promotional changes before and during Black Friday to help businesses benchmark competitors and identify meaningful pricing movements across retailers such as Amazon and Walmart.
2. Why is historical pricing important?
Historical pricing provides context for advertised discounts. It helps businesses determine whether a Black Friday offer represents a genuine reduction compared with previous observed prices on platforms such as Best Buy, Target, or other retail websites.
3. How often should prices be monitored?
High-priority products should be monitored more frequently during peak events. Lower-priority products can follow scheduled intervals based on business requirements, product volatility, and available resources across marketplaces such as Flipkart and Amazon.
4. What data should a business collect?
Useful fields include product name, category, price, discount, availability, product URL, timestamp, rating, review count, and promotional information where publicly available and permitted. These fields can be collected across retailers such as Walmart, Target, and Best Buy.
5. Who can benefit from automated price monitoring?
Retailers, brands, pricing analysts, e-commerce teams, market researchers, and data providers can use automated monitoring. Product Data Scrape can support structured workflows for recurring competitive pricing research across major e-commerce platforms.


 Singapore
 EMAIL
EMAIL
 PHONE
PHONE















.webp)






