Introduction
India's quick-commerce ecosystem has moved from a niche delivery model to a highly competitive retail channel where price, availability, assortment, promotions, and delivery speed can change throughout the day. Zepto, Blinkit, Swiggy Instamart, and Amazon Now are increasingly competing for the same consumers, categories, and geographic markets. For brands, retailers, sellers, and market intelligence teams, manually checking prices across these platforms is no longer sufficient.
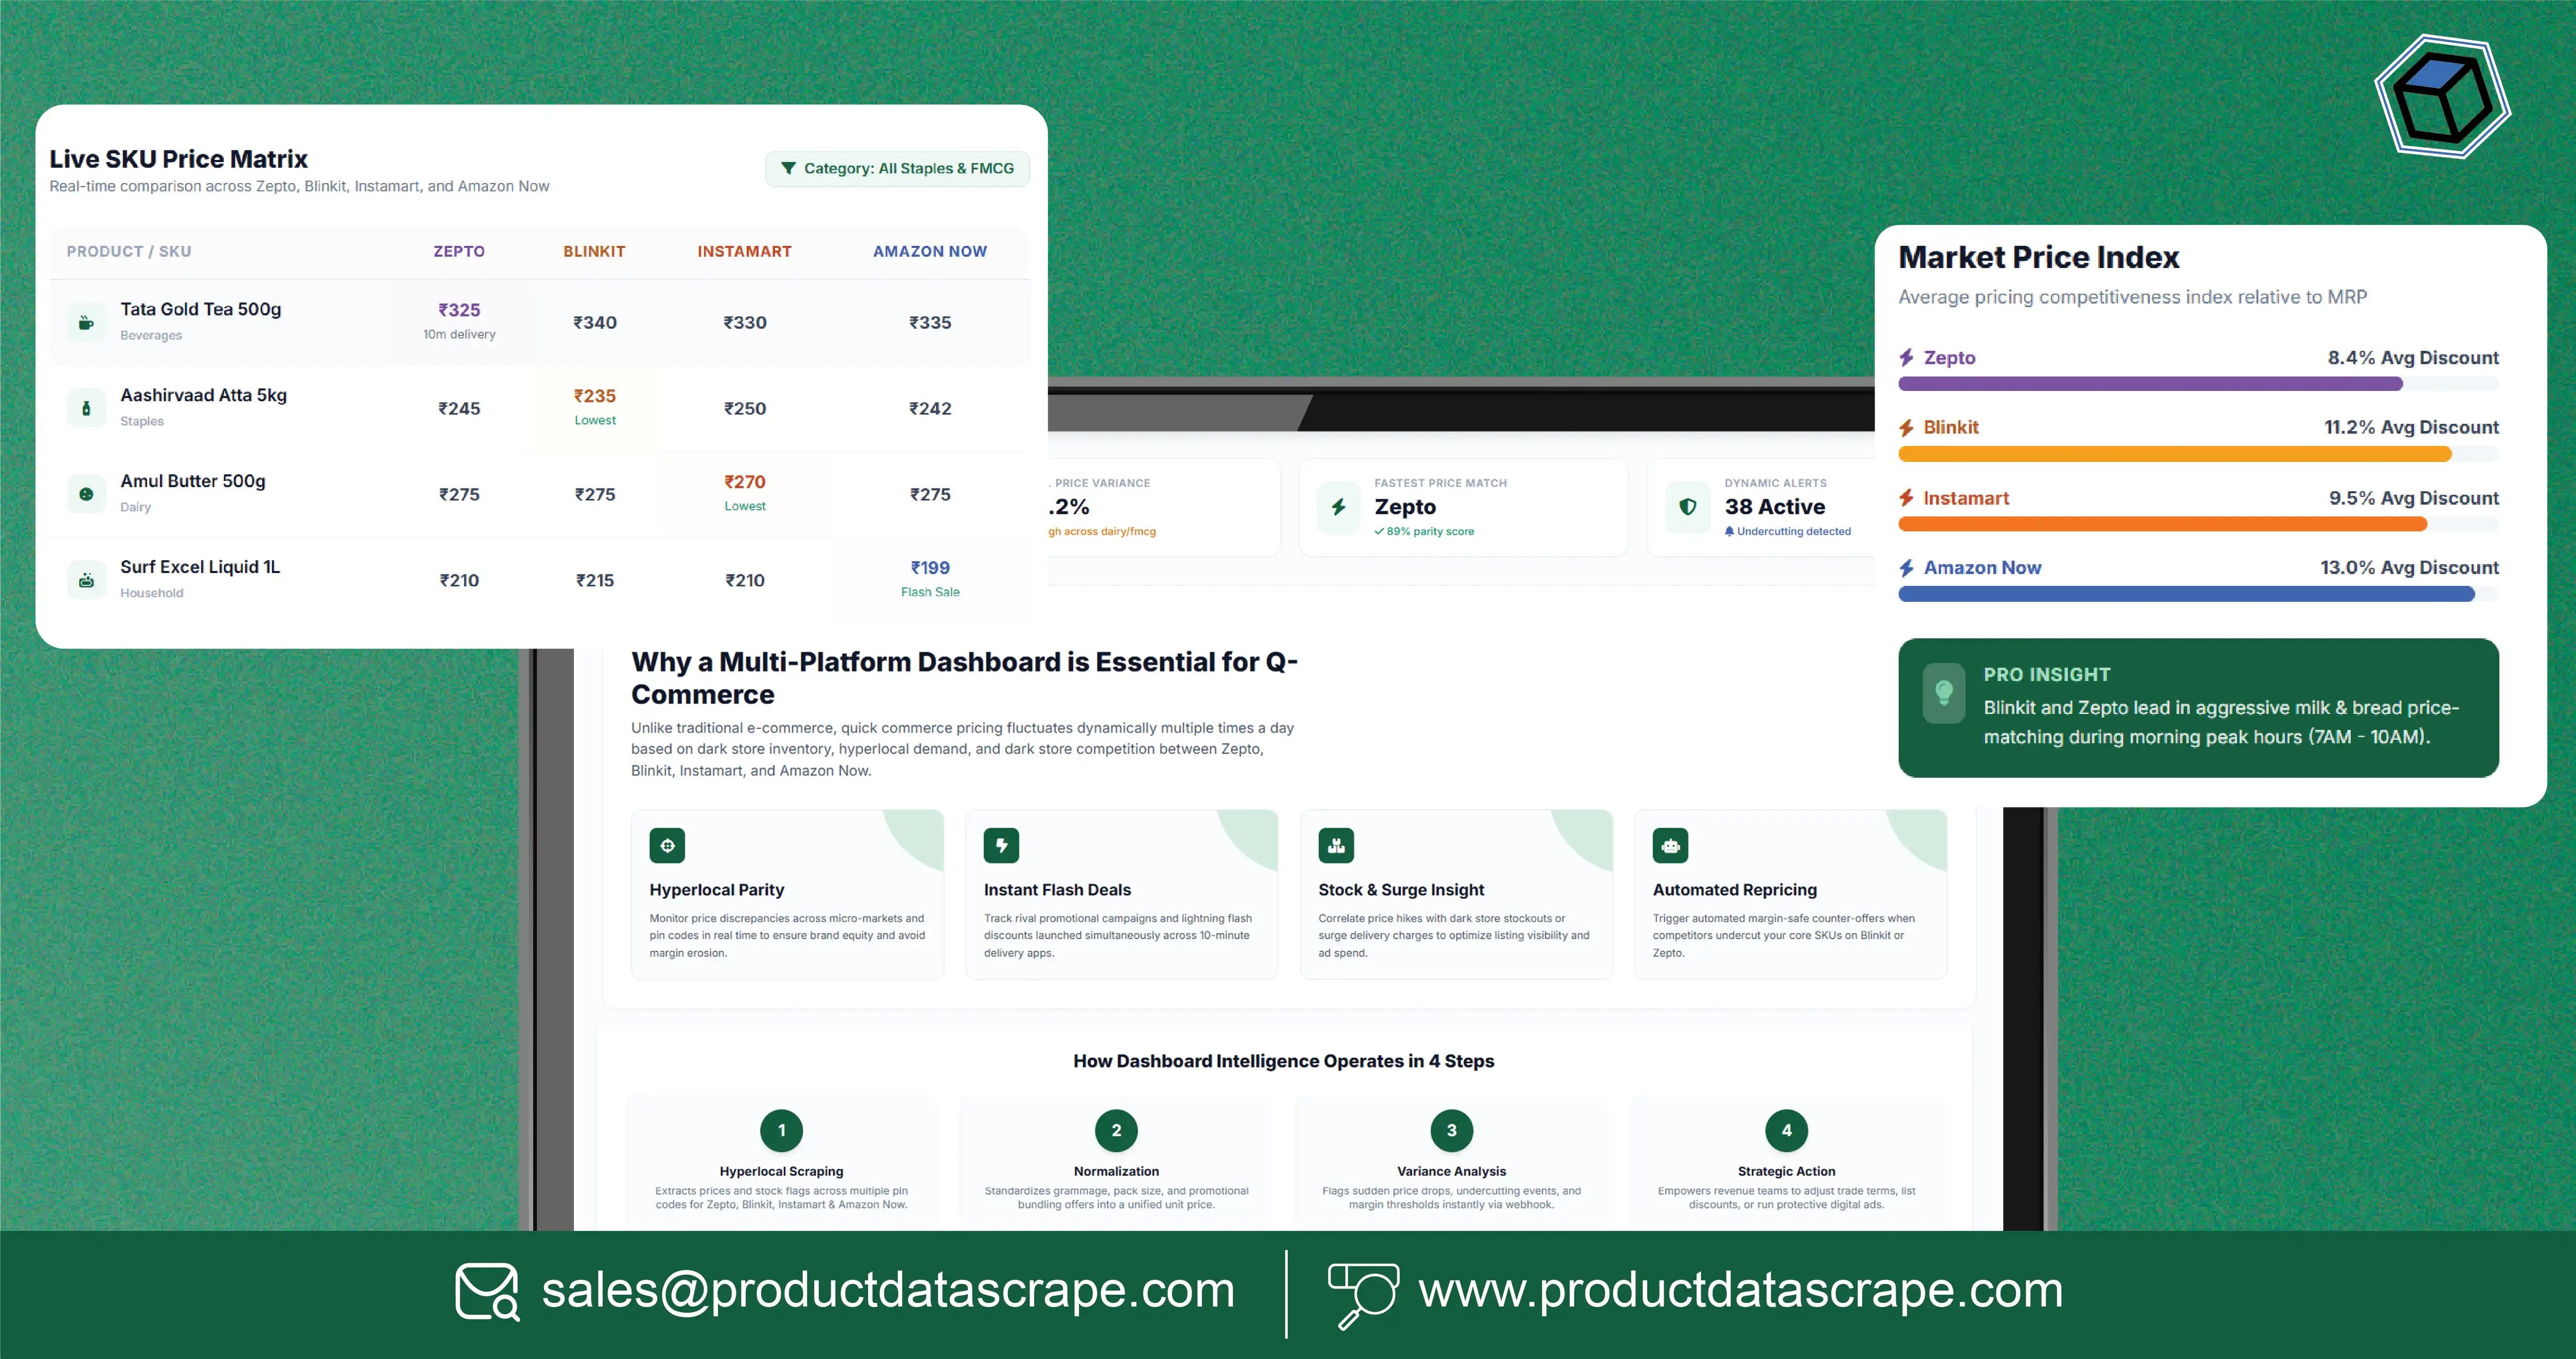
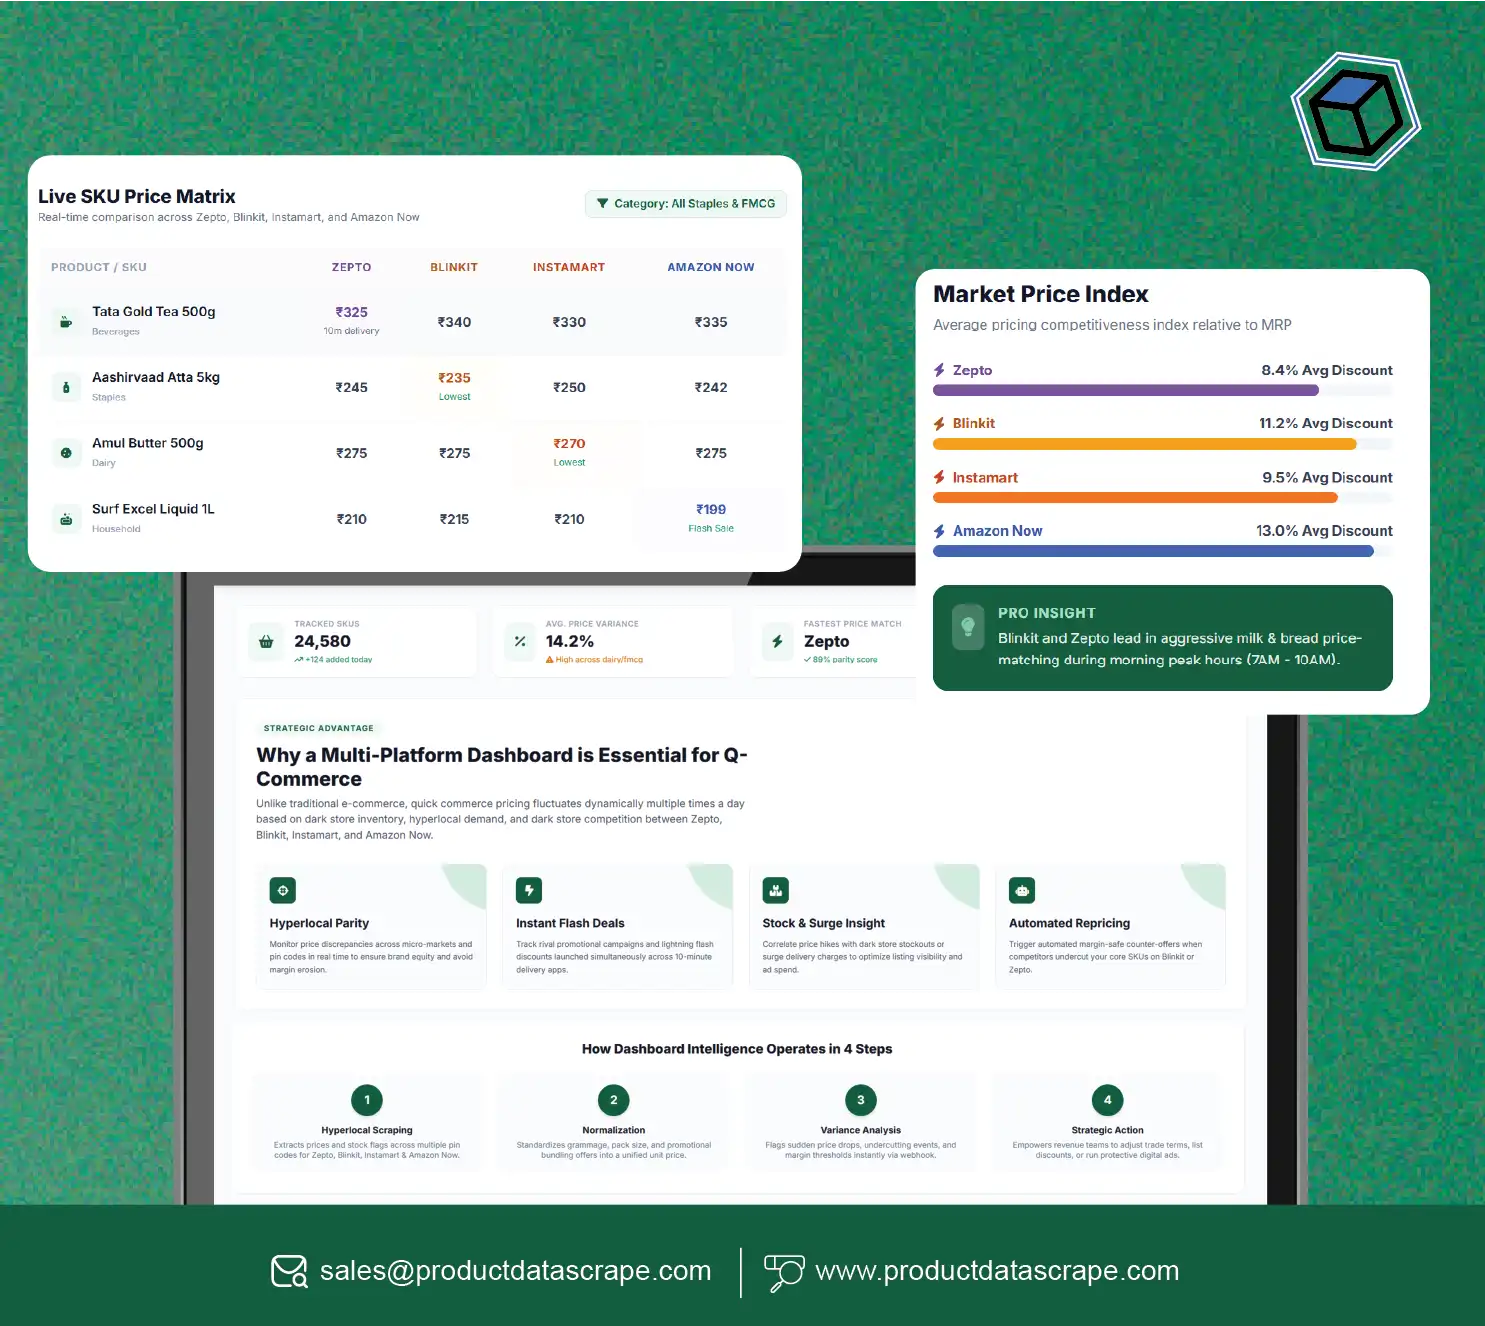
A multi-platform q-commerce pricing dashboard provides a centralized environment for collecting, normalizing, comparing, and visualizing product prices across multiple quick-commerce platforms. Instead of maintaining separate spreadsheets or manually opening applications, businesses can monitor SKU-level information through a structured interface.
The need for such systems has grown alongside the rapid expansion of the sector. Industry research estimates that India's quick-commerce market achieved a 71.2% CAGR during 2020–2024, while the market is projected to continue growing through 2029. In 2026, major quick-commerce platforms collectively crossed 9 million daily orders, highlighting the scale of price competition and consumer activity.
For businesses, this creates an important data challenge: the same product may have different prices, discounts, pack sizes, availability statuses, or promotional offers depending on platform and location. Multi-Platform SKU Price Monitoring addresses this challenge by organizing product-level observations into a consistent competitive intelligence framework.
Understanding the Changing Pricing Environment
Quick-commerce pricing is not static. A product that costs ₹199 in one location during the morning may be listed at another price later in the day or may have a different effective price after applying coupons, membership benefits, or platform promotions.
The expansion of dark-store networks has increased the complexity further. A July 2026 mapping study identified 5,625 publicly observable dark stores across five major platforms, covering 408 cities and 26 states. Meanwhile, industry reporting estimates that the five largest quick-commerce players operated around 6,500 dark stores by mid-2026.
| Indicator |
2020–2022 |
2023–2024 |
2025–2026 |
| Q-commerce adoption |
Emerging |
Rapid expansion |
Mainstream urban channel |
| Pricing activity |
Limited comparison |
Frequent promotions |
Continuous competitive monitoring |
| Primary assortment |
Grocery & essentials |
Grocery + FMCG |
FMCG + beauty + electronics + lifestyle |
| Monitoring approach |
Manual |
Semi-automated |
Automated dashboards |
| Competitive focus |
Availability |
Price + availability |
Price + SKU + promotion + location |
As the market has matured, businesses increasingly require structured data rather than isolated price observations. A dashboard can connect product identifiers, brands, categories, pack sizes, listed prices, discounts, stock status, seller information, timestamps, and locations.
This makes it possible to identify not only who is selling a product at the lowest listed price but also where pricing differences occur and how frequently those differences change.
Mapping Price Differences Across Major Delivery Platforms
Zepto price monitoring becomes particularly useful when brands want to understand how their products are positioned across fast-delivery marketplaces. A centralized multi-platform q-commerce pricing dashboard can collect comparable observations from Zepto alongside Blinkit, Instamart, and Amazon Now.
The objective is not simply to record the current price. A robust monitoring system can capture historical prices and connect them with SKU, location, timestamp, promotional status, and availability. This allows businesses to identify recurring pricing patterns.
For example, if a 1 kg packaged grocery item is listed at ₹210 on one platform, ₹215 on another, and ₹205 on a third, a historical dataset can reveal whether the difference is temporary or persistent. Businesses can then investigate whether discounts, local competition, inventory levels, or platform campaigns are contributing to the variation.
| Monitoring Metric |
Business Use |
| Listed price |
Compare advertised prices |
| Discount |
Measure promotional intensity |
| Effective price |
Understand customer-facing value |
| Stock status |
Identify availability gaps |
| Pack size |
Prevent incorrect SKU comparisons |
| Timestamp |
Track price movement |
| Location/pincode |
Detect geographic variation |
The importance of location-level monitoring is increasing as platforms expand outside major metropolitan areas. Bernstein reporting in July 2026 indicated that 75% of Blinkit's latest store additions were outside metro cities, while Zepto continued emphasizing dense urban clusters.
From 2020 to 2026, the shift has therefore been from broad market observation toward granular, location-specific intelligence. Brands can use this information to identify pricing gaps, monitor competitor promotions, and understand whether their recommended pricing is consistently reflected across quick-commerce channels.
Building a Structured Product Intelligence Pipeline
An Amazon Product Data Scraper can extend competitive monitoring beyond traditional quick-commerce specialists by capturing product information from Amazon's rapidly expanding Amazon Now operation where relevant data is accessible.
Amazon Now has become an increasingly important participant in India's quick-commerce environment. Recent reporting indicates that Amazon's quick-commerce business surpassed $1 billion in annualized gross sales and expanded to more than 60 cities, supported by more than 750 micro-fulfilment centers.
This development changes the competitive landscape because Amazon brings an extensive existing product ecosystem into rapid-delivery retail. Businesses therefore need a standardized data structure that allows Amazon-related observations to be compared with information collected from other platforms.
| Data Attribute |
Example Application |
| Product name |
Product identification |
| Brand |
Brand-level comparison |
| SKU/product ID |
Matching across datasets |
| MRP |
Reference pricing |
| Selling price |
Competitive analysis |
| Discount |
Promotion analysis |
| Availability |
Inventory intelligence |
| Delivery information |
Service-level comparison |
| Category |
Category benchmarking |
| Timestamp |
Historical analysis |
Between 2020 and 2026, product intelligence has increasingly moved toward automated collection and historical storage. Instead of asking, "What is the price today?", businesses can ask more useful questions such as: How often does the price change? Which platform discounts the product most frequently? Does the price vary by city? Are stock-outs associated with price increases?
Amazon Now's rapid expansion also reinforces the need for flexible data architectures. A monitoring system should be capable of adding new platforms, categories, locations, and SKUs without rebuilding the entire workflow.
The resulting dataset can support pricing teams, category managers, retailers, FMCG companies, distributors, and e-commerce analysts with a consistent view of market activity.
Turning Grocery Listings Into Comparable Market Data
A Blinkit grocery dataset can provide detailed information for brands and retailers seeking to understand grocery assortment, price positioning, and availability across quick-commerce markets.
The value of a dataset comes from its consistency. Simply collecting product names and prices is insufficient when different platforms use different naming conventions, pack sizes, promotional formats, and category structures. A strong data pipeline should normalize these attributes before comparison.
For instance, "Tata Salt 1 kg," "Tata Salt Iodised 1kg," and another differently formatted listing may represent the same underlying product. SKU matching and product normalization can reduce such duplication.
| Dataset Component |
Monitoring Objective |
| SKU |
Unique product identification |
| Product title |
Listing comparison |
| Brand |
Brand-level analysis |
| Category |
Category performance |
| Pack size |
Like-for-like comparison |
| MRP |
Reference benchmark |
| Current price |
Competitive pricing |
| Discount |
Promotion tracking |
| Availability |
Stock monitoring |
| Location |
Geographic intelligence |
The 2020–2026 period has also witnessed a major expansion in quick-commerce assortment. Industry reporting in 2026 notes that platforms are increasingly moving beyond traditional grocery and daily essentials into electronics, beauty, watches, home décor, and other discretionary categories.
This means that grocery monitoring can serve as the foundation for broader digital shelf intelligence.
Historical records are particularly valuable. A single day's data provides a snapshot, whereas six months or several years of structured observations can reveal recurring promotional cycles, seasonal pricing, stock-out patterns, and changes in assortment.
For FMCG brands, this information can support category reviews and help teams investigate whether competitive price changes are isolated events or part of a broader market movement.
Measuring Competitive Movements Across the Market
Scrape Quick Commerce Price Battle strategies become more effective when businesses treat pricing as a continuous market signal rather than a one-time observation.
Quick-commerce competition is increasingly intense. In 2026, major players were expanding their networks while also competing for existing demand in established markets. Bernstein estimated that the five largest platforms together had about 6,500 dark stores by mid-2026 and suggested that future growth would increasingly depend on order frequency, basket size, and assortment rather than geographic expansion alone.
A structured pricing dataset allows businesses to analyze this competitive activity at SKU level.
| Competitive Signal |
What It Can Reveal |
| Price reduction |
Promotional activity |
| Repeated discounts |
Strategic pricing pattern |
| Price increase |
Margin or supply movement |
| Stock-out |
Inventory pressure |
| New SKU listing |
Assortment expansion |
| Competitor undercutting |
Price-positioning change |
| Regional price gap |
Geographic strategy |
| Promotion frequency |
Campaign intensity |
From 2020 to 2026, the competitive environment evolved from simple discount-led customer acquisition toward increasingly data-driven category management. Businesses now need to understand the relationship between price, availability, assortment, and consumer convenience.
For example, if three platforms simultaneously reduce the price of a popular product, a brand may want to determine whether the change is market-wide or limited to a particular retailer. Historical monitoring makes that distinction possible.
A competitive dashboard can also identify products where price volatility is unusually high. Such products may require more frequent monitoring than stable SKUs.
The goal is not simply to identify the cheapest platform. Instead, businesses can build a more comprehensive picture of market behavior and use those observations alongside internal sales, inventory, and promotional data.
Creating Faster Visibility Into Daily Market Changes
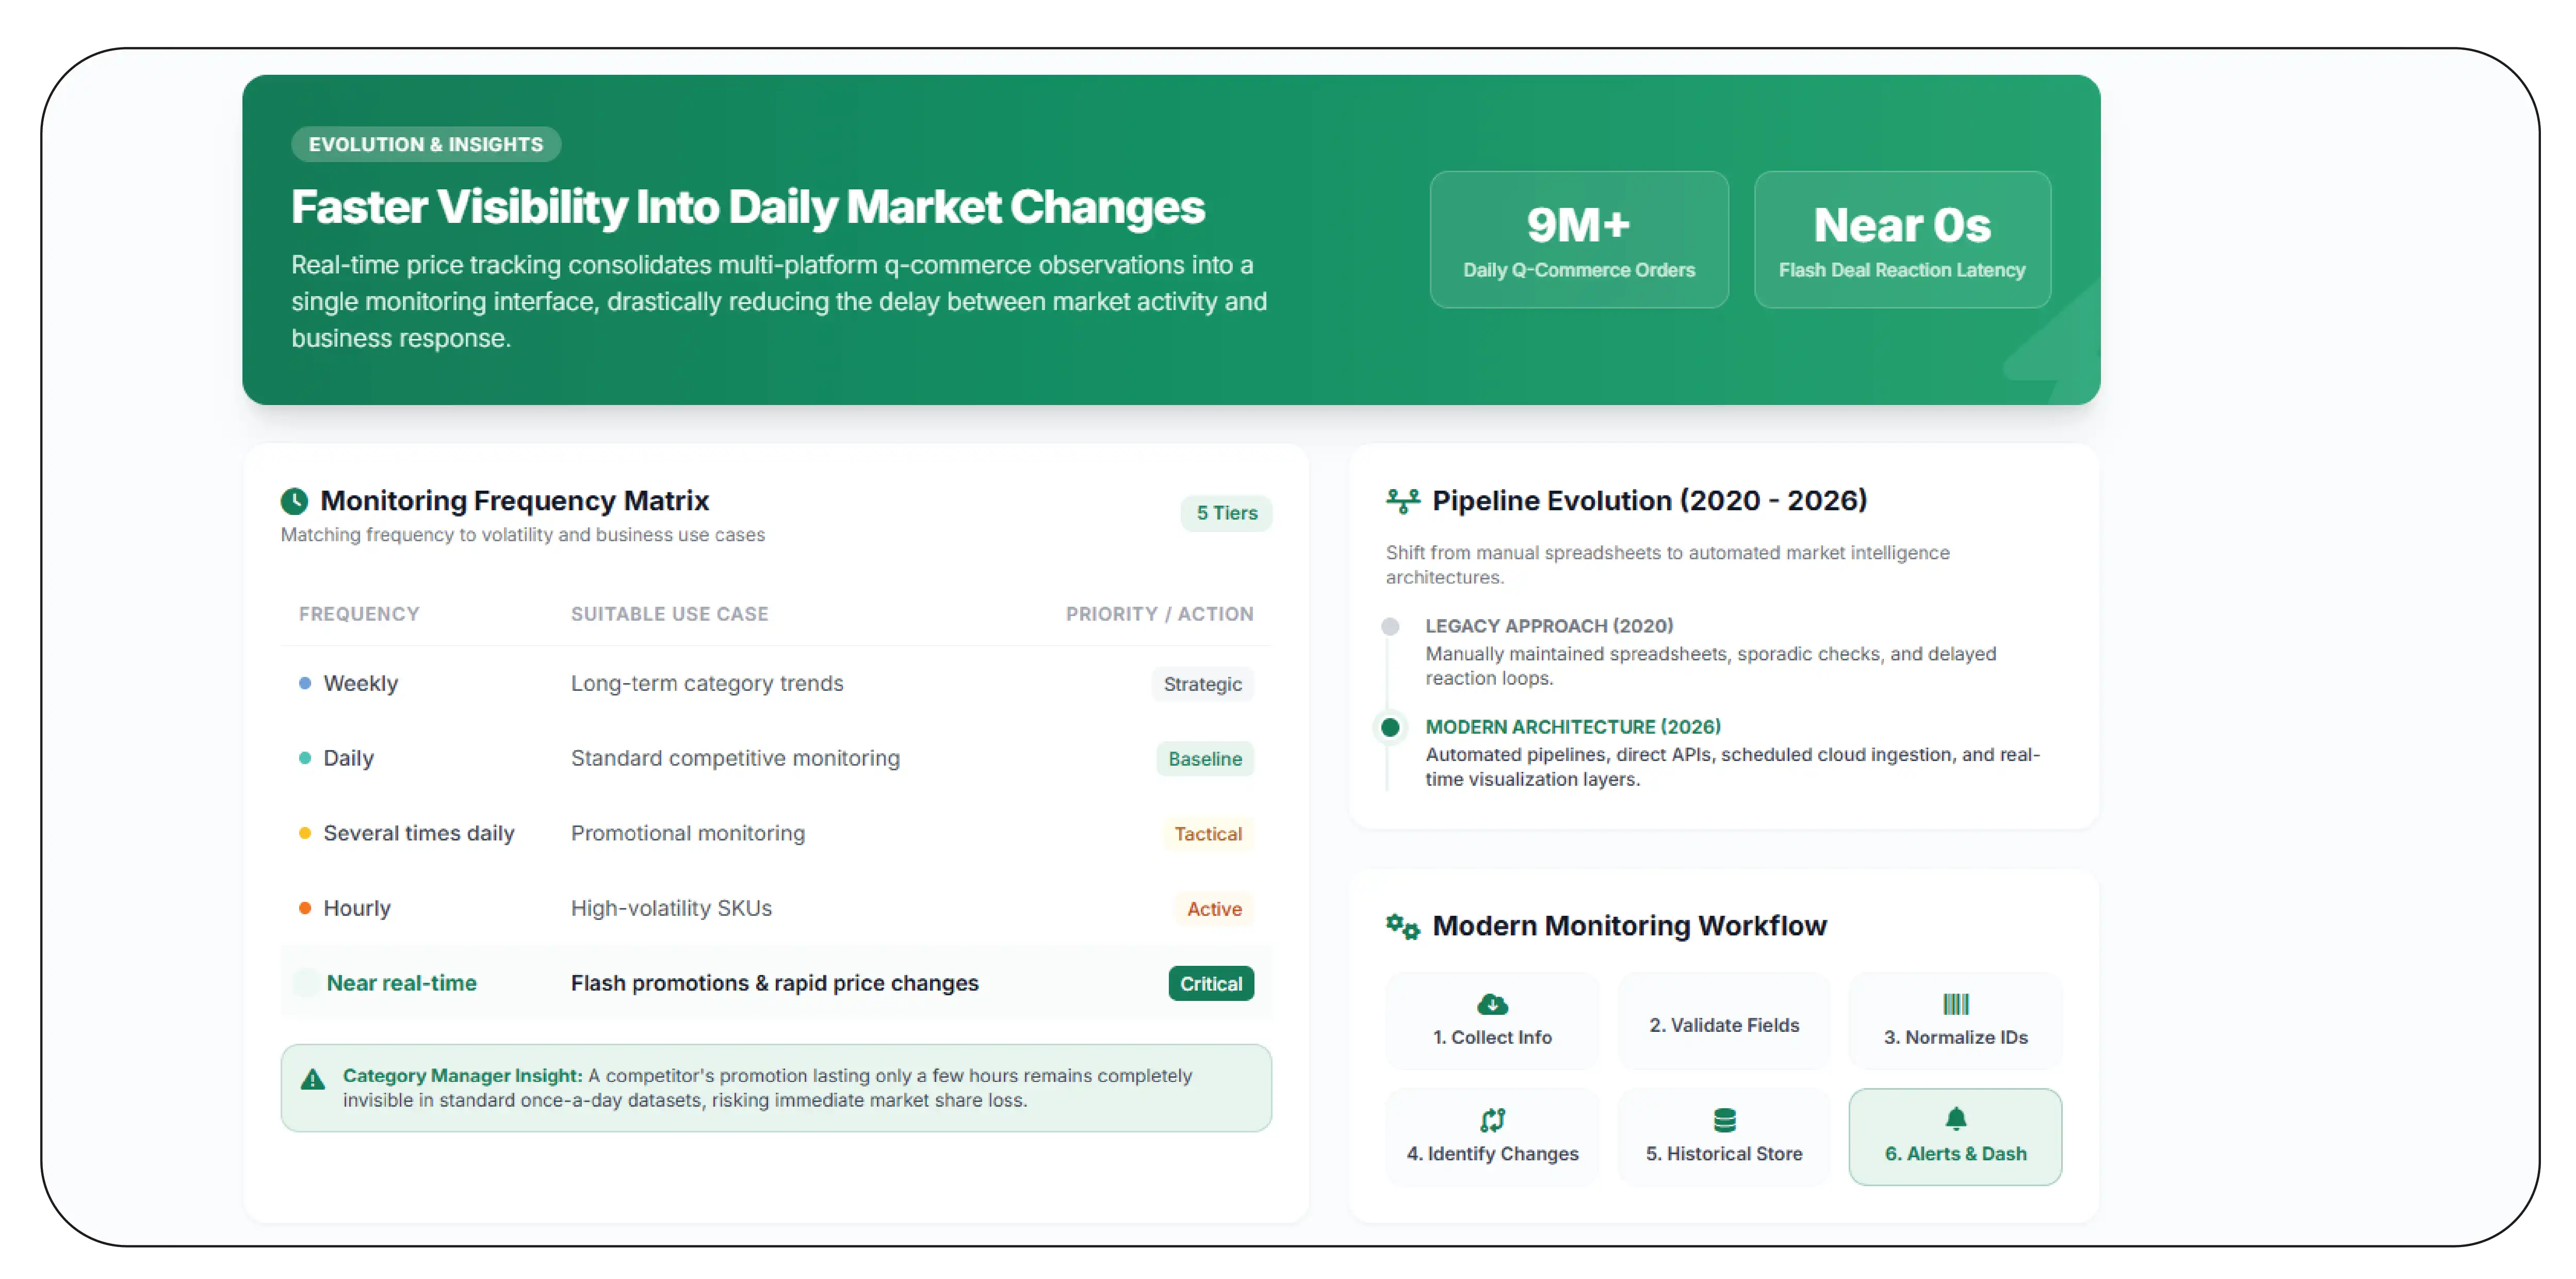
Real-time price tracking becomes increasingly important when product prices and promotions can change several times during a trading day. A multi-platform q-commerce pricing dashboard can consolidate these observations into a single monitoring interface and reduce the delay between market activity and business response.
For category managers, the difference between daily and near-real-time monitoring can be significant. A competitor's promotion that lasts only a few hours may be invisible in a once-a-day dataset.
| Monitoring Frequency |
Suitable Use Case |
| Weekly |
Long-term category trends |
| Daily |
Standard competitive monitoring |
| Several times daily |
Promotional monitoring |
| Hourly |
High-volatility SKUs |
| Near real-time |
Flash promotions and rapid price changes |
The market's increasing scale makes automation more important. India's quick-commerce sector reportedly crossed 9 million daily orders in 2026, illustrating how frequently product transactions and market signals can occur.
Between 2020 and 2026, businesses have increasingly moved from manually maintained spreadsheets toward automated pipelines, APIs where available, scheduled collection, cloud databases, and visualization layers. The same evolution is visible in pricing intelligence.
A modern monitoring workflow can collect information, validate fields, normalize product identities, identify changes, store historical records, and present alerts or dashboards to business users.
This approach also supports exception-based analysis. Instead of asking analysts to inspect thousands of products, the system can highlight SKUs where prices have changed beyond a predefined threshold, competitors have introduced discounts, or availability has disappeared.
The result is faster visibility without requiring teams to manually inspect every platform and every SKU.
Connecting Competitive Data With Business Decisions
Product Data Scrape can support organizations that need structured, recurring product and pricing intelligence across India's rapidly changing digital commerce ecosystem.
The most valuable output is not simply a collection of product pages. It is an analytics-ready dataset that can be integrated with business intelligence tools, internal databases, pricing systems, and reporting workflows.
A scalable solution can combine multiple dimensions:
- Product and SKU information
- Brand and category classification
- Current and historical prices
- MRP and discount information
- Stock and availability
- Platform and location
- Product URLs
- Collection timestamps
- Promotion indicators
- Competitive price differences
| 2020–2026 Evolution |
Business Impact |
| Manual checks |
Limited coverage |
| Spreadsheet tracking |
Better organization |
| Automated collection |
Larger SKU coverage |
| Historical databases |
Trend analysis |
| Dashboards |
Faster decision-making |
| Automated alerts |
Exception-based monitoring |
The broader shift in 2026 is toward increasingly sophisticated retail intelligence. India's e-commerce market is projected to reach approximately $345 billion by 2030, while quick commerce is projected to reach $65–70 billion and contribute a substantial share of incremental e-retail GMV.
For brands operating in this environment, competitive pricing information can become more useful when connected to internal sales, inventory, promotions, and assortment information.
A well-designed data architecture therefore needs to be scalable. As new platforms enter the market or existing platforms expand their categories, the monitoring framework should accommodate additional sources without disrupting historical datasets.
This creates a foundation for recurring competitive intelligence rather than isolated research exercises.
Why Choose Product Data Scrape?
Businesses need more than raw product information when monitoring fast-moving digital commerce channels. A specialized data partner can help convert platform-level information into structured datasets suitable for analysis and reporting.
A scalable solution can support automated collection, product matching, historical price storage, data validation, location-level monitoring, and recurring delivery. It can also help organize information across multiple platforms so teams can compare equivalent SKUs instead of manually reconciling thousands of listings.
With multi-platform q-commerce pricing dashboard capabilities, businesses can bring pricing, availability, discounts, assortment, and competitive movements into a centralized view.
The emphasis should be on data quality, consistency, scalability, and business usability. Structured datasets allow analysts and category teams to spend less time gathering information and more time interpreting market changes.
Conclusion
India's quick-commerce market has developed rapidly between 2020 and 2026, creating a highly dynamic environment for brands, retailers, sellers, and category managers. As Zepto, Blinkit, Instamart, and Amazon Now expand their presence, product prices and promotions can vary by platform, location, SKU, and time.
A multi-platform q-commerce pricing dashboard brings these fragmented observations together, helping businesses monitor prices, availability, discounts, assortment, and competitive movements from a centralized environment. Historical data also enables teams to identify recurring patterns rather than relying on isolated snapshots.
Product Data Scrape can help businesses build structured, scalable datasets designed for recurring competitive intelligence, analytics, and reporting.
Connect with Product Data Scrape to build a customized quick-commerce pricing intelligence solution for your SKUs, platforms, categories, and target markets!
FAQs
1. What is a quick-commerce pricing dashboard?
A quick-commerce pricing dashboard centralizes product prices, discounts, availability, SKUs, locations, and timestamps from multiple platforms for easier competitive monitoring, comparison, reporting, and historical analysis.
2. Why is multi-platform q-commerce pricing dashboard data useful?
It helps businesses compare equivalent products across platforms, identify price differences, monitor promotions, detect stock changes, and analyze competitive movements without relying on repeated manual checks.
3. What information can be collected from quick-commerce platforms?
Depending on accessibility, datasets can include product names, SKUs, brands, categories, pack sizes, MRP, selling prices, discounts, availability, locations, URLs, and collection timestamps.
4. How frequently should quick-commerce prices be monitored?
Monitoring frequency depends on SKU volatility and business requirements. Daily tracking works for broad intelligence, while hourly or more frequent collection can support promotional and high-volatility products.
5. Can the data support historical pricing analysis?
Yes. When price observations are collected consistently and stored with timestamps, businesses can analyze historical changes, promotional patterns, regional differences, competitor movements, and SKU-level pricing trends.


 Singapore
 EMAIL
EMAIL
 PHONE
PHONE















.webp)






