Introduction
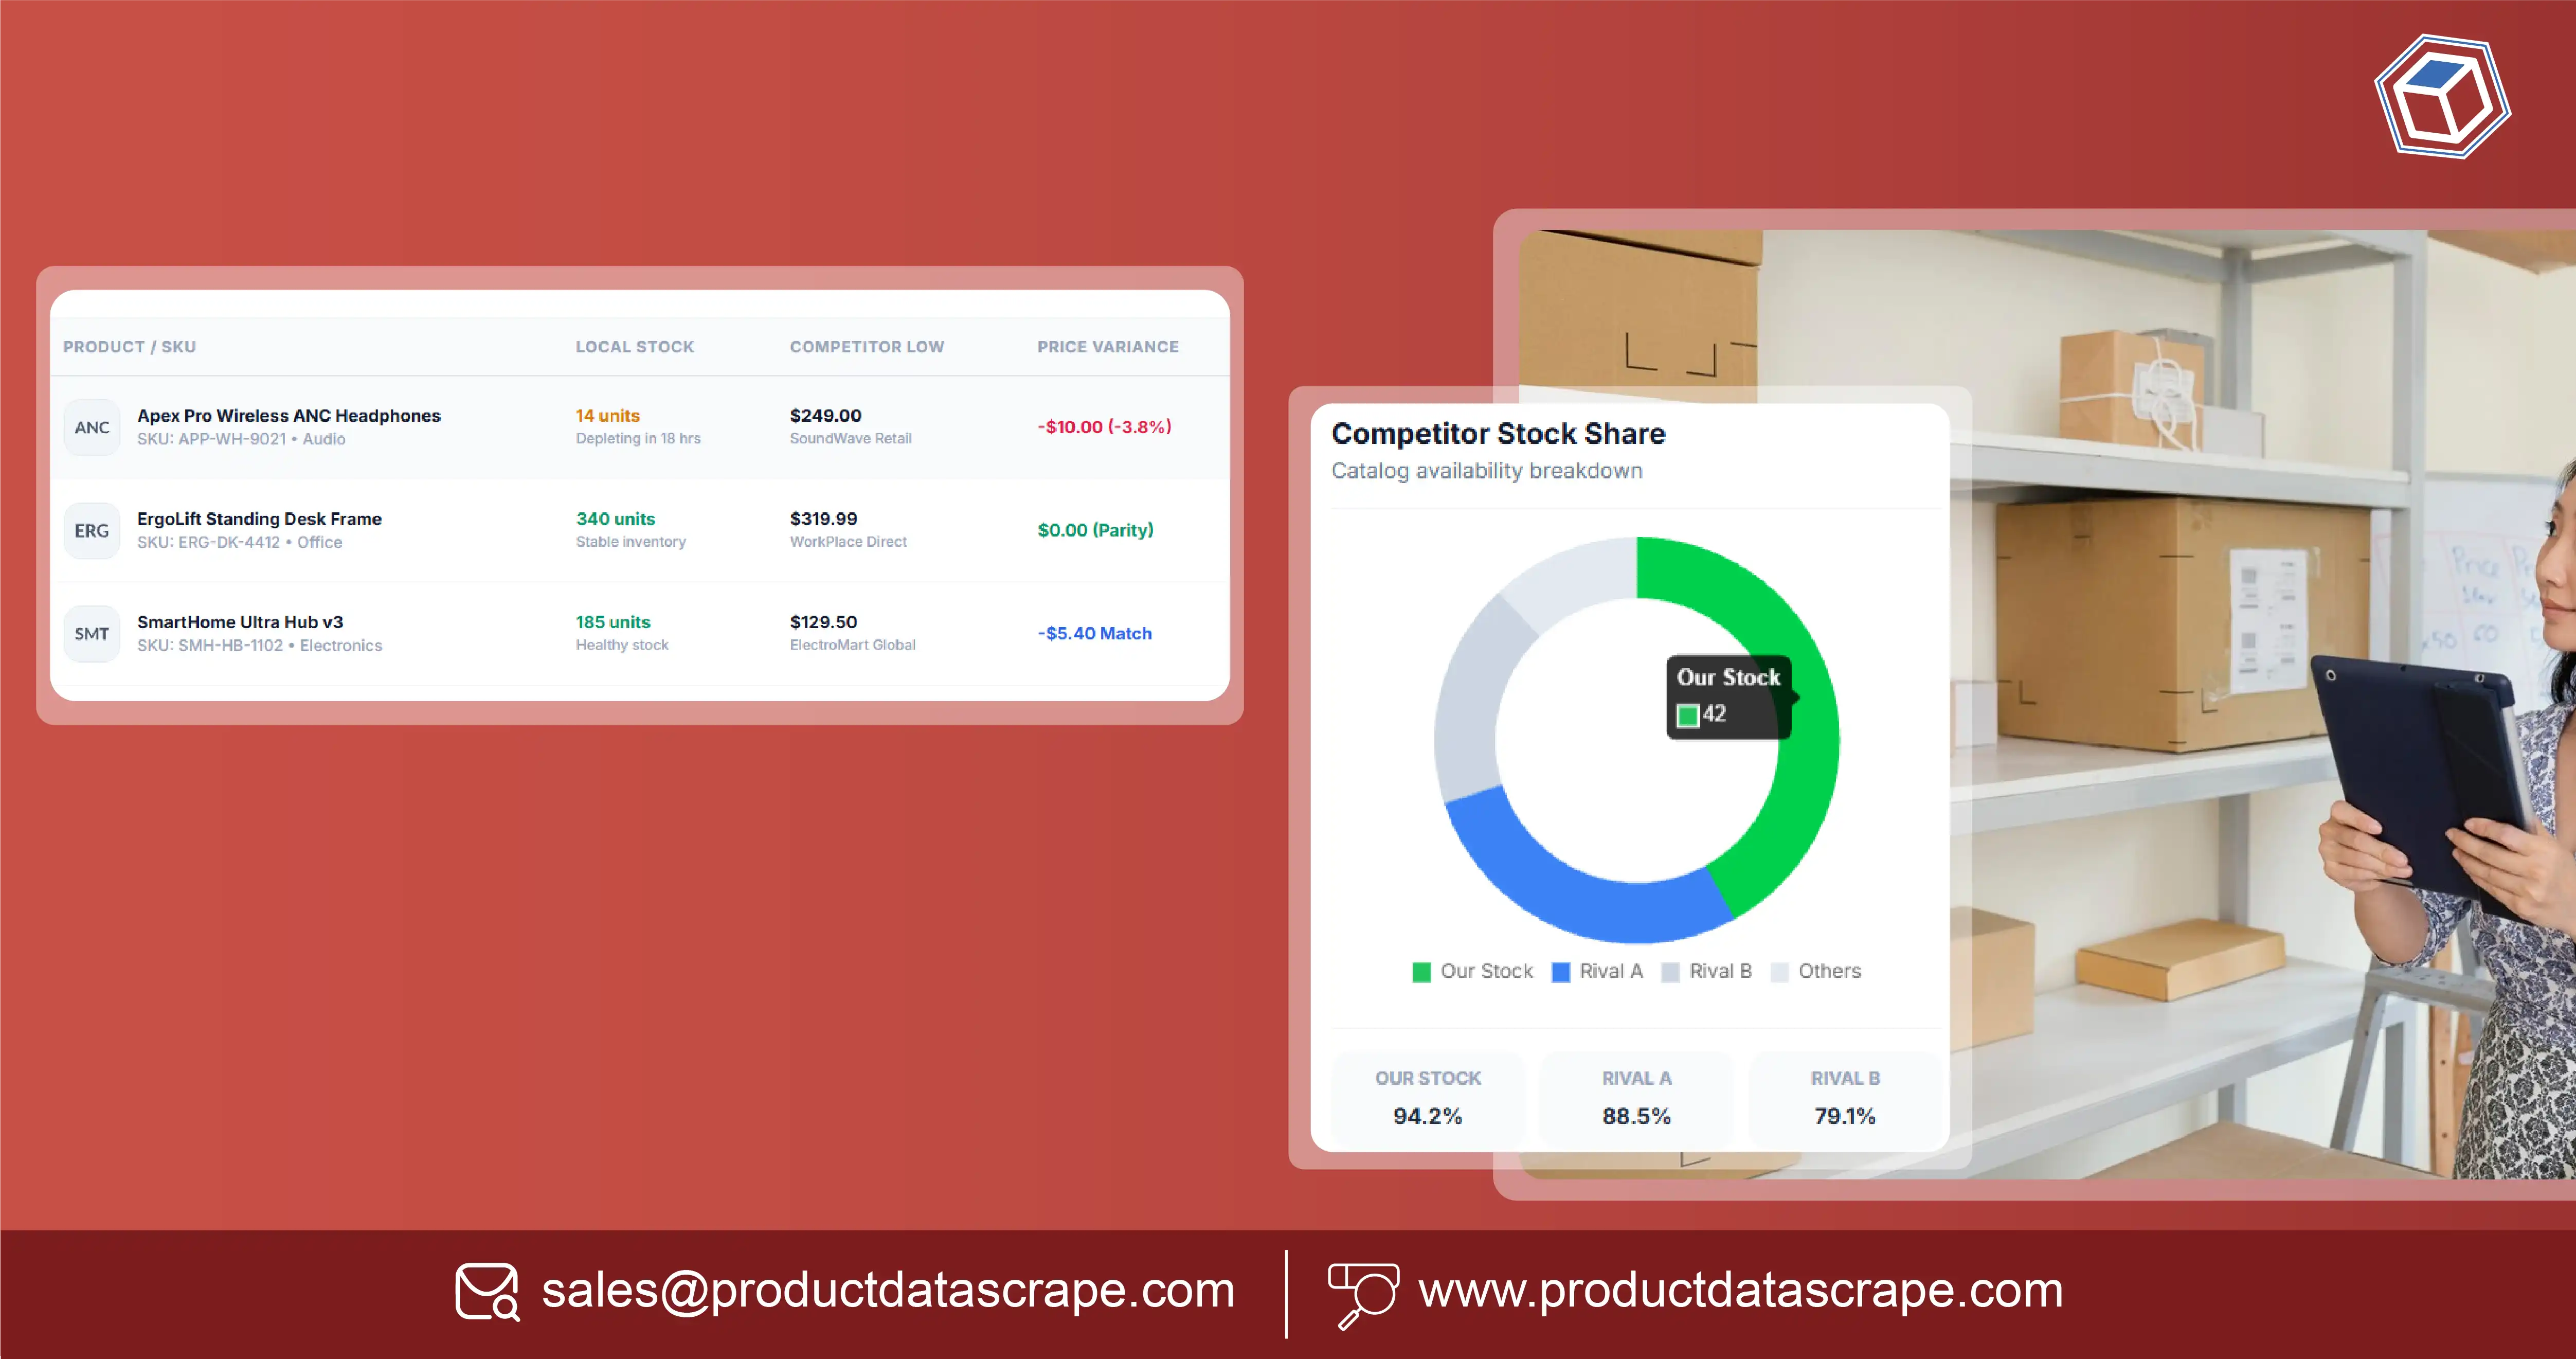
Retailers Use Scraped Data to Beat Stockouts by monitoring online product availability, competitor listings, pricing, and changing inventory signals. This gives retailers earlier visibility into potential shortages, helping inventory teams prioritize replenishment and reduce lost sales caused by unavailable products.
Stockouts create a direct disconnect between customer demand and product availability. When shoppers cannot find the product they want, they may switch brands, purchase from a competitor, or abandon the purchase entirely. For retailers managing thousands of SKUs across multiple channels, manually checking availability is difficult to scale.
Automated data collection can continuously capture product availability, listing status, seller information, prices, promotional activity, and other publicly available signals. When these records are stored historically, retailers can distinguish temporary availability changes from recurring stockout patterns.
Geo-Level Retail Price Scraping can further strengthen this analysis by showing how product pricing and availability differ across locations. A product may remain available in one market while becoming unavailable in another, creating regional opportunities or supply issues that national-level reporting can overlook.
The core value is actionable visibility. Inventory managers can identify products experiencing repeated shortages, category managers can monitor competitive availability, and pricing teams can understand whether stockouts are creating opportunities for competing retailers.
For ecommerce leaders, the goal is not simply to collect more data. It is to turn changing online availability signals into earlier inventory decisions, stronger demand planning, and better protection against lost sales.
How Can Retailers Identify Stockout Patterns Before They Become Costly?
Retail Stockout Monitoring helps retailers continuously observe product availability across ecommerce websites, marketplaces, and digital retail channels. Instead of checking individual listings manually, teams can create a structured monitoring process that records whether products are available, unavailable, discontinued, or otherwise restricted at the time of collection.
Stockout Monitoring becomes more effective when availability is captured repeatedly. A single out-of-stock observation may represent a temporary inventory issue. Repeated observations over several days or weeks provide stronger evidence of a persistent problem.
Retailers can track product identifiers, SKUs, availability status, product URLs, sellers, prices, promotional status, timestamps, and location information where publicly available. These fields can then be connected with internal inventory and sales data.
A useful approach is to establish thresholds. Products that remain unavailable for several consecutive monitoring cycles can receive a higher replenishment priority. Products that frequently alternate between available and unavailable can be flagged for supply instability analysis.
Stockout Monitoring Development
| Year |
Products Tracked |
Monitoring Frequency |
Availability Signals |
| 2020 |
10,000 |
Monthly |
2 |
| 2021 |
25,000 |
Monthly |
3 |
| 2022 |
50,000 |
Biweekly |
5 |
| 2023 |
100,000 |
Weekly |
7 |
| 2024 |
250,000 |
Daily |
10 |
| 2025 |
500,000 |
Daily |
13 |
| 2026 |
1M+ |
Near real time |
16+ |
These figures are operational planning targets, not industry statistics.
Historical monitoring also allows teams to identify recurring seasonal patterns. A product may experience shortages every year during a particular period, while another may become unavailable only after a competitor launches a promotion.
Retailers should prioritize monitoring based on product importance. High-revenue SKUs, fast-moving products, strategic brands, seasonal products, and products with limited substitutes deserve more frequent checks.
The resulting dataset can feed inventory dashboards and alerting workflows. Instead of discovering a stockout after a sales decline, teams can receive structured signals showing which products have changed availability and how long the issue has persisted.
This creates an earlier decision point for replenishment, supplier communication, and assortment management.
How Does Product-Level Availability Tracking Improve Replenishment?
Product Stock Level Monitoring provides product-level visibility into availability changes across digital channels. Although public websites may not always expose exact inventory quantities, they can reveal useful availability indicators such as "in stock," "out of stock," limited availability, unavailable delivery options, or changes in purchasability.
These signals can complement internal inventory systems. For example, if a retailer's own product becomes unavailable while competitors continue offering the same SKU, the business may be losing demand to competing channels.
Monitoring product-level changes also helps identify products that repeatedly disappear from online listings. Such patterns may indicate supply constraints, catalog changes, fulfillment issues, or high demand.
Retailers should capture the timestamp for every observation. Without historical timestamps, it is difficult to determine whether a product was unavailable for several hours, several days, or repeatedly across multiple periods.
Product Availability Tracking
| Year |
SKUs Monitored |
Availability Checks |
Historical Window |
| 2020 |
10K |
Monthly |
30 days |
| 2021 |
25K |
Monthly |
60 days |
| 2022 |
50K |
Biweekly |
90 days |
| 2023 |
100K |
Weekly |
180 days |
| 2024 |
250K |
Daily |
12 months |
| 2025 |
500K |
Daily |
18 months |
| 2026 |
1M+ |
Near real time |
24 months |
These are data-maturity and monitoring targets.
Product-level monitoring becomes particularly useful when connected to product attributes. Retailers can analyze whether stockouts are concentrated by brand, category, price tier, pack size, color, size, or geographic market.
For example, repeated shortages of one size or color may indicate a variant-specific demand issue rather than a broader product shortage. This distinction can improve replenishment accuracy.
Teams can also compare availability against sales velocity. A high-selling product that repeatedly becomes unavailable should generally receive greater attention than a low-demand product with an isolated availability interruption.
By creating a historical availability layer, retailers can make inventory decisions using patterns rather than individual observations.
How Can Retailers Compare Their Availability With Competitors?
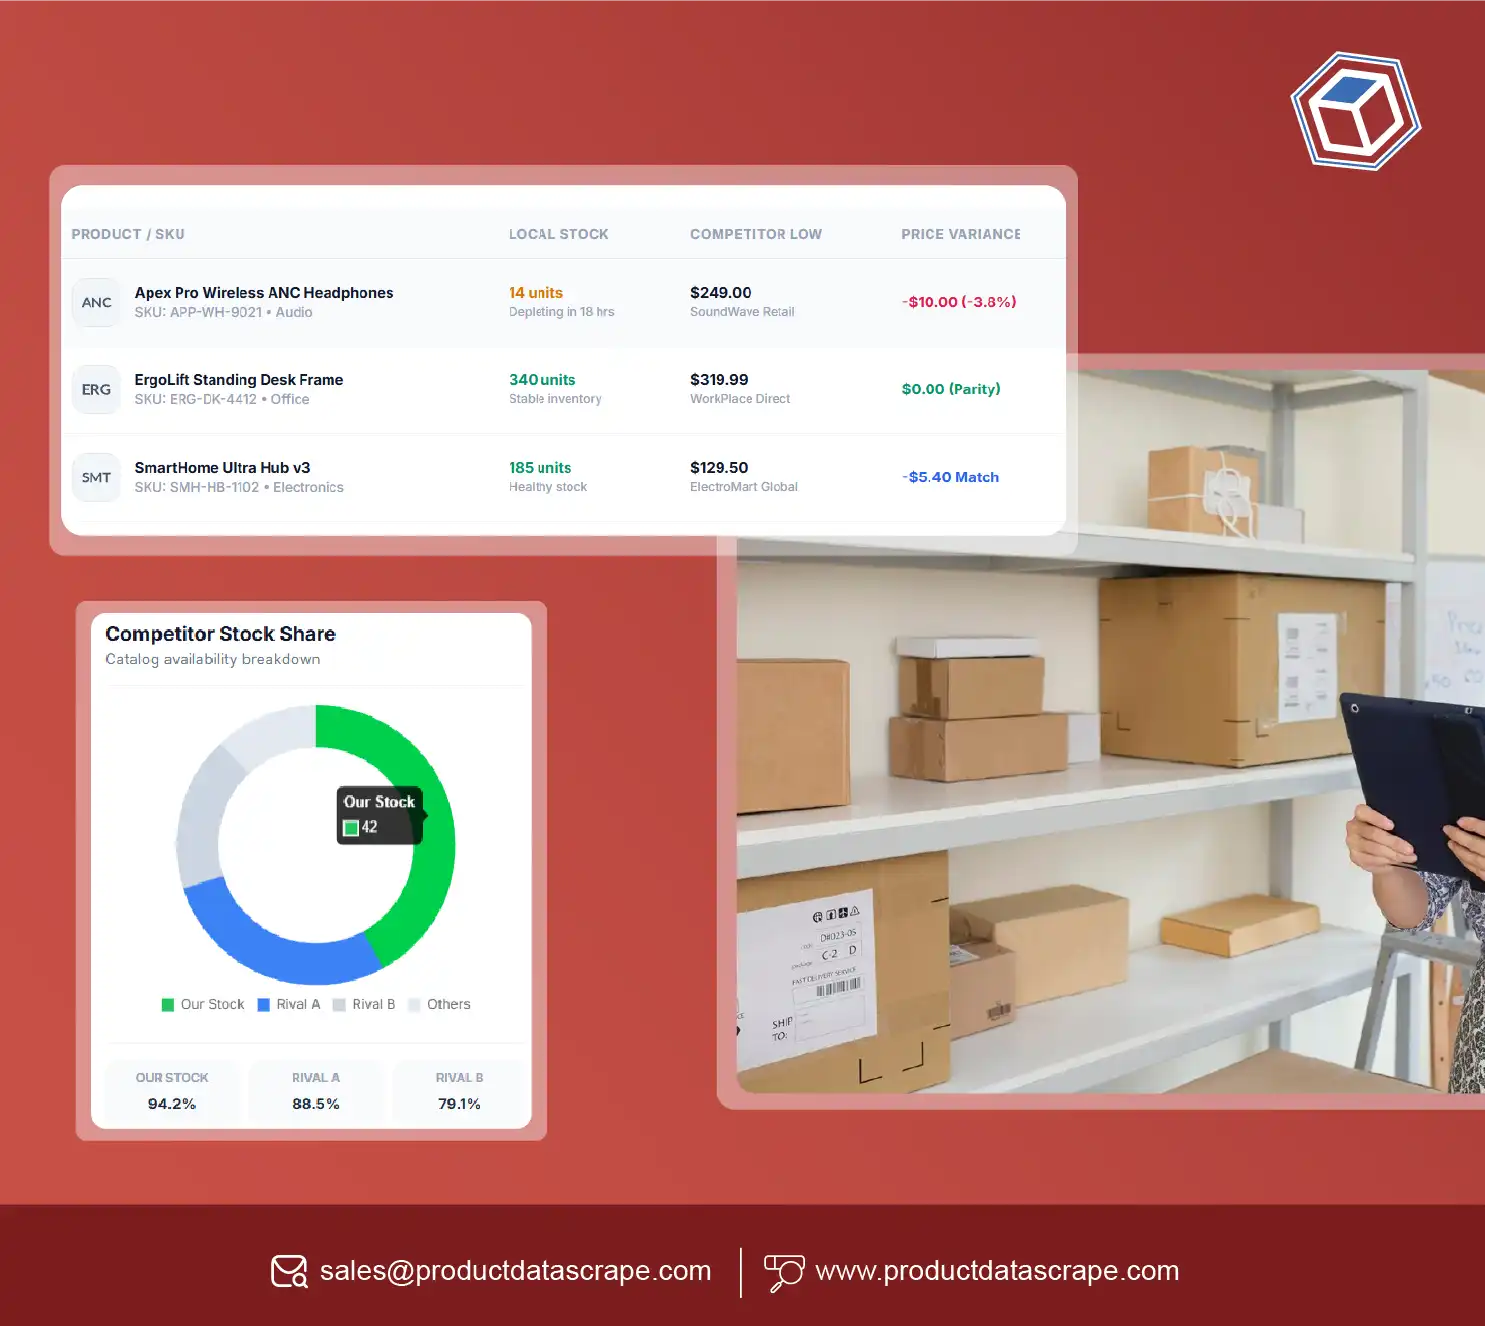
Stock Availability Competitive Benchmarking helps retailers determine whether their products are available when competing retailers or marketplaces have comparable products in stock. This comparison is valuable because a retailer's stockout becomes more commercially significant when customers can immediately purchase the same product elsewhere.
Product Detail Scraped Data can provide the broader context required for this comparison. Product title, SKU, brand, category, price, seller, availability, ratings, reviews, variants, and other available attributes can help determine whether competitor listings represent genuine substitutes.
Product matching is critical. Retailers should avoid comparing unrelated products simply because their titles are similar. Brand, model number, product identifier, specifications, pack size, and variant information can improve matching accuracy.
Competitive availability should also be monitored historically. A competitor having a product in stock once does not necessarily represent a persistent advantage. Repeated availability across monitoring periods provides stronger evidence.
Competitive Availability Benchmark
| Year |
Competitors Tracked |
Products Compared |
Comparison Frequency |
| 2020 |
2 |
10K |
Monthly |
| 2021 |
3 |
25K |
Monthly |
| 2022 |
4 |
50K |
Biweekly |
| 2023 |
5 |
100K |
Weekly |
| 2024 |
6 |
250K |
Daily |
| 2025 |
8 |
500K |
Daily |
| 2026 |
10+ |
1M+ |
Near real time |
These figures are monitoring-program targets.
Competitive availability data can reveal several scenarios. A product may be unavailable across every competitor, suggesting broader supply pressure. It may be unavailable only at the retailer, suggesting a potential replenishment or inventory allocation problem. Or it may be available at competitors but missing from the retailer's assortment altogether.
These distinctions matter.
Inventory managers can prioritize replenishment when competitors remain stocked. Category teams can investigate assortment gaps when the retailer does not carry the product. Pricing teams can assess whether competitor availability creates an opportunity to capture demand.
Availability benchmarking therefore turns stockout monitoring into competitive intelligence.
How Can Digital Shelf Availability Reveal Revenue Risks?
Retail Shelf Availability Analytics extends traditional inventory analysis into the digital shopping environment. Physical shelf availability is difficult to observe continuously, but online listings can provide customer-facing signals about whether products can currently be purchased.
Digital availability can be affected by inventory, fulfillment capacity, geographic restrictions, seller status, marketplace rules, or delivery coverage. For this reason, retailers should treat online availability as a customer-facing availability indicator rather than automatically equating it with exact warehouse inventory.
Analytics can classify products according to availability duration and frequency. A continuously available SKU has a different risk profile from a product that repeatedly becomes unavailable for short periods.
The analysis can also be segmented by geography and channel. One region may experience availability problems while another continues to serve customers normally. A marketplace seller may remain active while the first-party listing disappears.
Digital Availability Analytics
| Year |
Listings Analyzed |
Geographic Coverage |
Reporting Frequency |
| 2020 |
15K |
2 regions |
Monthly |
| 2021 |
30K |
3 regions |
Monthly |
| 2022 |
60K |
5 regions |
Biweekly |
| 2023 |
125K |
8 regions |
Weekly |
| 2024 |
300K |
12 regions |
Daily |
| 2025 |
650K |
20 regions |
Daily |
| 2026 |
1.2M+ |
25+ regions |
Near real time |
These are operational coverage targets.
Retailers can build metrics such as availability rate, stockout frequency, consecutive unavailable days, competitor availability rate, and regional availability differences.
These metrics help identify where digital shelf performance may be weaker than expected. They also provide category teams with evidence for investigating supply problems.
When combined with internal sales data, digital shelf analytics becomes even more valuable. Teams can determine whether availability interruptions correlate with declining sales, increased competitor visibility, or changes in customer demand.
The objective is to create an early-warning system that identifies customer-facing availability risks before they become larger commercial problems.
How Can Retailers Connect Demand Signals With Inventory Decisions?
Retail Demand & Inventory Intelligence combines availability information with demand-related signals to help retailers understand which stockouts require the fastest response.
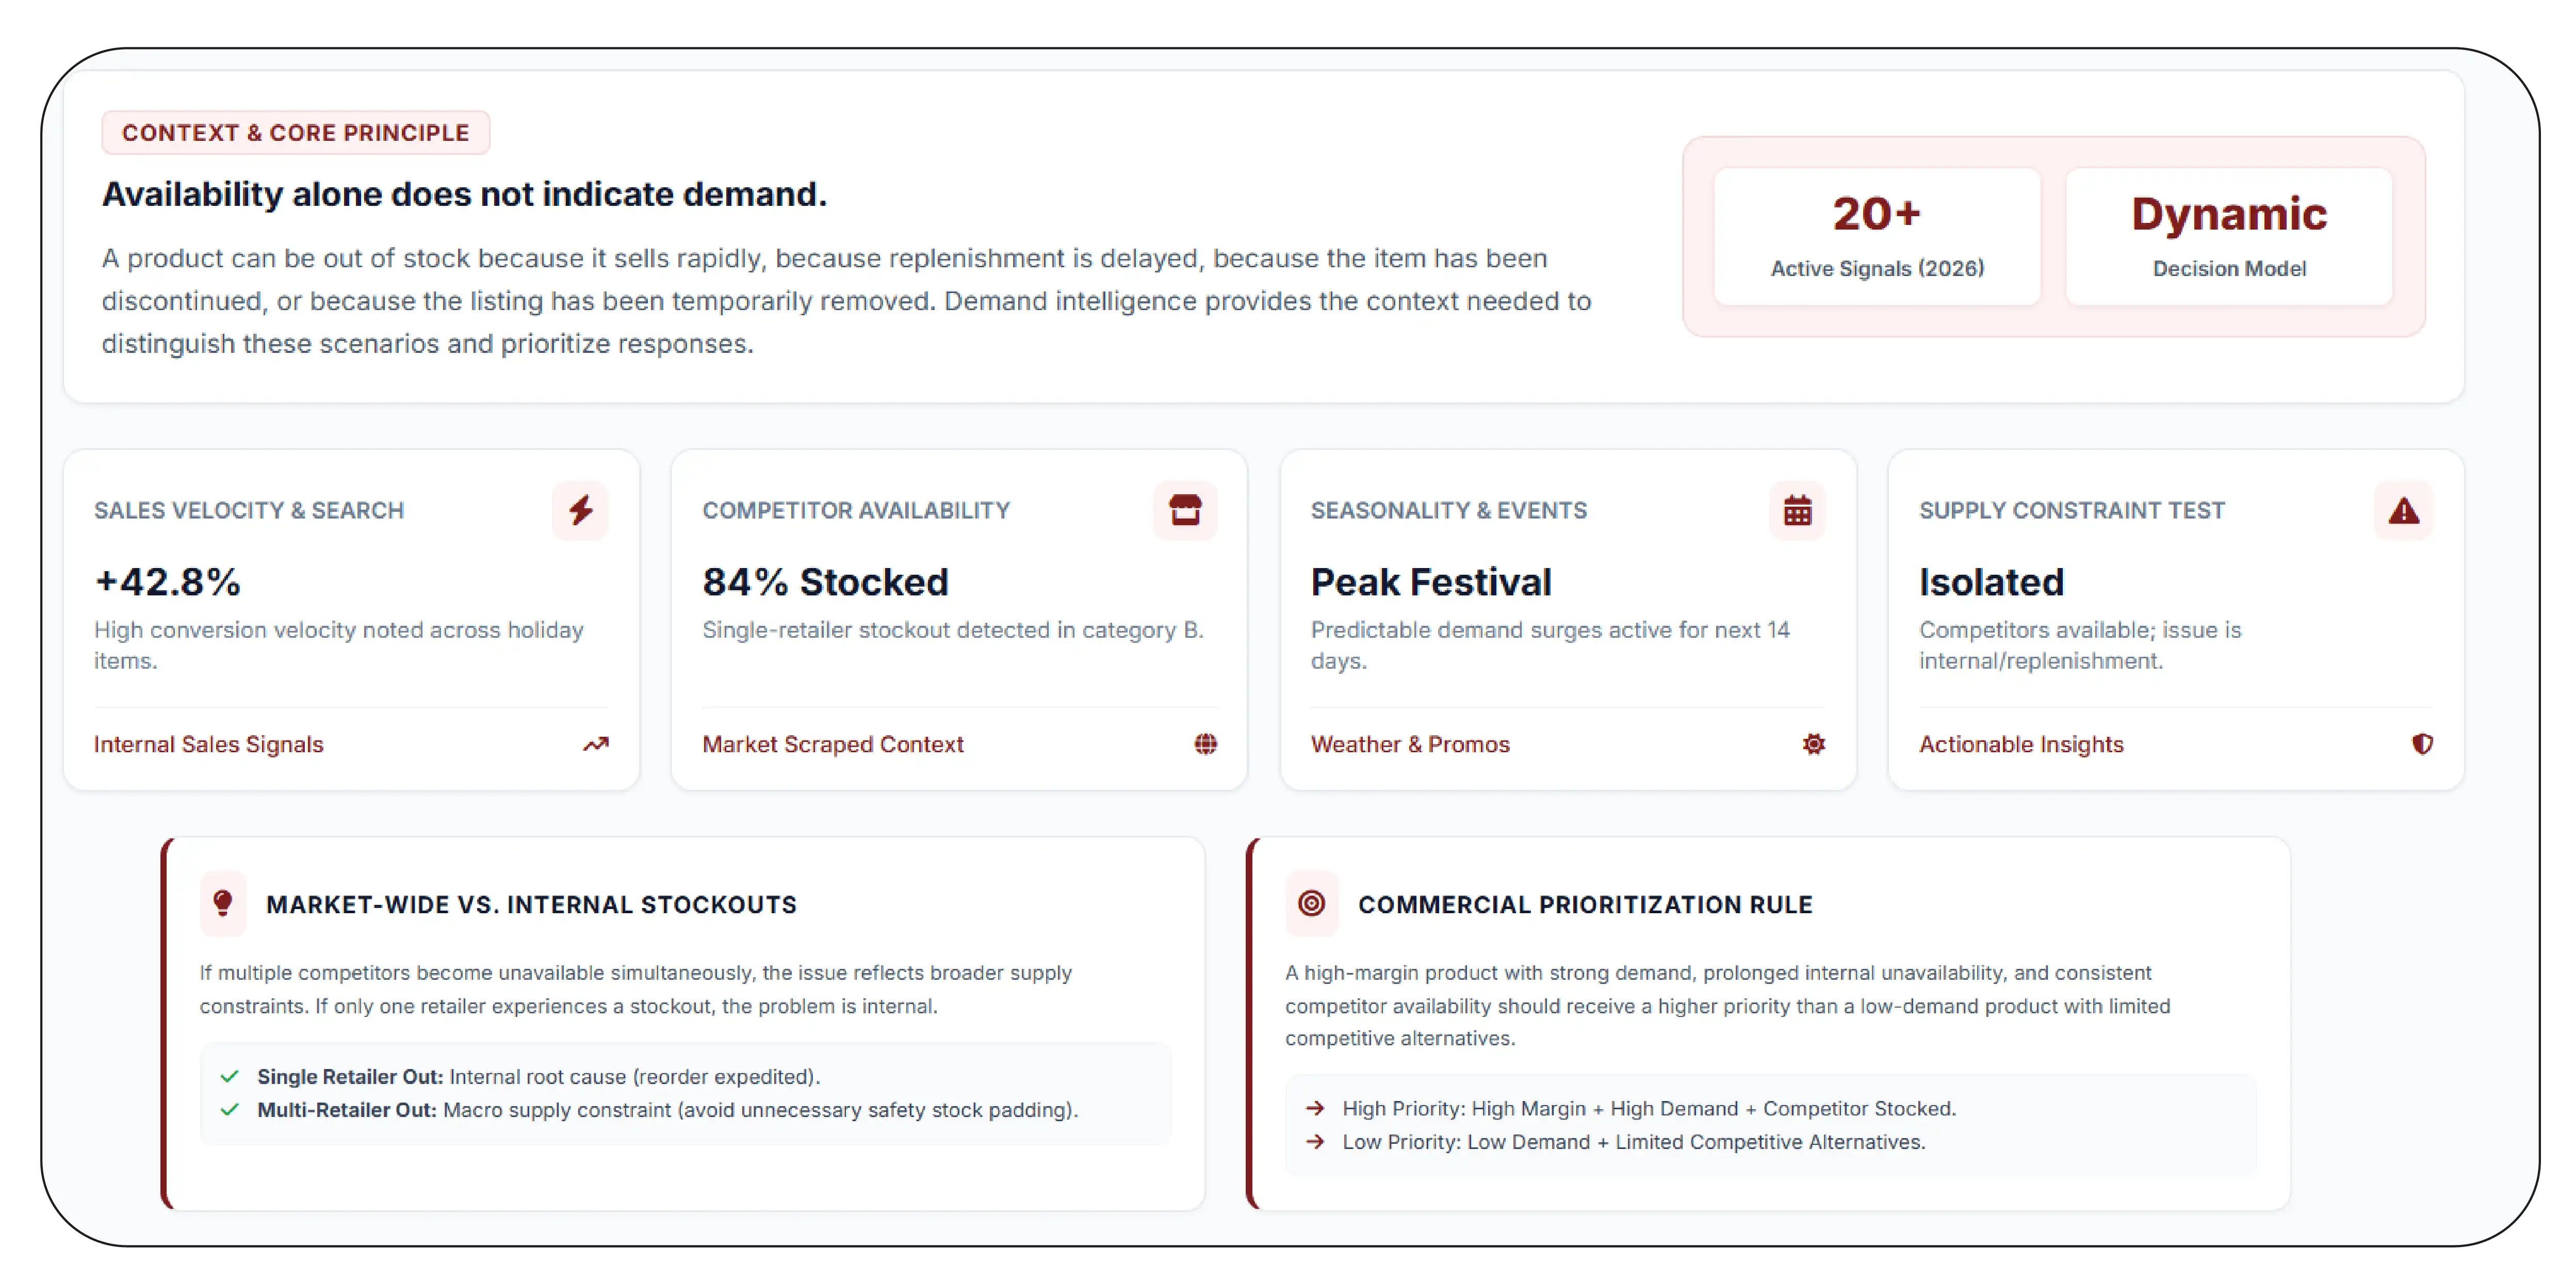
Availability alone does not indicate demand. A product can be out of stock because it sells rapidly, because replenishment is delayed, because the item has been discontinued, or because the listing has been temporarily removed. Demand intelligence provides the context needed to distinguish these scenarios.
Retailers can combine scraped availability with internal sales velocity, search behavior, conversion data, historical demand, category trends, competitor availability, product ratings, and pricing information. The resulting analysis can identify products where supply interruptions are most commercially important.
Seasonality is another major consideration. Products can experience predictable demand increases during holidays, weather changes, festivals, school periods, sporting events, or promotional campaigns.
Demand and Inventory Intelligence
| Year |
Demand Signals |
Inventory Signals |
Decision Model |
| 2020 |
3 |
3 |
Manual |
| 2021 |
4 |
4 |
Rule-based |
| 2022 |
6 |
6 |
Weighted |
| 2023 |
8 |
8 |
Historical |
| 2024 |
11 |
11 |
Multi-factor |
| 2025 |
15 |
15 |
Automated |
| 2026 |
20+ |
20+ |
Dynamic |
These represent analytics maturity targets.
A practical prioritization model can score each SKU using demand velocity, stockout duration, competitor availability, category importance, margin, and substitution potential.
For example, a high-margin product with strong demand, prolonged internal unavailability, and consistent competitor availability should receive a higher priority than a low-demand product with limited competitive alternatives.
Retailers can also use these signals for replenishment planning. If multiple competitors become unavailable simultaneously, the issue may reflect broader supply constraints. If only one retailer experiences a stockout, the problem may be internal.
This distinction helps teams avoid unnecessary inventory increases while responding faster to genuine demand opportunities.
How Can Out-of-Stock Monitoring Improve Competitive Response?
Out-of-stock monitoring provides a continuous view of products that become unavailable across retailer and marketplace listings. When combined with competitor observations, it helps teams understand whether an availability problem is isolated or widespread.
Retailers Use Scraped Data to Beat Stockouts by using these observations as an additional decision signal rather than treating scraped availability as a replacement for internal inventory systems. External data can show what customers encounter across competing digital channels, while internal systems provide the authoritative view of warehouse and store inventory.
This combination creates a more complete picture.
Suppose a retailer's internal inventory indicates a product should be available, but the online listing shows unavailable. That discrepancy may indicate a catalog, fulfillment, synchronization, or listing problem. Conversely, if internal inventory is low and competitors are also becoming unavailable, the market may be experiencing broader supply pressure.
Out-of-Stock Intelligence
| Year |
Products Monitored |
Alert Conditions |
Response Model |
| 2020 |
10K |
2 |
Manual review |
| 2021 |
25K |
3 |
Daily review |
| 2022 |
50K |
5 |
Rule-based alerts |
| 2023 |
100K |
7 |
Priority alerts |
| 2024 |
250K |
10 |
Automated alerts |
| 2025 |
500K |
14 |
Risk scoring |
| 2026 |
1M+ |
18+ |
Continuous monitoring |
These are operational targets.
Retailers can establish alert rules around repeated stockouts, high-demand products, competitor availability, and prolonged unavailable periods. Alerts should be prioritized instead of sending notifications for every availability change.
This reduces alert fatigue and keeps teams focused on commercially meaningful events.
A mature workflow can route high-priority availability risks to inventory teams, competitive gaps to category managers, and listing discrepancies to ecommerce operations.
The result is a coordinated response system where scraped data becomes a supporting intelligence layer across multiple retail functions.
Why Choose Product Data Scrape?
Retailers need dependable external product intelligence to understand what customers see across competing digital channels. Win the digital shelf by monitoring availability, product listings, prices, seller information, and competitive changes in a structured way. Product Data Scrape can support scalable data workflows that help inventory, merchandising, pricing, and ecommerce teams identify availability risks faster. Historical datasets make it possible to detect recurring stockouts and compare competitor availability over time. The approach can also support category-level analysis, geographic monitoring, and product prioritization. By connecting external retail signals with internal inventory and demand information, businesses can develop a stronger framework for protecting availability and responding to competitive changes.
Conclusion
Retailers can reduce stockout risks by combining external product availability signals with internal inventory, sales, and demand information. Inventory Visibility becomes stronger when businesses can monitor customer-facing availability, competitor stock signals, pricing, and product changes across digital channels. Retailers Use Scraped Data to Beat Stockouts by using structured monitoring to identify recurring shortages, competitive availability advantages, and regional risks earlier. This supports more informed replenishment and merchandising decisions. With Product Data Scrape, retailers can build scalable availability intelligence workflows.
Contact Product Data Scrape today to monitor competitive availability, strengthen inventory visibility, and build a proactive strategy for reducing stockout-driven revenue loss!
FAQs
1. How does scraped data help prevent stockouts?
Scraped data provides external availability signals across retail websites and marketplaces, helping teams identify product shortages, competitor availability, recurring patterns, and customer-facing availability changes earlier.
2. Can scraped data show exact inventory quantities?
Not always. Many websites expose availability status rather than exact quantities. These signals can complement internal inventory systems without replacing authoritative warehouse or ERP records.
3. Why monitor competitor stock availability?
Competitor availability shows whether customers can purchase the same or similar products elsewhere. This helps retailers prioritize replenishment when their own stockouts create immediate competitive risks.
4. How frequently should retailers monitor availability?
Monitoring frequency depends on product volatility and business importance. Fast-moving products may require daily or near-real-time checks, while slower categories can use weekly monitoring.
5. What can Product Data Scrape provide for retailers?
Product Data Scrape can support structured collection of product availability, pricing, listings, seller information, and related competitive signals for inventory, merchandising, and ecommerce analysis.


 Singapore
 EMAIL
EMAIL
 PHONE
PHONE















.webp)






