Introduction
Brands can identify lost online sales by continuously comparing product availability, prices, assortment, content quality, and search visibility across retailers. Digital Shelf Analytics for Brands turns these signals into actionable insights, helping e-commerce, sales, category, and marketing teams determine whether revenue is being lost because a product is unavailable, overpriced, poorly positioned, or difficult to discover.
The opportunity is significant. U.S. retail e-commerce sales reached $791.7 billion in 2020, representing 14.0% of total retail sales. By 2025, e-commerce sales had reached an estimated $1.234 trillion and 16.4% of total retail sales. In Q2 2026, e-commerce represented 17.1% of total U.S. retail sales.
For brands selling thousands of SKUs across Amazon, Walmart, grocery sites, marketplaces, and retailer-owned stores, manual checks cannot reliably reveal every change. Competitive pricing data can expose retailer-level price differences, unauthorized discounting, promotion gaps, and competitor moves before they materially affect demand.
The core principle is simple: a product cannot generate online revenue if shoppers cannot find it, cannot buy it, or consider its price and presentation unattractive. A modern measurement program therefore connects availability, price, assortment, content, rankings, reviews, and competitor activity instead of analyzing each signal separately.
How can brands detect the online shelf problems that cause lost sales?
The first step is to connect digital shelf signals to commercial consequences. A product that disappears from search results may lose traffic. A product priced above comparable alternatives may lose conversion. A stockout can eliminate the purchase opportunity altogether. An incomplete product page can weaken discovery and shopper confidence.
NIQ identifies out-of-stock status as a foundational KPI because products that are unavailable cannot generate conversions. It also highlights price, promotion, assortment, distribution, share of voice, images, titles, and descriptions as important performance indicators.
Search is equally important. Algolia reports that 69% of consumers say search is the most common way they find products on retail websites, while 92% of shoppers who report a successful onsite search purchase the item they searched for.
| Commercial problem |
Digital signal to monitor |
Potential business impact |
| Lost sales |
Out-of-stock status |
Missed transactions |
| Pricing gap |
Price index vs. competitors |
Conversion and margin pressure |
| Poor visibility |
Search rank/share of search |
Lower product discovery |
| Assortment gap |
Missing SKUs or variants |
Lost category demand |
| Content issue |
Missing images/specifications |
Lower shopper confidence |
| Competitive pressure |
Competitor price, promotion, placement |
Share loss |
For brand managers, the objective is not simply to collect more data. It is to identify which shelf problem deserves immediate intervention and quantify its likely commercial importance.
What does daily pricing intelligence reveal that weekly checks miss?
Digital Shelf Intelligence for Retailers helps commercial teams understand how prices change across channels, locations, sellers, and product variants. This is particularly important when competitors change prices frequently or when marketplace sellers create significant price dispersion.
Scrape Daily Price Updates from Online Retailers gives pricing teams a structured history instead of isolated screenshots. A daily dataset can capture list price, selling price, discount percentage, promotion labels, seller information, product availability, and timestamp. This makes it possible to distinguish a temporary promotion from a persistent pricing gap.
The historical context shows why price monitoring has become more important. U.S. e-commerce sales grew from $791.7 billion in 2020 to $1.034 trillion in 2022 and $1.119 trillion in 2023. They reached $1.193 trillion in 2024 and $1.234 trillion in 2025.
| Year |
U.S. e-commerce sales |
Share of total retail sales |
| 2020 |
$791.7B |
14.0% |
| 2021 |
— |
14.6% |
| 2022 |
$1.034T |
14.6% |
| 2023 |
$1.119T |
15.4% |
| 2024 |
$1.193T |
16.1% |
| 2025 |
$1.234T |
16.4% |
| 2026 |
Q2: $340.2B |
17.1% of total retail sales |
Source: U.S. Census Bureau. 2026 figure is Q2 rather than a full-year estimate.
For pricing teams, the practical lesson is to move from "What is our price today?" to "How has our price moved relative to every meaningful competitor, retailer, seller, and promotion?"
A daily price history also supports MAP monitoring, promotion effectiveness, price elasticity analysis, and retailer negotiations. NIQ notes that digital shelf systems can monitor minimum advertised pricing violations using comprehensive store-level data.
How can continuous monitoring expose retailer-level execution problems?
Digital Shelf Monitoring Across Online Retailers allows brands to compare the same SKU across multiple digital destinations. Instead of relying on periodic audits, teams can establish a continuous baseline for price, availability, content, search placement, ratings, promotions, and seller activity.
The biggest advantage is speed. Suppose a brand's product remains correctly priced on one retailer but becomes 12% more expensive on another. A weekly review could miss the entire promotional window. Daily monitoring can identify the divergence early, route the issue to the appropriate account team, and preserve the evidence needed for retailer discussions.
NIQ emphasizes that online shelf conditions vary from store to store and that sample-based monitoring can produce misleading conclusions. Its research on 320 online Tesco stores found that comprehensive store coverage was necessary for actionable out-of-stock measurement.
| Monitoring signal |
What teams should compare |
Recommended action |
| Price |
Brand vs. retailer vs. competitor |
Investigate price gap |
| Availability |
In-stock vs. out-of-stock by location |
Escalate supply issue |
| Search |
Rank by keyword and retailer |
Optimize content or media |
| Promotion |
Discount and promotional placement |
Assess promotion execution |
| Content |
Images, titles, descriptions |
Correct missing or inaccurate assets |
| Reviews |
Rating and review movement |
Identify quality or sentiment issues |
From 2020 through 2026, the expansion of online retail has increased the number of digital touchpoints where brands must execute consistently. By Q2 2026, U.S. e-commerce accounted for 17.1% of total retail sales, according to the Census Bureau.
The buyer persona here is typically the e-commerce director, digital commerce manager, category leader, or marketplace manager responsible for performance across multiple retail partners. Their problem is not lack of data. It is fragmented data that arrives too late.
An effective monitoring program therefore uses alerts based on business thresholds. For example, a brand could trigger an alert when price variance exceeds 5%, availability falls below a defined threshold, or search rank drops by a predetermined number of positions.
How does assortment and availability analysis uncover missed demand?
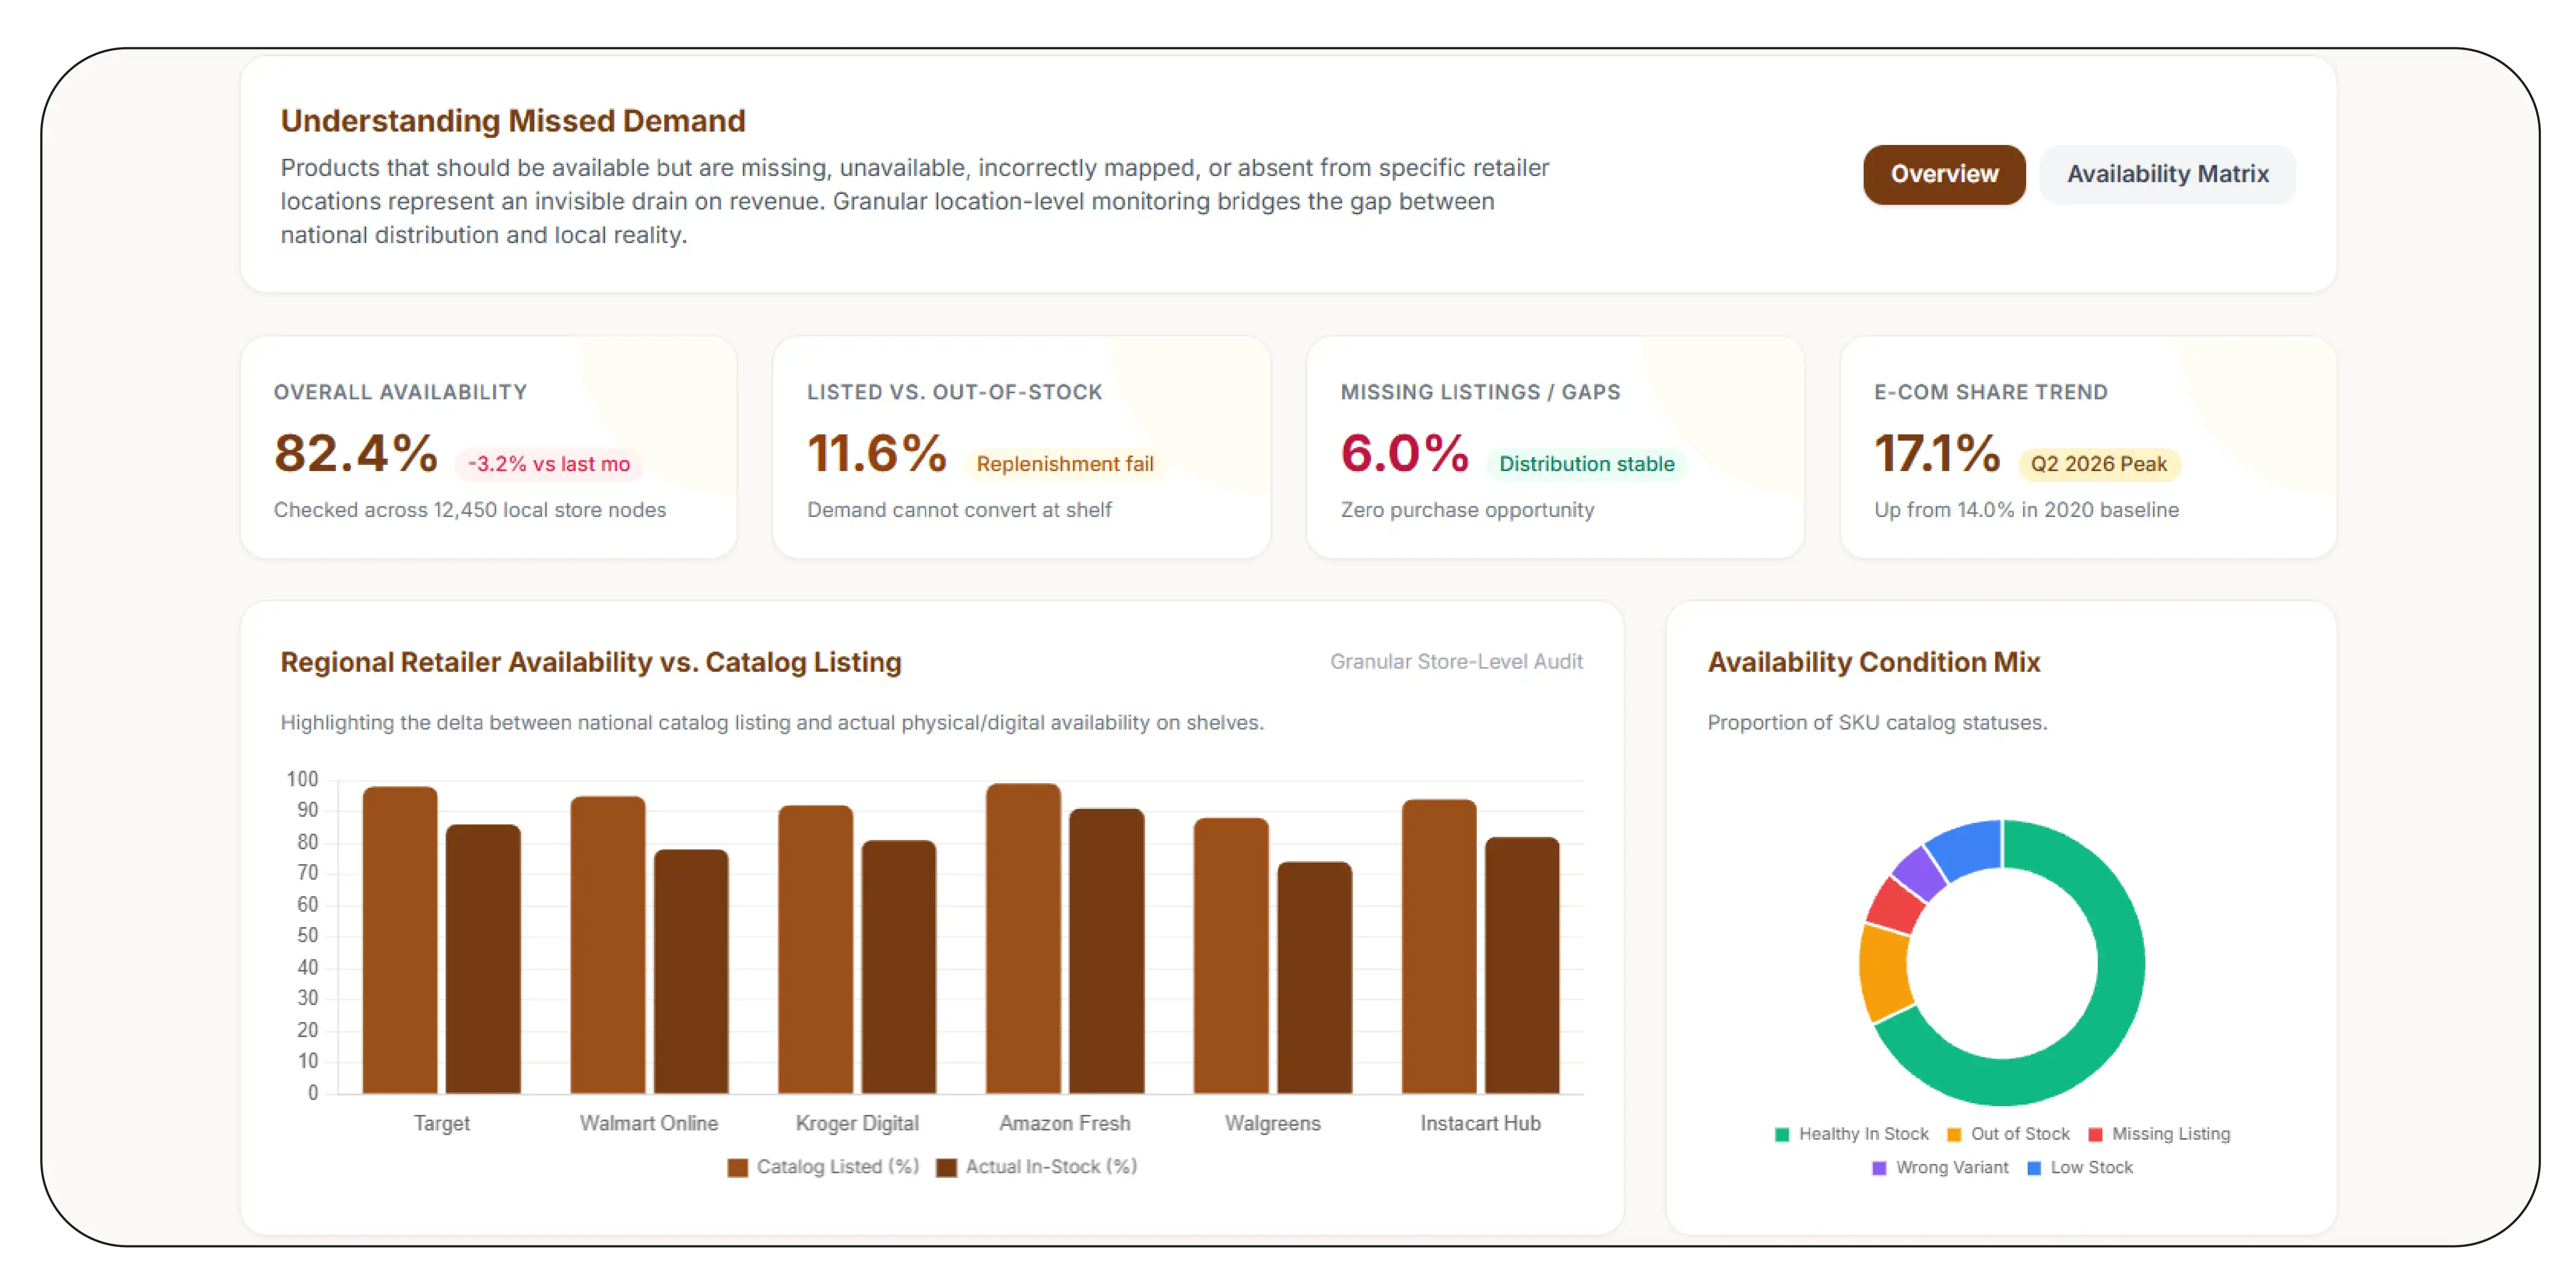
Digital Shelf Assortment and Availability Tracking helps brands identify a less obvious source of lost revenue: products that should be available but are missing, unavailable, incorrectly mapped, or absent from specific retailer locations.
Availability is the foundation of digital commerce. NIQ states that a product cannot maintain digital presence or generate conversions when it is out of stock. It also stresses the importance of granular, location-level monitoring because availability can differ significantly between stores.
This creates an important distinction between distribution and actual availability. A retailer may technically list a SKU in its catalog, but the product can still be unavailable to shoppers in a particular location. Brands that monitor only national-level status may therefore overestimate their real digital reach.
| Availability condition |
What it means |
Commercial question |
| Listed + in stock |
Healthy shelf presence |
Is visibility strong enough? |
| Listed + out of stock |
Demand cannot convert |
Why is replenishment failing? |
| Missing listing |
No purchase opportunity |
Was distribution lost? |
| Wrong variant |
Shopper sees an incorrect offer |
Is product mapping accurate? |
| Low stock |
Potential future disruption |
Should inventory be prioritized? |
The 2020–2026 period reinforces the need for stronger availability controls. E-commerce's share of U.S. retail sales moved from 14.0% in 2020 to 16.4% in 2025, while Q2 2026 reached 17.1%.
Availability monitoring should therefore connect SKU, retailer, geography, seller, timestamp, and stock status. Brands can then calculate availability by retailer and identify recurring gaps.
The most useful next step is prioritization. A low-volume SKU with a short stockout may require little intervention. A high-demand hero product that disappears across major retailers can represent a much larger revenue risk. Combining availability data with demand, traffic, sales, and historical performance makes that distinction possible.
How can brands connect shelf signals to actual commercial performance?
Digital Shelf Performance Analytics for Brands becomes valuable when shelf metrics are connected to business outcomes. Digital Shelf Analytics for Brands should not operate as a dashboard that simply reports problems. It should help teams determine which problems are most likely to affect revenue, conversion, margin, or market share.
Consider a product with strong traffic but weak conversion. A pricing comparison might reveal that the product is consistently above the category price index. Alternatively, the product could have strong pricing but poor search placement. Another SKU could rank highly but remain unavailable. These situations require different interventions.
NIQ describes digital shelf analytics as a KPI framework covering out-of-stock, price and promotion, assortment, distribution, share of assortment, share of voice, content, titles, descriptions, ratings, and reviews.
| Shelf signal |
Business metric to connect |
Diagnostic question |
| Search rank |
Traffic |
Are shoppers finding the SKU? |
| Availability |
Conversion |
Is demand being blocked by stockouts? |
| Price index |
Conversion/margin |
Is price competitiveness hurting performance? |
| Content quality |
Engagement |
Does the PDP answer shopper questions? |
| Reviews |
Conversion |
Is consumer sentiment weakening demand? |
| Assortment |
Revenue |
Are key variants missing? |
The historical growth of e-commerce provides context. Annual U.S. e-commerce sales increased 5.4% in 2025 to $1.2337 trillion, while Q2 2026 e-commerce sales increased 12.2% year over year to $340.2 billion on a seasonally adjusted basis.
For brands, this means digital shelf performance should increasingly be managed as a commercial operating system. The strongest approach combines data collection, normalization, SKU matching, anomaly detection, historical comparison, and business prioritization.
A practical scorecard can rank every SKU by revenue exposure and severity. This allows teams to start the day with the ten problems most likely to affect sales instead of reviewing thousands of product records manually.
How can competitor data reveal gaps before sales decline?
Digital Shelf Competitive Intelligence Data enables brands to see the shelf from the shopper's perspective. Instead of evaluating performance only against internal targets, teams can benchmark their products against competitors on price, availability, assortment, content, reviews, search placement, promotions, and seller activity.
Competitive benchmarking is particularly useful when a brand's sales decline without an obvious internal problem. The brand may have maintained its own price and inventory while a competitor introduced a cheaper offer, launched a new variant, improved content, or gained better search placement.
Digital shelf platforms commonly combine pricing, availability, content, share of search, and competitor benchmarking. Gartner describes the digital shelf analytics category as applications that provide brands and manufacturers with data from third-party digital channels where products are sold, with dashboards designed to optimize product data and performance.
| Competitive dimension |
Brand question |
Strategic response |
| Price |
Are we materially more expensive? |
Reassess pricing or promotion |
| Availability |
Is the competitor consistently in stock? |
Improve replenishment |
| Assortment |
Does the competitor offer more variants? |
Review portfolio gaps |
| Search |
Are competitors appearing above us? |
Improve content or media |
| Content |
Is their PDP more complete? |
Upgrade product content |
| Promotion |
Are competitors discounting more frequently? |
Evaluate promotional strategy |
The 2020–2026 e-commerce trajectory shows why this comparison matters. Online sales represented 14.0% of U.S. retail in 2020 and 16.4% in 2025, reaching 17.1% in Q2 2026.
The actionable insight is to benchmark at SKU and retailer level rather than rely on category averages. A competitor may be highly aggressive on one retailer while maintaining premium pricing elsewhere. Such differences can reveal retailer-specific strategies that broad market reports cannot capture.
Which digital shelf metrics should brands prioritize first?
Digital Shelf Analytics works best when brands prioritize metrics according to their impact on revenue rather than attempting to optimize every KPI simultaneously.
A useful hierarchy starts with availability. If the product is unavailable, improvements to advertising, search rank, or content may have limited commercial value. Next comes pricing, because a significant price disadvantage can reduce conversion. Search visibility follows because shoppers need to discover the product. Content, reviews, assortment, and promotions then help improve consideration and conversion.
NIQ similarly identifies availability as foundational and highlights pricing, promotion, assortment, distribution, share of voice, content, and reviews as key digital shelf measures.
| Priority |
KPI |
Why it matters |
Example trigger |
| 1 |
Availability |
Product must be purchasable |
SKU becomes OOS |
| 2 |
Price |
Price affects competitiveness |
Price gap exceeds threshold |
| 3 |
Search visibility |
Discovery drives traffic |
Rank falls materially |
| 4 |
Content |
Content supports consideration |
Required attribute missing |
| 5 |
Assortment |
Variants capture demand |
Key SKU absent |
| 6 |
Reviews |
Trust affects conversion |
Rating drops |
| 7 |
Promotions |
Offers influence demand |
Competitor promotion launches |
From 2020 to 2026, the online channel has become increasingly material to total retail. Census data shows annual e-commerce sales increasing from $791.7 billion in 2020 to $1.2337 trillion in 2025. Q2 2026 alone generated $340.2 billion in adjusted e-commerce sales.
For brands, the best operating model is therefore exception-based. Instead of asking analysts to inspect every SKU, the system should identify anomalies, calculate severity, connect them to commercial metrics, and assign the issue to the correct team.
This turns shelf data into a workflow: detect, prioritize, diagnose, act, and measure the outcome.
Why should brands use a dedicated product-data solution?
Product Data Scrape gives brands a structured way to collect and organize information from online retail environments for pricing, assortment, availability, product content, and competitive analysis. The advantage is scale: teams can replace fragmented manual checks with repeatable datasets that support historical comparisons.
For teams managing multiple retailers, the most valuable capabilities are automated collection, SKU matching, retailer-level monitoring, price tracking, availability detection, structured product attributes, and export-ready datasets.
The approach also supports faster investigation. When a product loses visibility, teams can compare its current shelf position with historical pricing, stock status, competitor activity, and content changes.
The result is a more practical workflow for e-commerce managers, category leaders, marketplace teams, sales organizations, and brand executives who need evidence before taking corrective action.
What makes a digital shelf program effective?
Track Digital Shelf performance at SKU, retailer, seller, keyword, and location levels whenever the data supports that granularity. This prevents broad averages from hiding the exact source of a problem.
The strongest programs combine historical data with current alerts. A one-day price change matters differently from a six-week pricing disadvantage. A one-hour stockout matters differently from recurring availability failures. Context makes the signal actionable.
Digital Shelf Analytics for Brands should therefore be treated as an operating process rather than a reporting exercise. Teams need clear thresholds, ownership rules, escalation workflows, and measurable outcomes.
A practical framework is:
- Collect product and competitor data continuously.
- Normalize SKUs and retailer attributes.
- Detect pricing, availability, content, and visibility anomalies.
- Prioritize issues using revenue exposure.
- Assign corrective actions to responsible teams.
- Measure whether the intervention improved performance.
Conclusion
The fastest way to uncover lost online sales is to connect availability, pricing, assortment, content, and visibility data at the SKU and retailer level. Digital Shelf intelligence shows where products disappear, become uncompetitive, or lose discoverability before those problems become difficult to diagnose.
Digital Shelf Analytics for Brands gives commercial teams the evidence needed to prioritize the problems with the greatest potential revenue impact. The approach becomes even more powerful when historical data is combined with competitive benchmarks and automated alerts.
For brands scaling across marketplaces and retailer websites, manual shelf checks are increasingly insufficient. Product Data Scrape can help build structured, repeatable datasets for pricing, availability, assortment, and competitive monitoring.
Start building a data-driven digital shelf monitoring workflow today to identify pricing gaps, prevent availability losses, and protect product visibility across online retailers!
FAQs
1. What is digital shelf analytics?
It is the process of measuring product availability, pricing, assortment, content, reviews, search visibility, and competitive positioning across online retailers to identify performance gaps and commercial opportunities.
2. How does digital shelf analysis identify lost sales?
It identifies conditions that can prevent purchases, including stockouts, missing listings, weak search placement, price disadvantages, incomplete content, unavailable variants, and competitor promotional advantages.
3. Why is daily product monitoring important?
Daily monitoring captures price, availability, promotion, seller, and content changes sooner than periodic audits, allowing teams to investigate problems while the commercial impact can still be addressed.
4. Can Product Data Scrape support competitive analysis?
Yes. Product Data Scrape can support structured collection of retailer product information for comparing prices, assortment, availability, product attributes, and competitive positioning across online channels.
5. Which teams benefit most from digital shelf analysis?
E-commerce, marketplace, category, sales, pricing, marketing, and revenue teams benefit because the data connects retailer execution problems with visibility, conversion, pricing, assortment, and competitive performance.


 Singapore
 EMAIL
EMAIL
 PHONE
PHONE















.webp)






