Introduction
The core challenge for grocery retailers, brands, and market-intelligence teams is not simply collecting prices—it is comparing the same product, pack size, and UPC across different stores and locations. A structured Nationwide US Grocery Price Comparison Platform 2026 can solve this by combining store-level product identification, UPC matching, price collection, promotions, availability, and historical benchmarking.
US grocery pricing has remained highly dynamic since 2020. USDA data shows food-at-home prices increased 3.5% in 2020, 3.5% in 2021, 11.4% in 2022, 5.0% in 2023, and 1.2% in 2024. In 2025, food-at-home prices increased another 2.3%. For 2026, USDA's September forecast projects a 2.4% annual increase. (Economic Research Service)
For businesses, these changes make daily, store-specific monitoring more useful than occasional manual price checks. Scrape Daily US Grocery Pricing Data with UPC Codes to connect identical products across retailers and locations, enabling normalized comparisons and more reliable pricing intelligence.
How Can Businesses Build a Reliable National Grocery Price Benchmark?
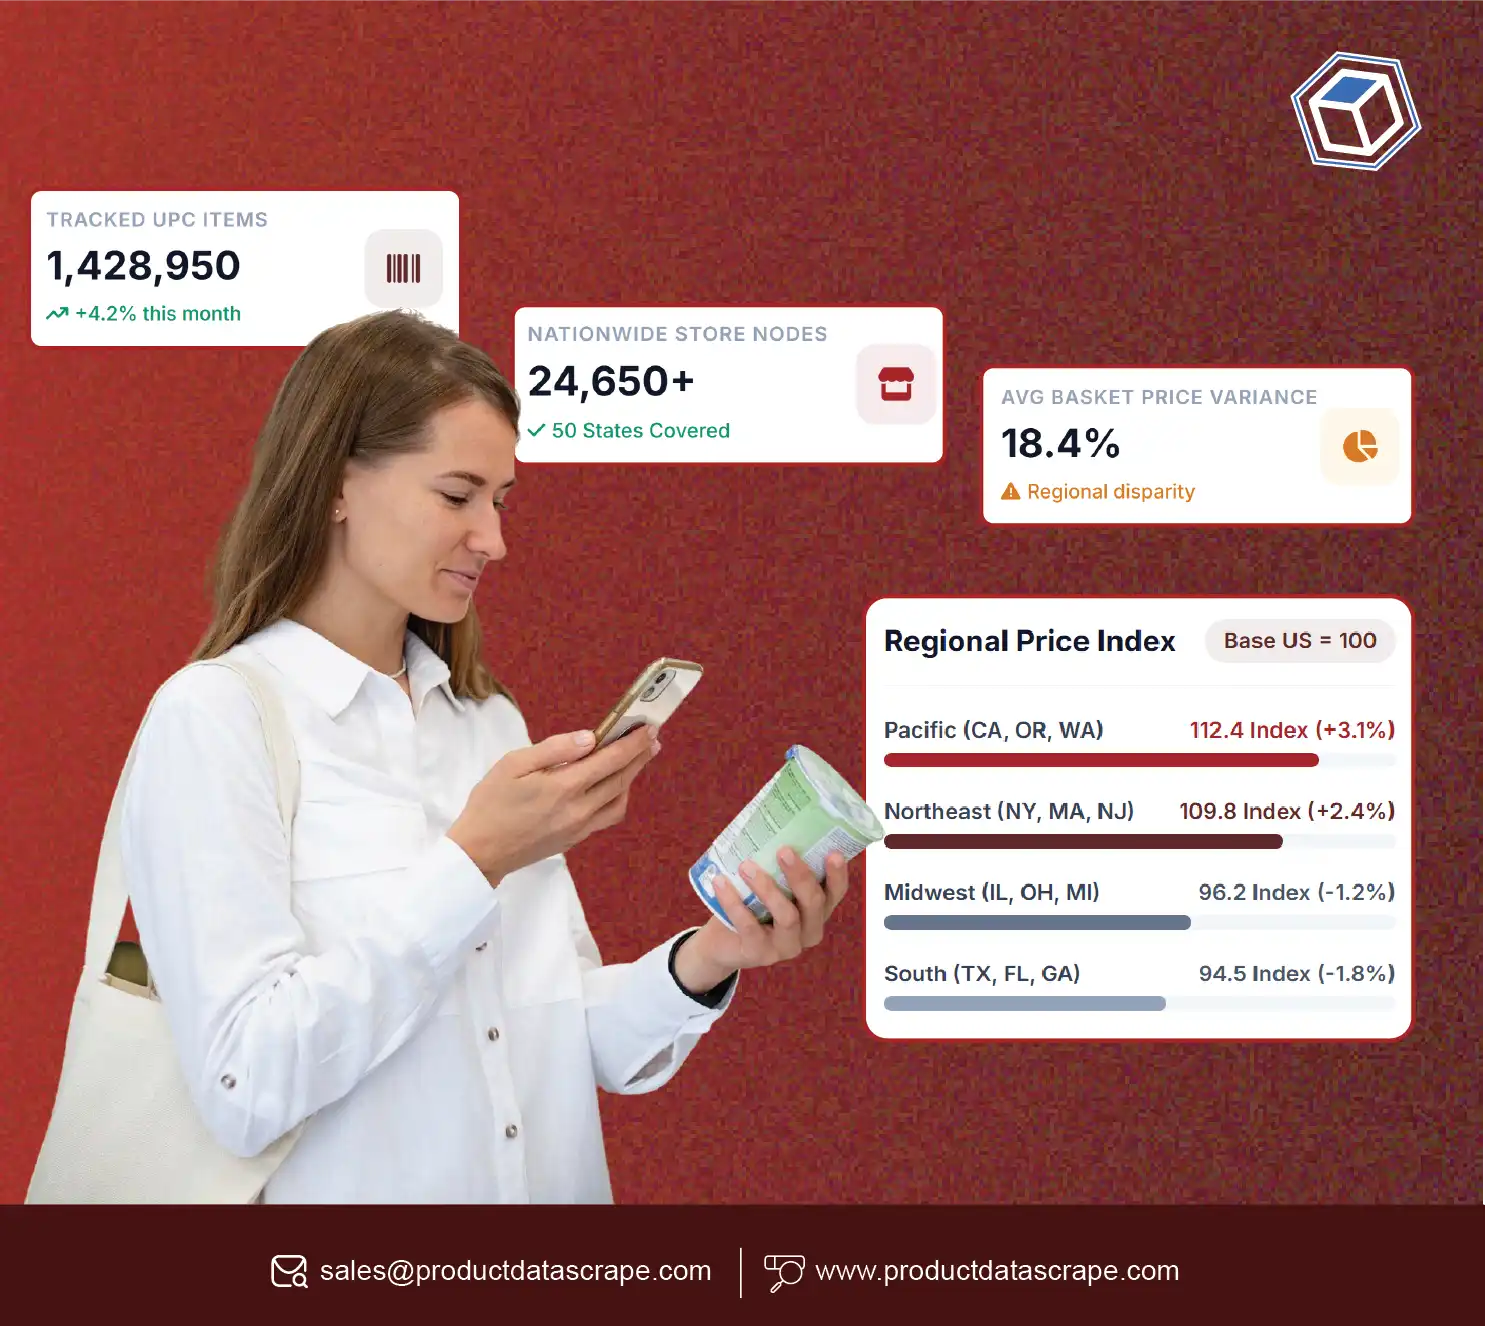
Nationwide Grocery Price Tracking USA becomes more useful when businesses move from isolated product checks to a standardized dataset covering retailers, stores, ZIP codes, categories, UPCs, prices, promotions, and timestamps. Grocery Datasets can then support historical analysis, competitive benchmarking, assortment monitoring, and regional price intelligence.
The 2020–2026 period demonstrates why historical coverage matters. In 2020 and 2021, food-at-home prices each rose 3.5%. Growth accelerated sharply to 11.4% in 2022 before moderating to 5.0% in 2023 and 1.2% in 2024. Prices increased 2.3% in 2025, while USDA's September 2026 forecast is 2.4%. (Economic Research Service)
A national dataset should therefore preserve historical observations rather than overwrite yesterday's price with today's value. Each record can include retailer, store identifier, ZIP code, UPC/GTIN, product name, brand, pack size, category, regular price, promotional price, availability, and collection timestamp.
| Year |
Food-at-home price change |
| 2020 |
3.5% |
| 2021 |
3.5% |
| 2022 |
11.4% |
| 2023 |
5.0% |
| 2024 |
1.2% |
| 2025 |
2.3% |
| 2026 |
2.4% forecast |
This structure allows teams to separate national inflation from retailer-specific pricing behavior. USDA also provides monthly geographic food-price data covering 90 food-at-home categories across 15 geographic areas, demonstrating the value of regionalized grocery-price analysis. (Economic Research Service)
How Does UPC-Level Monitoring Improve Product Matching?
Store-Level UPC-Based Grocery Price Monitoring provides a practical foundation for comparing like-for-like products. Instead of matching products only by title, businesses can use UPC/GTIN identifiers alongside brand, size, variant, and category attributes. Grocery data scraping can collect these fields repeatedly from online grocery catalogs and store-specific pages.
GS1 explains that a GTIN is a unique, global, and verifiable product identifier and notes that GTINs may also be referred to as UPCs, EANs, or barcodes. (GS1 GO Customer Service Portal) This makes identifier-based matching particularly useful when product names differ between retailers.
From 2020 through 2026, the business requirement has shifted from periodic research toward continuously updated product intelligence. During the sharp 2022 inflation period, a retailer could change a product's price several times while promotional offers created additional variation. In 2024 and 2025, slower overall food inflation did not eliminate category-level differences; USDA reported that eggs and beef behaved very differently from categories such as vegetables and dairy. (Economic Research Service)
| Data field |
Benchmarking purpose |
| UPC/GTIN |
Product identity |
| Store ID |
Location comparison |
| Product name |
Human-readable identification |
| Brand |
Brand-level analysis |
| Pack size |
Like-for-like matching |
| Regular price |
Base benchmark |
| Sale price |
Promotion analysis |
| Availability |
Stock visibility |
| Timestamp |
Historical tracking |
A robust workflow should also flag missing UPCs, duplicate identifiers, changed pack sizes, discontinued products, and suspicious price movements before data reaches an analytics layer.
How Can Retailers Compare Prices Across Different US Locations?
Nationwide Grocery Price Comparison Across US Stores enables businesses to examine whether the same SKU is priced consistently across markets. A product can be available at multiple stores but carry different prices because of regional demand, operating costs, promotions, competition, or local pricing strategies.
USDA's area-level food-price data reinforces the importance of geographic analysis: its F-MAP dataset provides monthly prices across 15 US geographic areas and 90 food-at-home categories. (Economic Research Service) However, category-level public statistics do not replace product-level store monitoring. A business may need to know why a specific cereal, beverage, snack, or dairy SKU costs differently at two locations.
The 2020–2026 period offers several reasons to maintain this granularity. Food-at-home inflation reached 11.4% in 2022, then slowed considerably in 2024 and 2025. Yet category-level variation remained significant. In 2025, USDA reported a 21.9% annual increase in average egg prices and an 11.6% increase in beef and veal, while fresh vegetables declined 0.4%. (Economic Research Service)
| Comparison layer |
Example insight |
| Store vs. store |
Same SKU price gap |
| City vs. city |
Regional pricing pattern |
| State vs. state |
Geographic variance |
| Retailer vs. retailer |
Competitive benchmark |
| Regular vs. sale |
Promotion depth |
| Current vs. historical |
Price movement |
This makes store-level comparison useful for pricing teams, consumer brands, category managers, and market researchers that need granular competitive intelligence.
What Should a Store-and-UPC Dataset Capture?
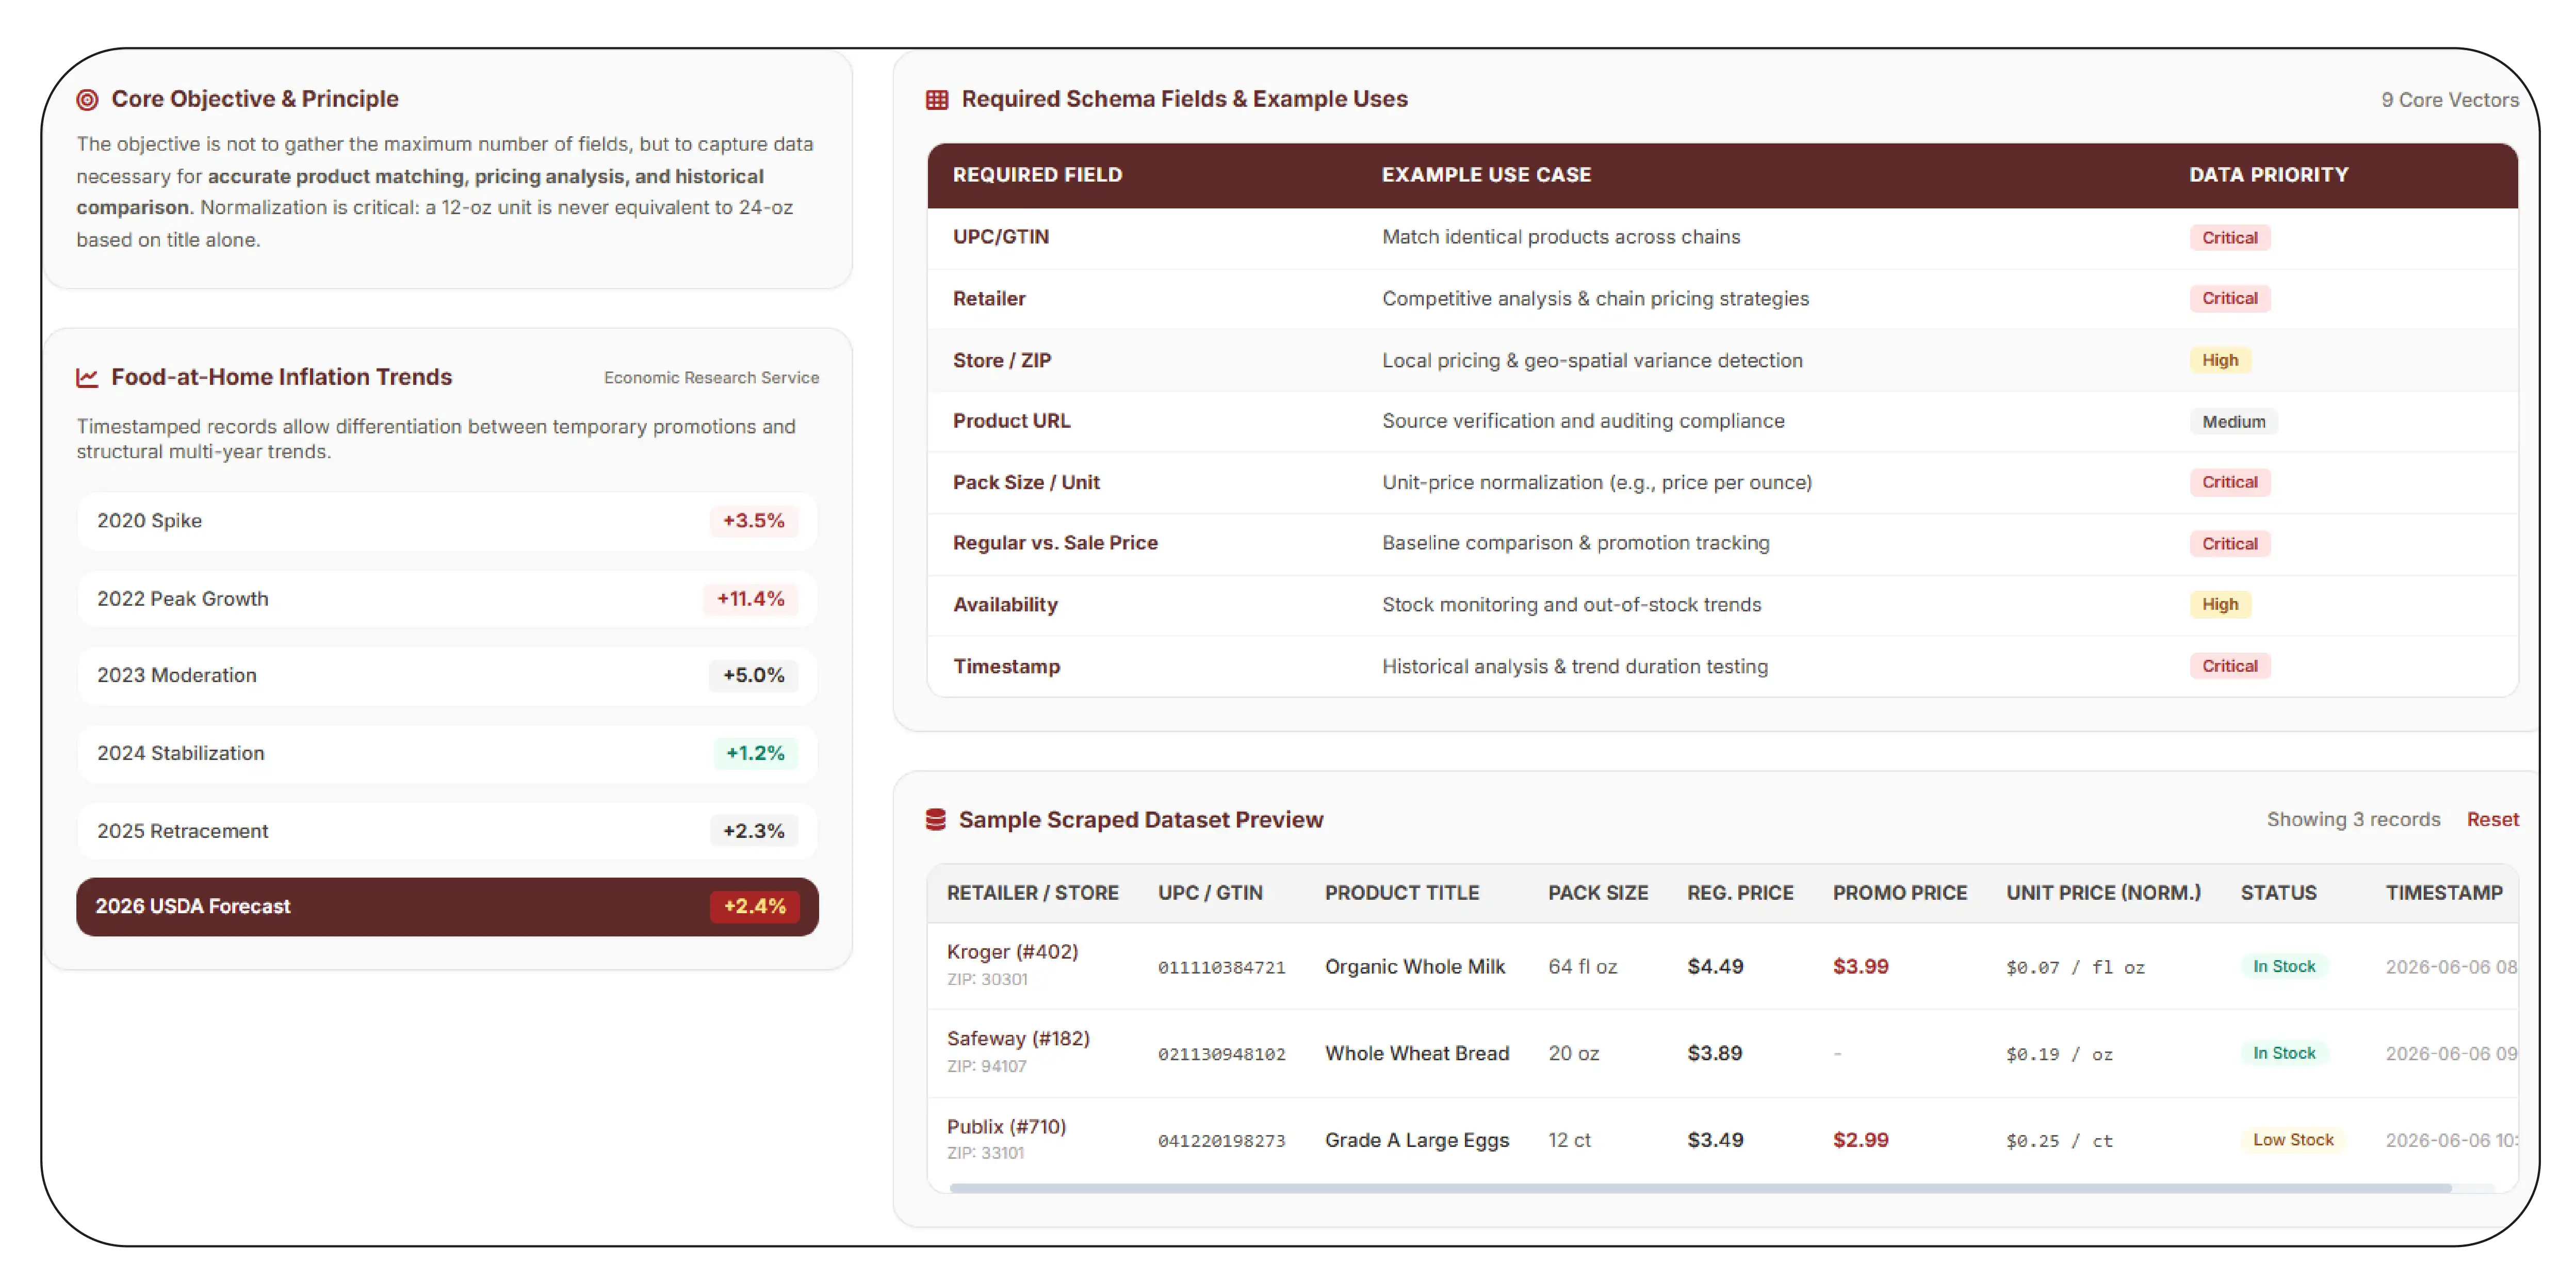
A scalable Scrape US Grocery Price Data by Store and UPC Guide should define the dataset before collection begins. The objective is not to gather the maximum number of fields; it is to capture the fields necessary for accurate product matching, pricing analysis, and historical comparison.
A practical schema can include retailer name, store identifier, ZIP code, product URL, UPC/GTIN, SKU, product title, brand, category, subcategory, pack size, unit quantity, regular price, promotional price, discount, loyalty price where visible, availability, and collection timestamp.
The 2020–2026 period highlights the need for timestamped records. In 2020, food-at-home prices increased 3.5%; by 2022, annual growth had reached 11.4%. In 2023, growth remained 5.0%, followed by 1.2% in 2024 and 2.3% in 2025. USDA's 2026 forecast is 2.4%. (Economic Research Service) Historical snapshots allow businesses to determine whether an observed price difference is temporary, promotional, regional, or part of a longer trend.
| Required field |
Example use |
| UPC/GTIN |
Match identical products |
| Retailer |
Competitive analysis |
| Store/ZIP |
Local pricing |
| Product URL |
Source verification |
| Pack size |
Unit-price normalization |
| Regular price |
Baseline comparison |
| Sale price |
Promotion tracking |
| Availability |
Stock monitoring |
| Timestamp |
Historical analysis |
Normalization is critical. A 12-ounce product should not be treated as equivalent to a 24-ounce product merely because the product title is similar. Unit-price calculations can provide a second comparison layer.
How Can a Historical Dataset Support Pricing Intelligence?
A US Grocery Price Comparison Dataset becomes strategically useful when it combines current observations with historical snapshots. Instead of answering only "What does this product cost today?", analysts can answer "How has its price changed, where is it most expensive, and how frequently does it go on promotion?"
The 2020–2026 timeline provides a strong example. USDA reports that food-at-home prices grew 3.5% in 2020 and 2021, surged 11.4% in 2022, slowed to 5.0% in 2023, increased 1.2% in 2024, and rose 2.3% in 2025. The September 2026 forecast is 2.4%. (Economic Research Service) These national figures can provide context, while SKU-level records reveal the actual behavior of individual products.
| Period |
Strategic use |
| 2020–2021 |
Establish pandemic-era baseline |
| 2022 |
Analyze high-inflation pricing |
| 2023 |
Track post-peak moderation |
| 2024 |
Identify stabilization |
| 2025 |
Monitor category divergence |
| 2026 |
Compare current prices with historical baseline |
Useful calculations include average price by retailer, minimum and maximum price by UPC, median price by ZIP code, promotional frequency, price-change frequency, and unit-price variance.
The dataset can also support alerts. For example, a 10% price change for a stable SKU could trigger validation before entering a benchmark report. This reduces the risk of treating data errors, pack-size changes, or temporary promotions as genuine market movements.
How Can US Grocery Data Support Digital Retail Analysis?
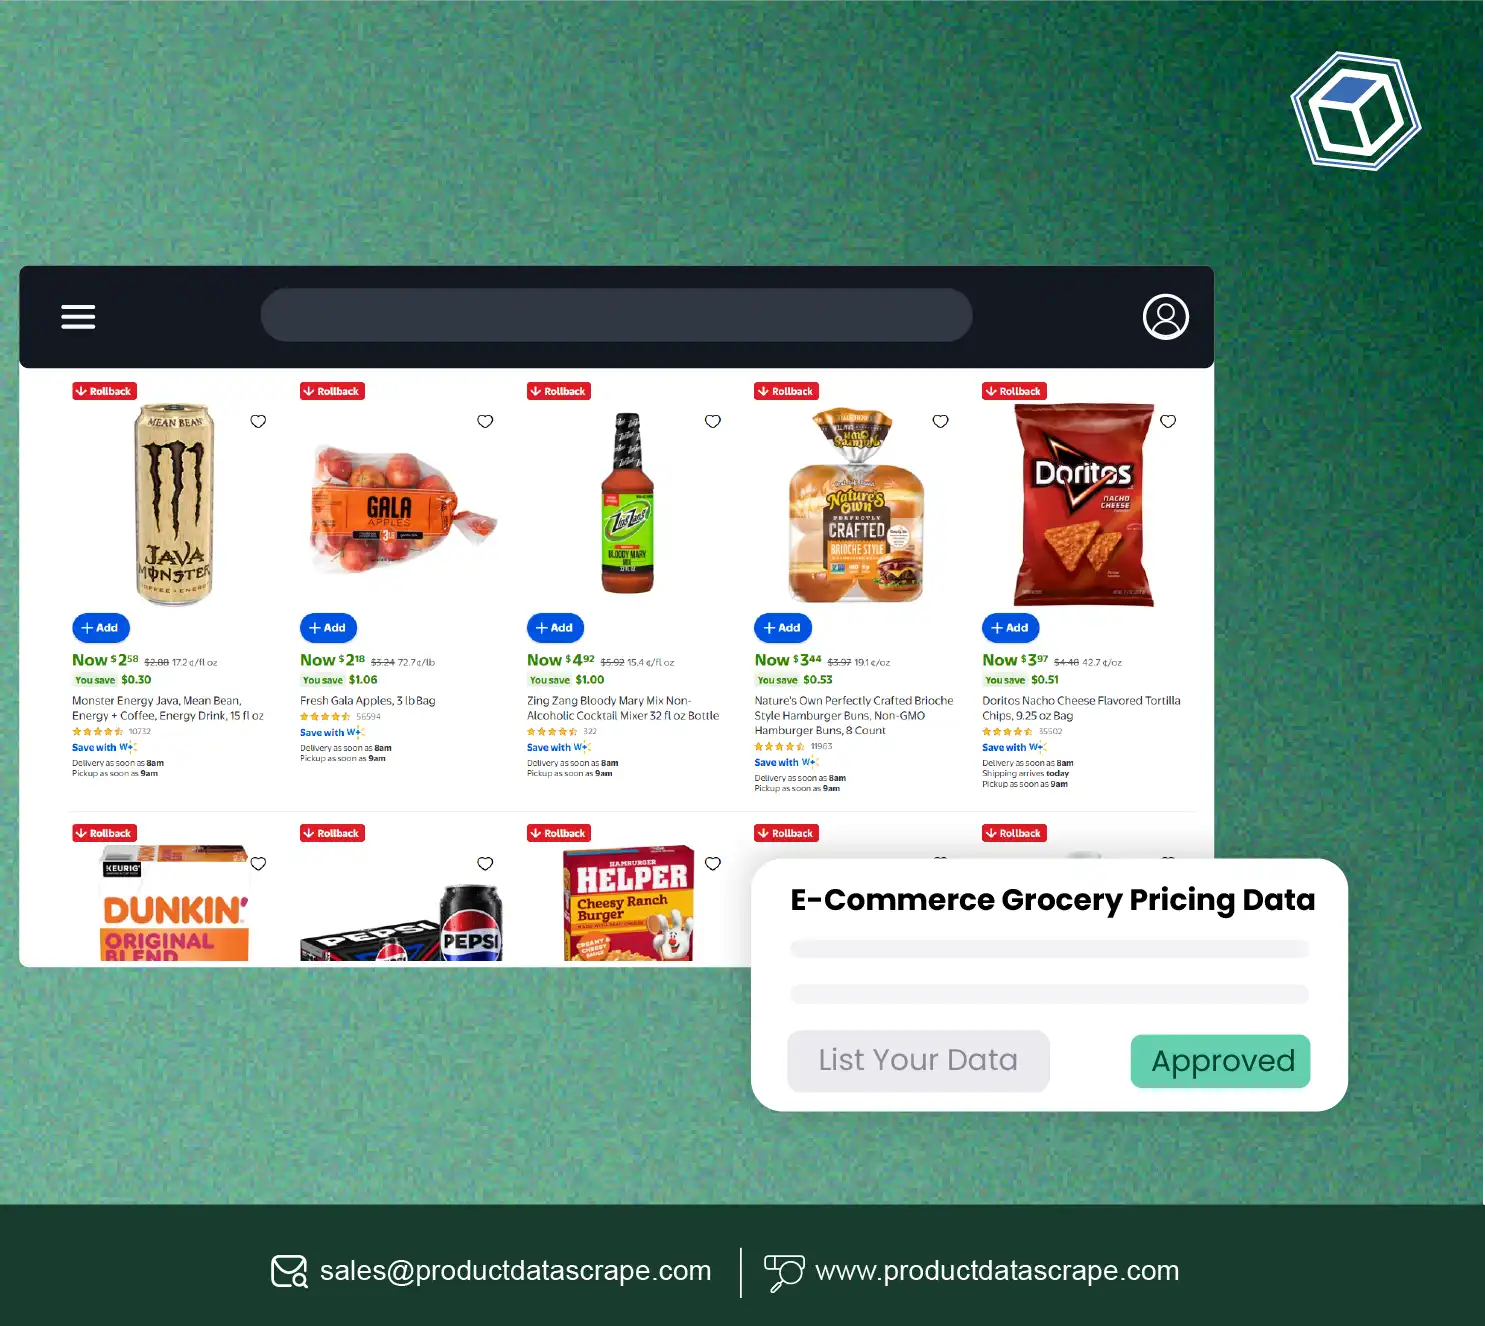
E-commerce data scraping for the US market can extend grocery price analysis beyond traditional store research by capturing product information from digital grocery catalogs and retailer websites. Online grocery pages frequently expose product descriptions, prices, promotions, availability, pack sizes, and other attributes that can be structured for recurring analysis.
The 2020–2026 period is especially relevant because grocery pricing has experienced substantial volatility. USDA reports that food-at-home inflation peaked at 11.4% in 2022 before moderating. In 2025, overall food-at-home prices rose 2.3%, while individual categories moved at significantly different rates. (Economic Research Service)
For 2026, USDA's September forecast places annual food-at-home inflation at 2.4%, while its August data showed food-at-home prices 2.2% above August 2025. (Economic Research Service) This means businesses still need current product-level monitoring even when aggregate inflation is lower than the 2022 peak.
| Digital data element |
Business application |
| Product price |
Price benchmarking |
| UPC/GTIN |
Product matching |
| Promotion |
Deal monitoring |
| Availability |
Stock intelligence |
| Pack size |
Unit-price comparison |
| Category |
Assortment analysis |
| Store/ZIP |
Regional intelligence |
| Timestamp |
Trend analysis |
A scalable pipeline can collect data, validate fields, normalize products, calculate unit prices, compare retailers, store historical snapshots, and deliver structured outputs to dashboards or analytical systems.
Why Choose Product Data Scrape?
Product Data Scrape can support grocery intelligence workflows that require structured product, price, UPC, store, availability, and promotional information. The focus should be on repeatable collection rather than one-time extraction. A suitable workflow can combine source discovery, automated collection, UPC-based matching, field normalization, validation, timestamping, duplicate detection, and structured delivery.
For grocery businesses, this approach can reduce manual spreadsheet work and create a consistent foundation for price benchmarking. Historical datasets can also help teams distinguish temporary promotions from sustained pricing changes.
A scalable architecture can be adapted for different retailers, geographic markets, categories, stores, and collection frequencies while preserving a common schema for downstream analytics.
How Can UPC Scanning Improve Deal Matching?
Grocery Store Deal Matching Data Scraping by UPC scan can connect advertised offers with the exact products represented in a store or digital catalog. UPC-based matching reduces ambiguity when multiple products have similar names but different sizes, flavors, or variants.
For example, a deal engine can compare UPC, regular price, promotional price, store, ZIP code, pack size, and collection timestamp. It can then identify whether the same item is discounted at several retailers or whether an offer is restricted to particular locations.
This approach is useful for consumer brands, retailers, coupon platforms, price-comparison businesses, and market researchers. It can also support automated alerts when a product moves into or out of a promotional state.
Conclusion
Grocery pricing cannot be understood through national averages alone. The most useful intelligence connects product identity, UPC, retailer, store, location, pack size, price, promotion, availability, and time. The 2020–2026 period demonstrates why this structure matters: food-at-home inflation moved from 3.5% in 2020 and 2021 to 11.4% in 2022, then moderated substantially while category-level differences continued. (Economic Research Service)
A well-designed Grocery Inflation Tracking Data workflow can preserve these changes and turn daily observations into actionable benchmarks. A Nationwide US Grocery Price Comparison Platform 2026 can then support competitive pricing, promotion analysis, assortment intelligence, and regional market research.
Partner with Product Data Scrape to build scalable grocery product, UPC, store, price, promotion, and historical datasets tailored to your market-intelligence requirements!
Frequently Asked Questions
1. What is a store-level grocery price dataset?
A store-level grocery price dataset records products, UPCs, prices, promotions, availability, locations, and timestamps so businesses can compare identical products across individual US stores.
2. Why are UPCs important for grocery price comparison?
UPCs provide standardized product identifiers, helping analysts distinguish identical products from similar items with different brands, sizes, flavors, or package configurations.
3. How often should grocery prices be collected?
Daily collection is useful for fast-moving pricing environments because it captures promotions, price changes, stock conditions, and temporary discounts that weekly or monthly snapshots can miss.
4. Can Product Data Scrape support nationwide grocery monitoring?
Yes. Product Data Scrape can structure grocery information by retailer, store, UPC, category, location, price, promotion, availability, and timestamp for recurring analytical workflows.
5. What insights can grocery price data provide?
Businesses can identify retailer price gaps, regional differences, promotion frequency, unit-price changes, assortment shifts, availability patterns, and historical pricing trends across comparable products.


 Singapore
 EMAIL
EMAIL
 PHONE
PHONE


.webp "thumb")













.webp)






