Introduction
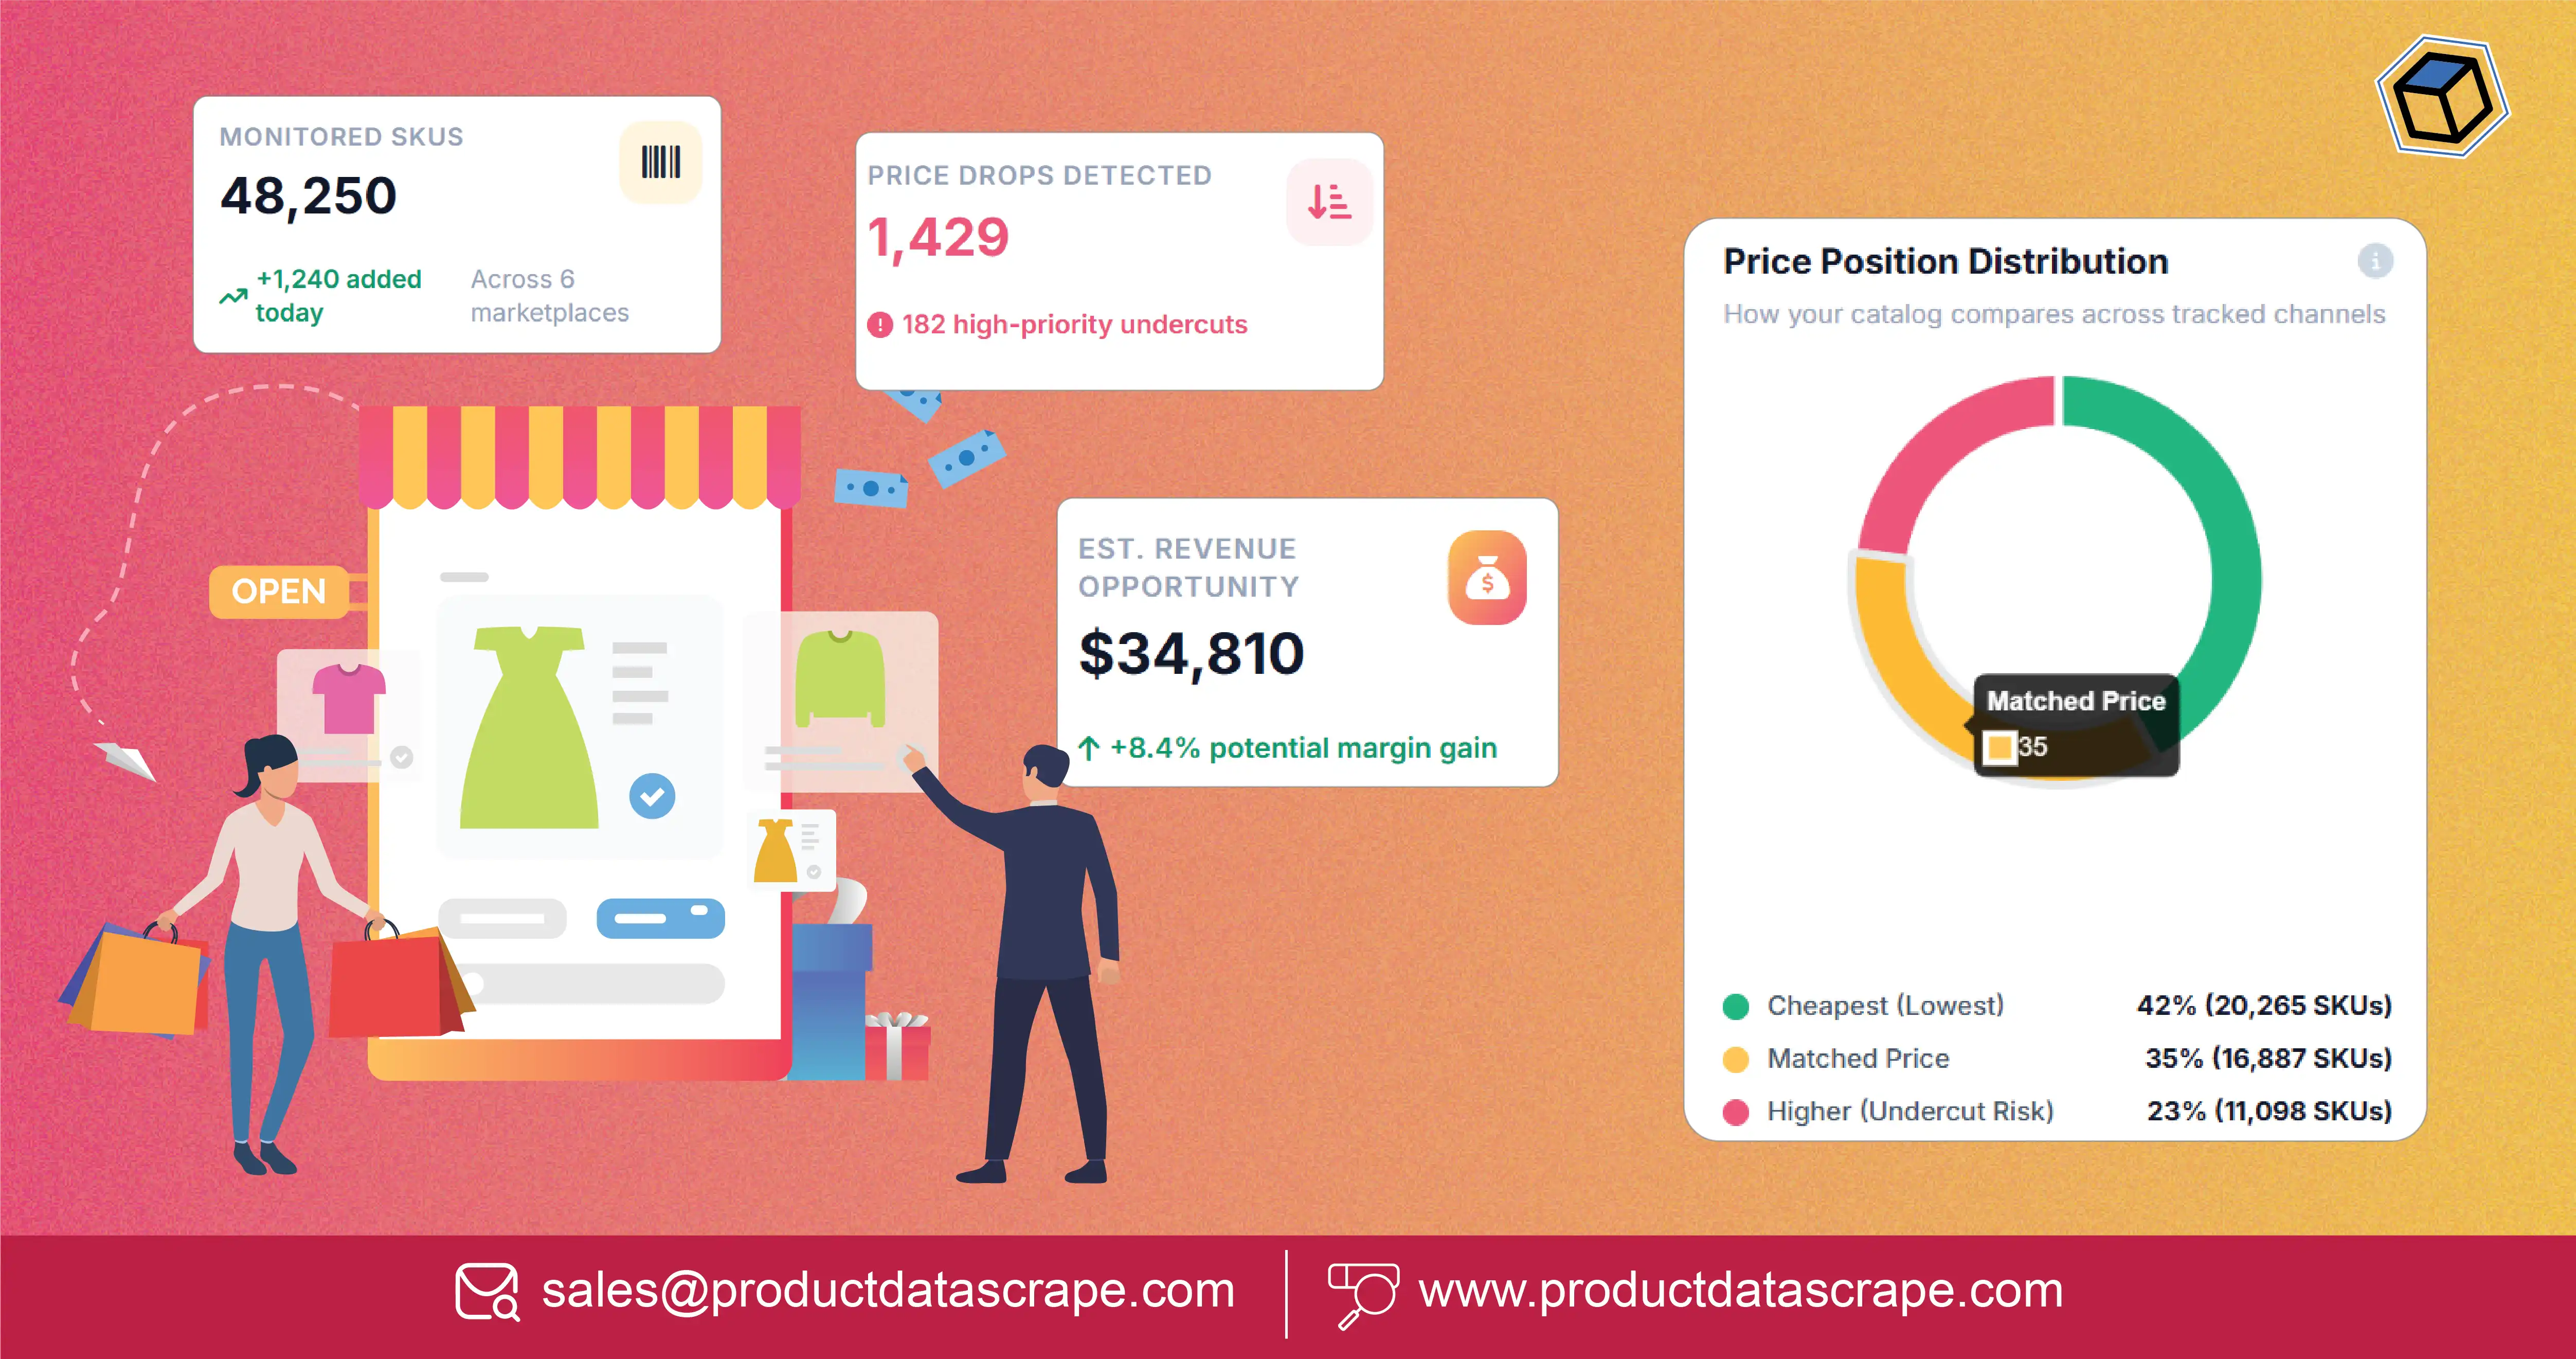
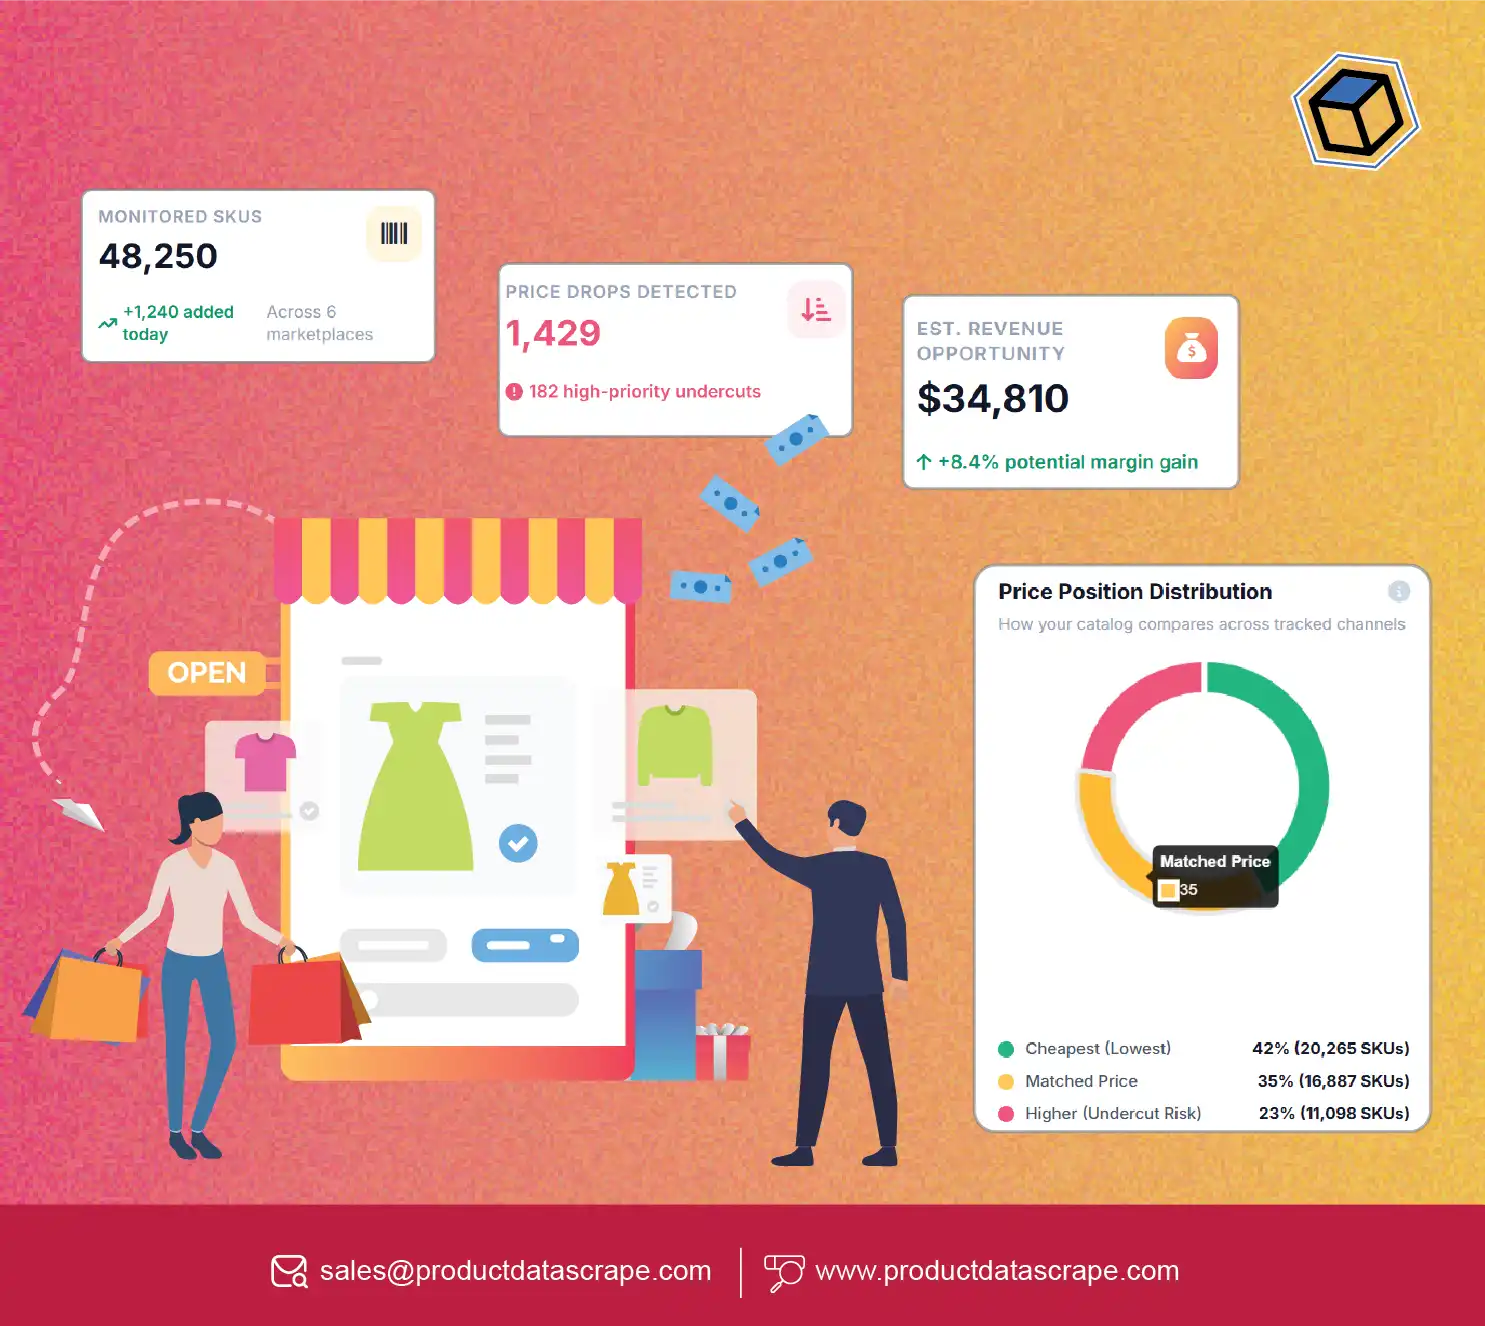
A Multi-site scraper for e-commerce stores helps retailers, brands, and market intelligence teams collect and organize product information from multiple permitted online sources. Combined with Product-Data Mapping Across Ecommerce Sites, it can make daily price comparisons, product matching, availability monitoring, and competitor analysis more consistent.
For e-commerce managers, the challenge is not simply collecting prices. Product titles, SKU formats, pack sizes, currencies, discount labels, and availability statuses often differ between retailers. Without normalization, a dashboard can compare products that are not equivalent and produce misleading pricing decisions.
A structured monitoring workflow addresses this challenge by collecting authorized information, matching comparable products, validating changes, and displaying results in a centralized dashboard. Teams can then identify meaningful price movements, investigate promotional differences, and prioritize products that need attention.
The commercial importance of reliable online data is supported by official retail statistics. The U.S. Census Bureau estimated that U.S. retail e-commerce sales reached $1.2337 trillion in 2025, an increase of 5.4% from 2024. E-commerce accounted for 16.4% of total U.S. retail sales that year. These figures describe the wider market, not the performance of any individual scraper or retailer. Source: U.S. Census Bureau, 2025 quarterly e-commerce report.
For retailers and product-data teams, the practical goal is to turn frequently changing product information into accurate, traceable, decision-ready intelligence.
How Can Automated Collection Improve Daily Pricing Decisions?
A multi-site e-commerce scraper collects selected product information across multiple authorized retailer websites or data sources. When configured for Real-time price tracking, it can check prices at defined intervals or respond to supported data updates. These are different operating models: frequent scheduled collection is not automatically real-time, and actual freshness depends on source access, collection frequency, processing delays, and validation.
The first step is to define which products matter. Retailers may prioritize high-volume SKUs, products with narrow margins, seasonal items, or products that frequently appear in promotions. Each record should preserve the source URL or identifier, product name, seller, observed price, currency, availability, timestamp, and any visible discount information. Additional fields should be collected only where permitted and available.
Next, normalize the data. Convert prices into a consistent numeric format, retain the original currency, distinguish list prices from selling prices, and identify whether shipping or taxes are included. Where a product has multiple sizes or bundles, those attributes should be part of the matching logic.
What do verified market statistics tell retailers?
The following figures provide context for the scale of online retail. They are U.S. Census Bureau estimates of quarterly e-commerce sales, not measurements of price-monitoring adoption.
| Year |
Q4 e-commerce sales, not seasonally adjusted |
| 2020 |
$251.5 billion |
| 2021 |
$275.6 billion |
| 2022 |
$289.5 billion |
| 2023 |
$317.9 billion |
| 2024 |
$345.9 billion |
| 2025 |
$365.2 billion |
| 2026 |
Q2: $329.5 billion |
Source: U.S. Census Bureau historical data via FRED. The 2026 figure is for Q2, not a full-year total. Values are rounded; the latest observations may be revised.
For pricing teams, this growth reinforces the value of scalable product-data workflows, but it does not prove that automated tracking improves profits by a specific percentage. Measure business outcomes directly through indicators such as price-change detection time, product-match accuracy, data completeness, and the time required to investigate a competitor's price change.
A practical recommendation is to begin with a defined product cohort, validate collection quality, and expand only after the data consistently supports the intended decisions.
What Makes a Centralized Monitoring Dashboard Useful?
A multi-site scraper with dashboard gives teams a shared view of collected product information, while Multi-Platform SKU Price Monitoring focuses on tracking equivalent products across different retailer catalogs. Together, these capabilities can reduce fragmented reporting and make price changes easier to investigate.
A dashboard should answer operational questions quickly. Which tracked products changed price? Which competitor listings are unavailable? Which observations are stale? Which product matches need manual review? A useful interface presents the evidence behind each alert rather than displaying an unexplained price difference.
The data model should distinguish a product, a retailer listing, and an individual observation. One product may have multiple retailer listings, and each listing may have many observations over time. This separation makes historical analysis possible without overwriting previous values.
Which metrics should the dashboard display?
| Dashboard metric |
How it supports decisions |
| Latest observed price |
Shows the most recent validated price |
| Previous observed price |
Provides the comparison baseline |
| Percentage price change |
Quantifies a change against the selected baseline |
| Last successful collection |
Identifies stale or delayed records |
| Match confidence |
Highlights uncertain product comparisons |
| Availability status |
Helps distinguish unavailable products from missing observations |
| Source coverage |
Shows which retailers and products are represented |
| Alert status |
Tracks whether significant changes have been reviewed |
The percentage change can be calculated as:
Price change (%) = (New price − Previous price) / Previous price × 100
This calculation is meaningful only when the prices refer to comparable products, currencies, and pricing conditions. If the previous price is zero or missing, the system should flag the calculation rather than produce a misleading result.
For daily monitoring, set a clear collection schedule and display the timestamp of each observation. Do not label a dashboard real-time if data is refreshed only once per day. Likewise, distinguish a failed collection from an actual out-of-stock listing. These distinctions help pricing managers avoid acting on stale or incomplete evidence.
How Can APIs Make Product Data Integration More Reliable?
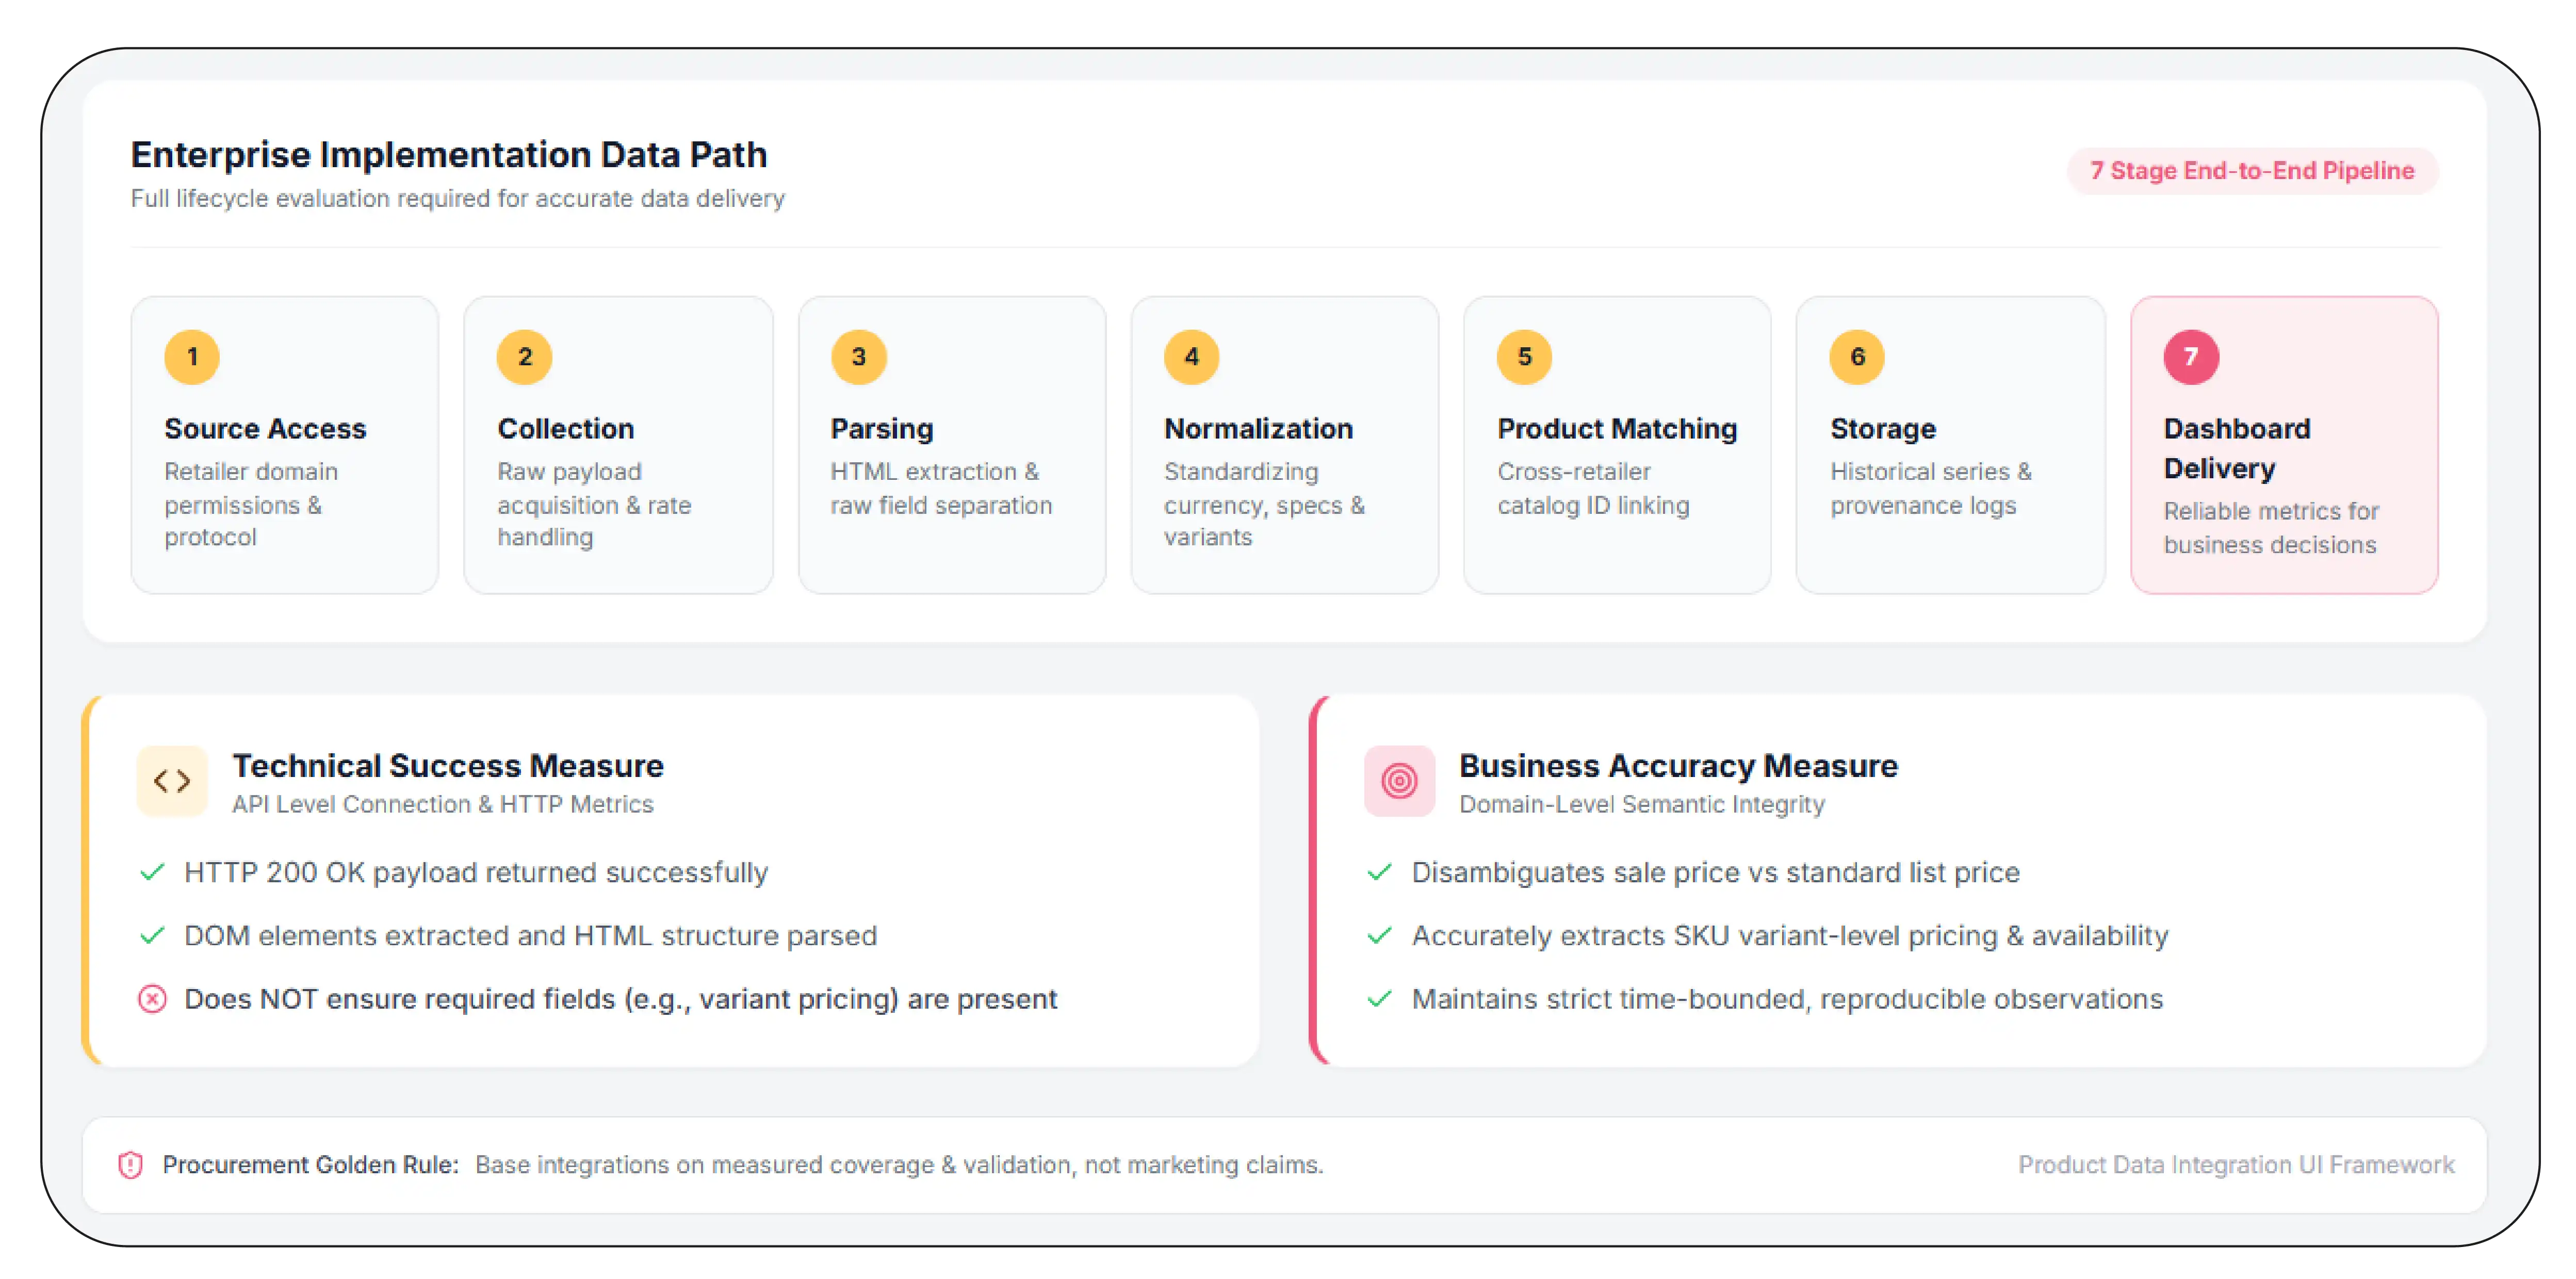
A multi-retailer product data scraping API can provide a structured interface for requesting and processing product observations from supported sources. A Web Scraping API may handle parts of the collection process, but capabilities vary by provider. An API should not be assumed to grant access to every retailer or guarantee that all product fields will be available.
For an enterprise implementation, evaluate the complete data path: source access, collection, parsing, normalization, product matching, storage, and delivery to the dashboard. A provider may return successfully parsed HTML while still missing a variant price or confusing a sale price with a standard price. Technical success and business accuracy are separate measures.
What should procurement teams evaluate?
| Evaluation criterion |
Question to ask |
| Source coverage |
Which specific retailer domains and product pages are supported? |
| Access permissions |
What contractual or technical permissions govern collection? |
| Output schema |
Are fields consistent across supported sources? |
| Refresh controls |
Can collection frequency be configured within permitted limits? |
| Error handling |
Are timeouts, blocked requests, and missing fields reported? |
| Historical storage |
Are previous observations available, or must the buyer store them? |
| Rate limits |
What request limits and concurrency restrictions apply? |
| Security |
How are credentials, logs, and collected data protected? |
The system should also retain provenance. Each record should identify the source, observation time, processing status, and transformation rules. When a price appears unusual, analysts need to trace it back to the original observation and determine whether it reflects a genuine listing change or a parsing error.
For example, the U.S. Census Bureau's retail statistics distinguish reported e-commerce sales from total retail sales and publish estimates with defined periods and revisions. That same principle of explicit definitions applies to commercial product-data pipelines: metrics should be reproducible, time-bounded, and clearly labeled. Source: Census Bureau historical e-commerce releases.
Choose an integration based on measured coverage and validation results, not solely on claims about request volume or the number of supported sites.
How Can Daily Collection Support Competitive Price Analysis?
A multi-retailer scraper for daily price tracking helps retailers compare selected product listings over time, while a Multi-site scraper for e-commerce stores can organize observations from different permitted online sources into one consistent workflow.
Daily collection is particularly useful when teams need a regular snapshot for reporting and decision-making. It can reveal whether a listed price changed between observations, whether a discount remains visible, and whether a product has disappeared from a tracked page. It cannot establish every price change that occurred between collection runs.
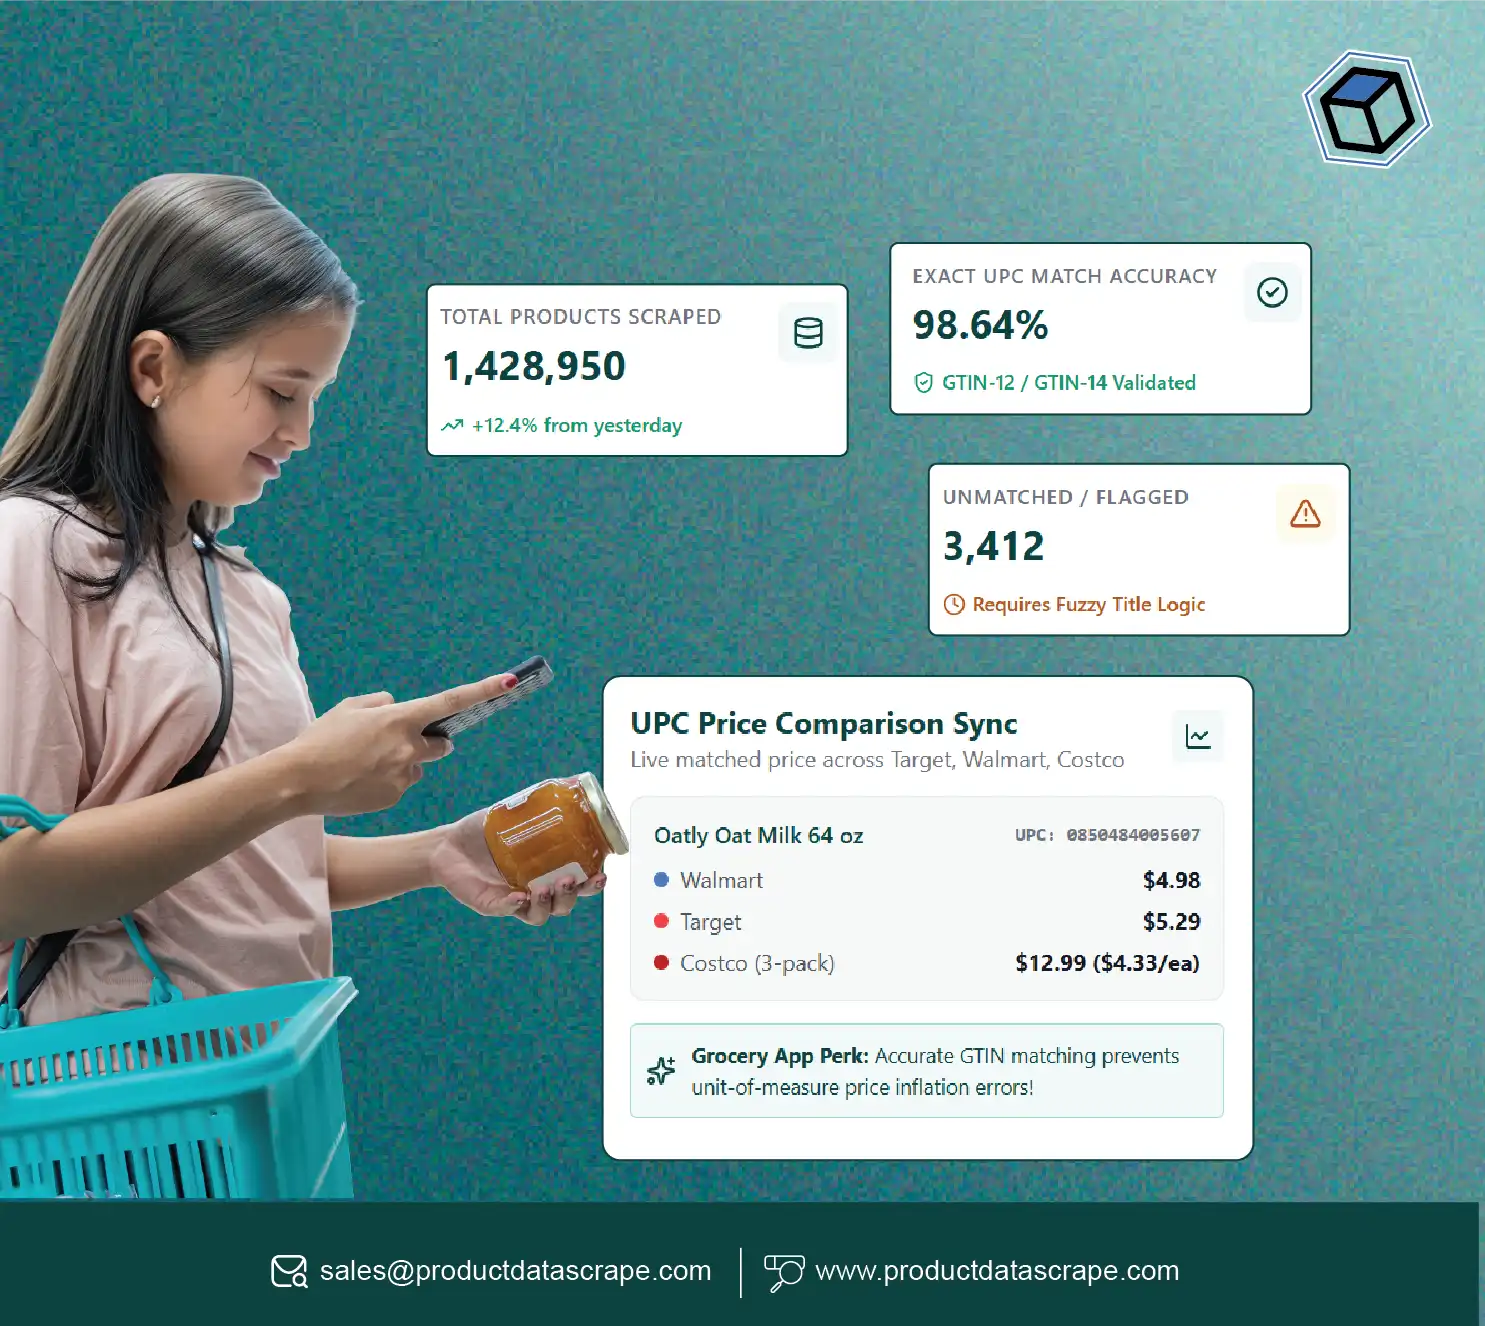
A sound process begins with a product-matching policy. Use identifiers such as GTINs or manufacturer part numbers where available and appropriate, supplemented by brand, model, variant, capacity, pack quantity, and other relevant attributes. Similar product names are not sufficient evidence of an exact match.
After matching, calculate changes using comparable observations. Keep shipping charges, taxes, coupons, membership pricing, and bundle conditions separate where the source makes them available. A lower headline price does not necessarily mean a lower final purchase cost.
How should teams prioritize alerts?
- High-priority changes: Significant movements in strategically important products, subject to validated matching.
- Availability changes: Listings that change between available and unavailable states.
- Data-quality warnings: Unexpected currency changes, missing values, or implausible price movements.
- Review-required records: Products whose identity or variant cannot be established confidently.
- Stale observations: Listings that have not been refreshed within the required interval.
Alert thresholds should reflect a retailer's product category, pricing policy, and commercial priorities. Avoid presenting arbitrary percentage thresholds as universal industry benchmarks.
How can historical data be interpreted?
The U.S. Census Bureau's quarterly series shows that unadjusted Q4 U.S. e-commerce sales rose from $251.5 billion in 2020 to $365.2 billion in 2025. The 2026 Q2 estimate was $329.5 billion. Because Q2 and Q4 represent different seasons, the 2026 value should not be interpreted as evidence of a full-year decline. Source: FRED, using U.S. Census Bureau data.
For retailers, the lesson is to compare like with like: the same product, comparable pricing conditions, consistent observation intervals, and equivalent seasonal periods where relevant. This approach makes price history more useful for planning promotions, reviewing market positioning, and investigating changes without confusing correlation with causation.
How Can Product Data Be Standardized Across Retailers?
A multi-retailer scraping API for product data can help consolidate product information from supported sources, while a Multi-site scraper for e-commerce stores can provide the collection layer for a broader catalog-monitoring workflow.
The main challenge is product identity. Retailers may use different titles, abbreviations, category structures, identifiers, and attribute formats for the same item. A dependable catalog process must reconcile these differences before comparing prices or analyzing assortment.
Start with a canonical product schema. Depending on the category, it may include brand, manufacturer part number, GTIN, model, color, size, dimensions, pack quantity, product category, and variant identifiers. Keep retailer-specific listing identifiers separately because they describe individual offers rather than necessarily identifying the underlying product.
Which data-cleaning steps matter most?
| Processing step |
Recommended approach |
| Identifier matching |
Compare available GTINs, manufacturer part numbers, and other reliable identifiers |
| Attribute normalization |
Standardize units, capitalization, and category values without losing original data |
| Variant validation |
Separate different sizes, colors, models, and bundle quantities |
| Price normalization |
Store numeric prices with explicit currency and pricing context |
| Duplicate detection |
Identify repeated listings without deleting legitimate variants |
| Confidence scoring |
Flag uncertain matches for review instead of forcing a match |
| Change history |
Preserve dated observations and the source of each change |
Product matching should use category-specific rules. For electronics, model numbers and specifications can be particularly useful. For clothing, size and color are often essential. For grocery products, package weight and quantity may determine whether two listings are comparable.
The system should preserve both the original source values and normalized fields. This lets analysts correct a matching rule later without losing the evidence behind previous reports.
How should success be measured?
Track match precision, the proportion of records with required attributes, duplicate rates, price-field accuracy, source coverage, and the age of the latest successful observation. Where possible, validate a sample against manually reviewed source listings.
Do not claim a universal accuracy percentage without a measured test set. A representative evaluation should cover different retailers, product categories, variants, promotional formats, and page structures. The result is a catalog that supports more defensible comparisons and more useful reporting.
What Is Required to Monitor Large Product Catalogs?
The ability to scrape product catalogs from 100+ e-commerce sites depends on the sources supported, permitted access, catalog size, refresh requirements, and the collection infrastructure. A Multi-site scraper for e-commerce stores should therefore be evaluated against actual coverage requirements rather than an unverified site-count claim.
Scaling from a few retailers to a large source portfolio introduces practical challenges. Each retailer may have different page structures, product identifiers, rate limits, and update patterns. Some sources may provide structured feeds or APIs, while others may require a separately approved collection method. A single parser or refresh schedule is unlikely to fit every source equally well.
A scalable architecture separates collection from processing and reporting. Collection jobs retrieve authorized observations; validation checks the returned fields; normalization maps the records to a common schema; matching associates listings with canonical products; and storage preserves the history used by dashboards and alerts.
Which operational controls support scale?
| Control |
Purpose |
| Source-specific configuration |
Accommodates differences between retailers |
| Job scheduling |
Controls refresh frequency and workload |
| Retry policies |
Handles temporary failures without creating uncontrolled traffic |
| Rate-limit management |
Respects source and provider restrictions |
| Schema validation |
Detects missing or changed fields |
| Monitoring and logs |
Makes failed jobs and stale data visible |
| Historical storage |
Supports trend analysis and auditability |
| Access governance |
Ensures collection remains within approved permissions |
The correct refresh interval depends on the use case. A retailer monitoring frequently changing offers may need a different schedule from a team updating a stable product reference catalog. More frequent collection also increases processing requirements and should be justified by the value of fresher data.
Before expanding coverage, test a representative group of sources and measure successful collection rates, field completeness, match accuracy, and processing time. Add sources incrementally and establish an owner for monitoring failures.
The Census Bureau's historical e-commerce releases illustrate the value of published periods, defined measures, and revision-aware reporting. Product intelligence systems benefit from similar discipline: every reported figure should have a source, an observation period, and a clear definition.
Why Choose Product Data Scrape?
E-commerce data scraping is most valuable when it produces consistent, traceable information that supports actual business decisions. A Multi-site scraper for e-commerce stores should be assessed on source coverage, data freshness, product matching, historical availability, and integration requirements—not just collection volume.
Product Data Scrape can be evaluated against your team's specific needs, including multi-retailer monitoring, product normalization, price-change analysis, and dashboard-ready data. Before deployment, request a representative sample, confirm source permissions, review field definitions, and test the accuracy of product matches. Clear reporting on missing data and failed collection jobs is equally important. These checks help procurement teams distinguish a dependable data workflow from a solution that simply returns large quantities of inconsistent records.
Conclusion
A Multi-site scraper for e-commerce stores can help retailers consolidate competitor observations, maintain product histories, and support more informed pricing decisions. The strongest results come from combining permitted source access with accurate product matching, transparent timestamps, reliable validation, and a dashboard that makes uncertainty visible.
For businesses managing multiple brands or retailer relationships, Catalog Enrichment Services can complement price monitoring by standardizing product attributes and improving catalog consistency. Define the products and sources that matter, test data quality against real listings, and expand coverage only when the workflow meets measurable requirements.
Ready to improve product visibility and competitor monitoring? Contact Product Data Scrape to discuss your catalog, pricing intelligence, and dashboard requirements. Get started today and turn structured product data into actionable business insights!
Frequently Asked Questions
1. What is a multi-site scraper for e-commerce stores?
It collects permitted product information from multiple online retailers, helping businesses consolidate listings, prices, availability, and product attributes into a structured dataset for analysis and monitoring.
2. How does daily price tracking help retailers?
Daily price tracking records scheduled price observations, enabling teams to compare changes over time, review competitor offers, and investigate pricing differences using validated, comparable product listings.
3. Can a dashboard monitor prices across multiple retailers?
Yes. A dashboard can consolidate timestamped observations, price changes, availability, and collection status, provided the underlying sources supply those fields and the records are validated.
4. What should businesses verify before scraping product catalogs?
Confirm source permissions, supported domains, refresh frequency, data accuracy, and product-matching rules. Check applicable terms and access restrictions before automating collection at scale.
5. How can Product Data Scrape support product intelligence?
Product Data Scrape can be assessed for catalog monitoring and normalization requirements. Buyers should verify available sources, field coverage, freshness, and sample accuracy before selecting a solution.


 Singapore
 EMAIL
 PHONE










.webp)