Introduction
Weekly circular promotion scraping helps grocery retailers monitor competitors' advertised prices, compare discounts, identify promotional patterns, and make better-informed pricing decisions. For US grocery chains competing on value, timely circular data provides a structured view of how rivals promote products across categories, locations, and shopping periods.
Weekly Circular Promotion Scraping turns publicly available weekly advertisements and promotional listings into organized data that pricing, merchandising, and category-management teams can analyze. Instead of manually reviewing multiple circulars, businesses can compare advertised prices, offer dates, product sizes, discount conditions, and featured brands in a consistent format. This supports more responsive Promotion and deal intelligence, helping teams evaluate whether their offers remain competitive while protecting margins.
The business challenge is not simply finding the lowest advertised price. Retailers must compare equivalent products, distinguish regular prices from promotional prices, account for loyalty-card conditions, and recognize when offers apply only to selected locations. A reliable workflow also needs to capture changes over time and flag incomplete or inconsistent listings.
For grocery chains, data quality matters as much as collection frequency. Verified source URLs, timestamps, product identifiers, and clear promotion terms make competitor analysis more useful and auditable.
How can retailers organize competitor circulars into comparable data?
US grocery retailers publish weekly advertisements through websites, digital circulars, apps, and location-specific promotional pages. These formats can vary by retailer and region, making manual comparison time-consuming. A structured collection process helps convert the information into consistent fields that analysts can compare across competing stores.
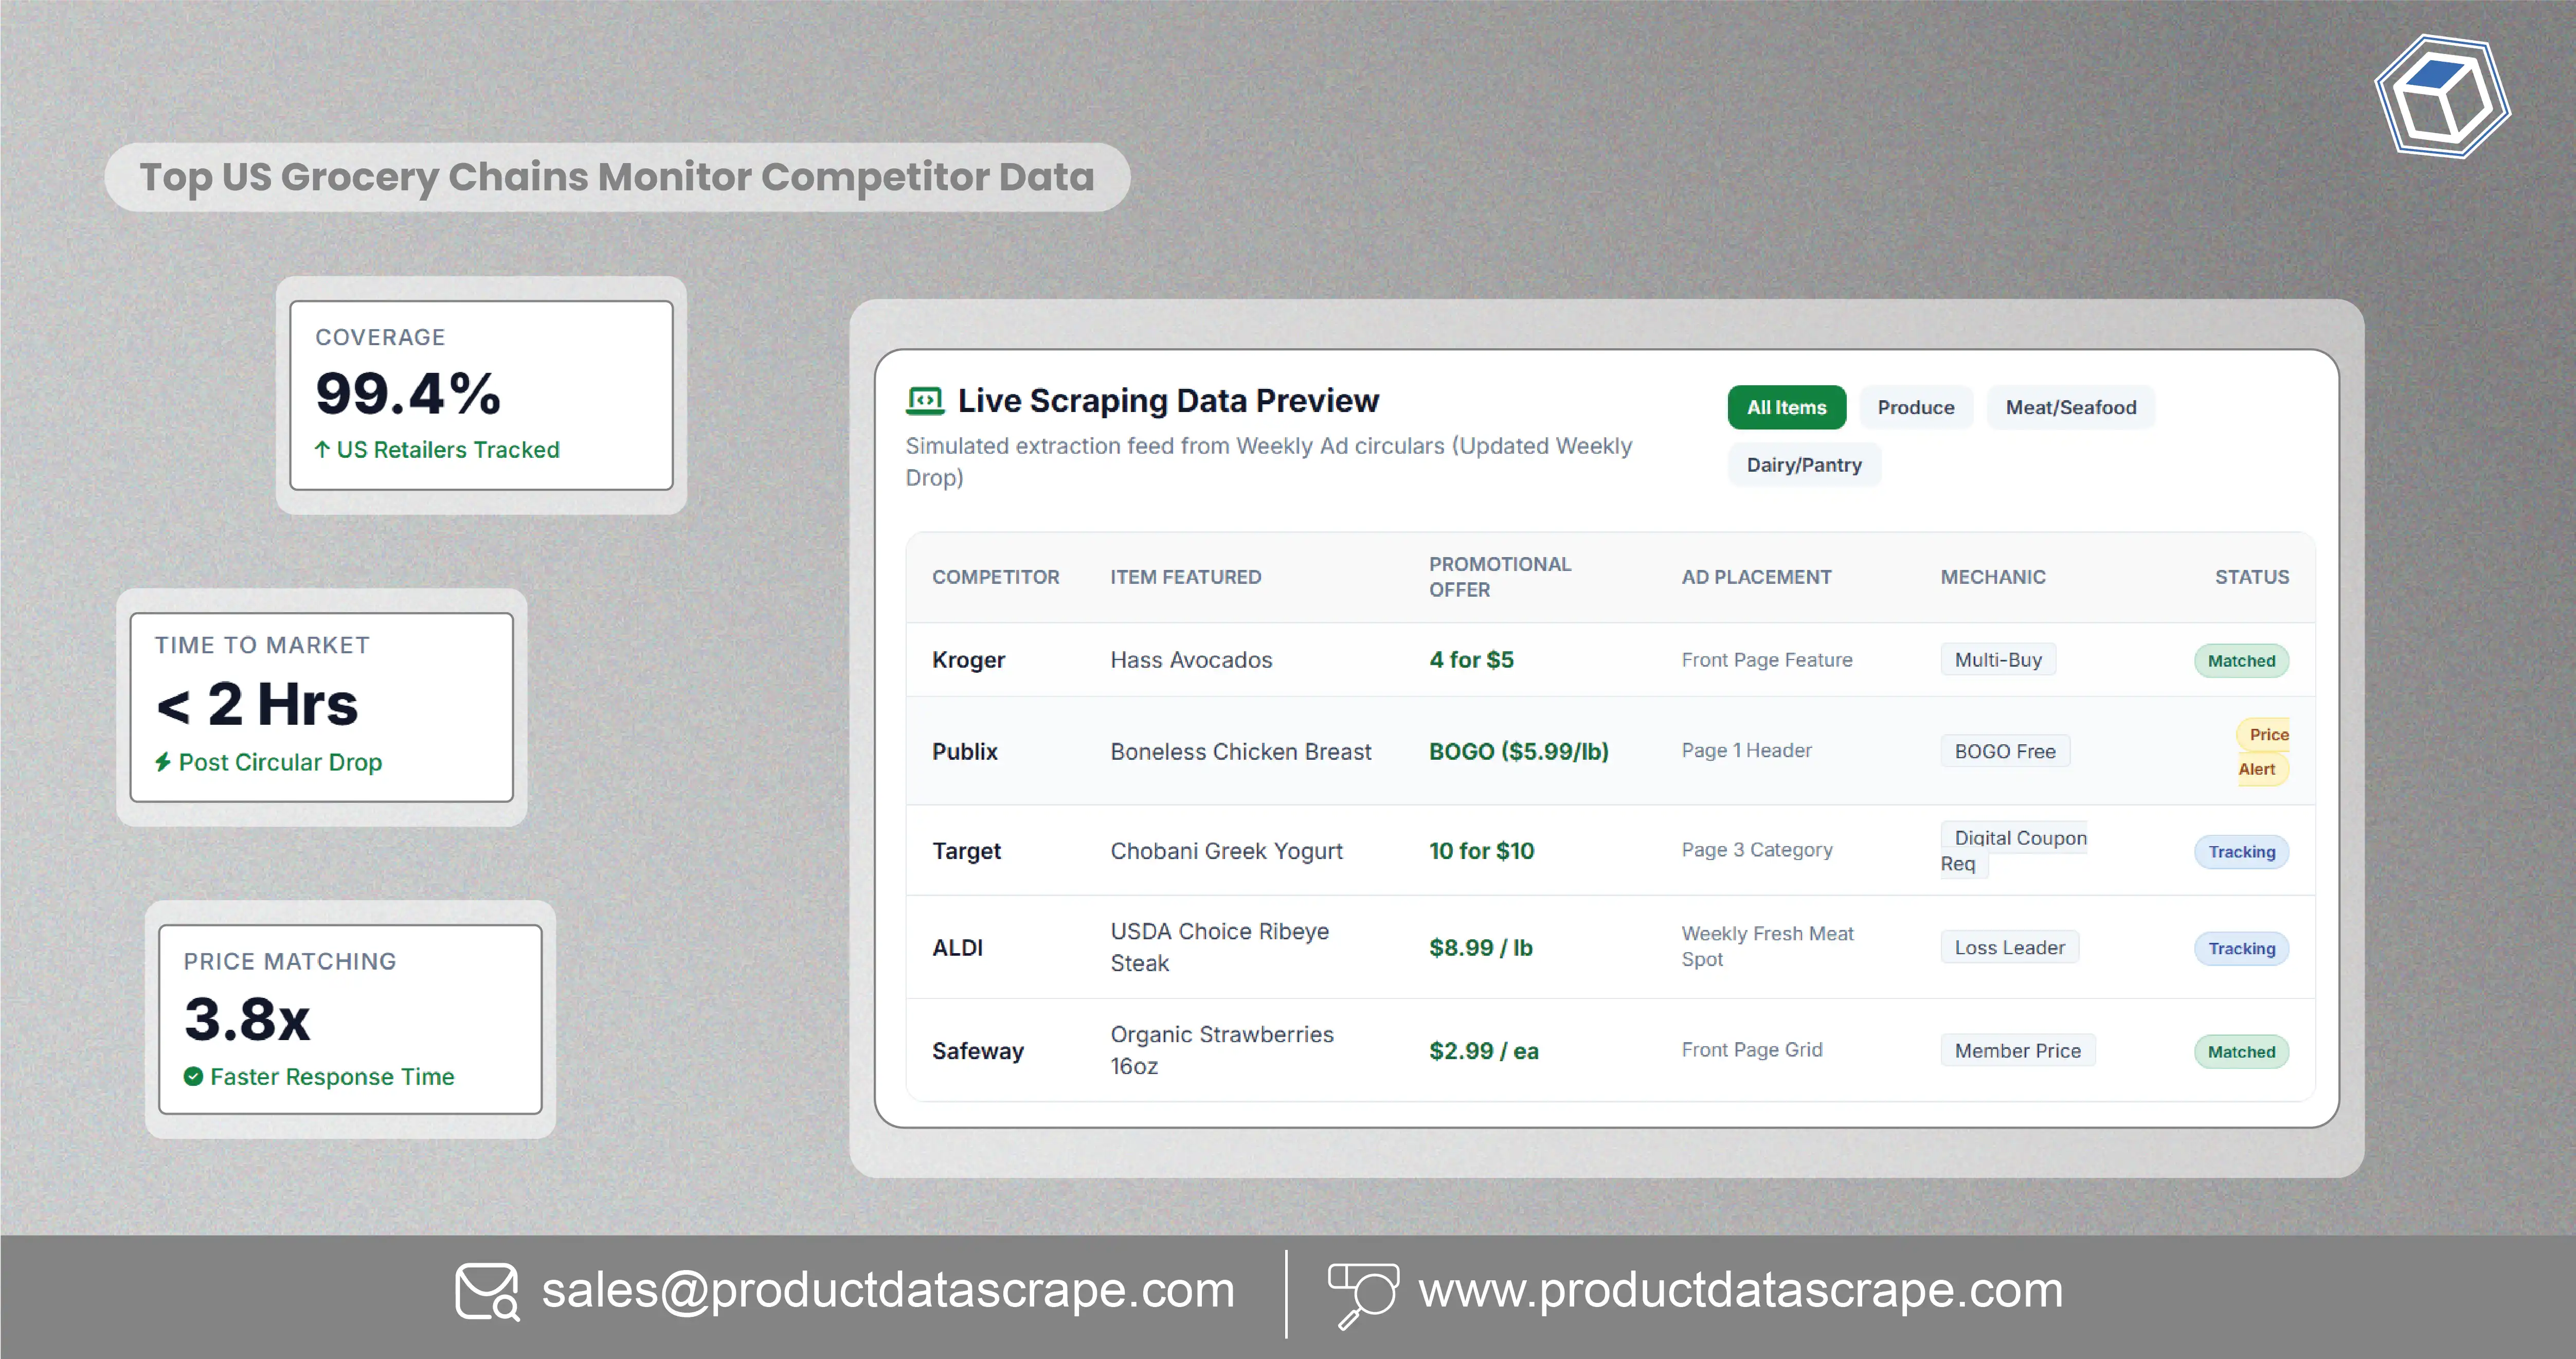
Using scrape weekly circulars Promotions from US grocery chains as a workflow means capturing details such as retailer, store or ZIP code where available, product name, brand, package size, advertised price, discount, offer dates, and eligibility requirements. Grocery data scraping can then organize those records into a searchable dataset for pricing and merchandising teams.
The wider economic context makes this work valuable. The USDA Economic Research Service reports that food-at-home prices rose 3.5% in 2020 and 2021, increased 11.4% in 2022, then rose 5.0% in 2023, 1.2% in 2024, and 2.3% in 2025. Its September 2026 outlook forecasts a 2.4% increase for 2026. These figures describe national grocery-price inflation—not the prices of any individual retailer or circular. They show why teams need to distinguish market-wide movements from specific competitor promotions. USDA ERS Food Price Outlook
| Year |
US food-at-home price change |
Data status |
| 2020 |
+3.5% |
Historical |
| 2021 |
+3.5% |
Historical |
| 2022 |
+11.4% |
Historical |
| 2023 |
+5.0% |
Historical |
| 2024 |
+1.2% |
Historical |
| 2025 |
+2.3% |
Historical |
| 2026 |
+2.4% |
USDA forecast, September 2026 |
How to use the data: Treat national inflation as context, not a substitute for store-level observations. Match comparable products and package sizes, preserve promotion conditions, and timestamp each collection. This helps analysts separate genuine competitive price changes from differences in product size, geography, or offer eligibility.
How can retailers compare advertised offers across major chains?
Walmart, Kroger, and Target provide shoppers with different combinations of advertised prices, weekly offers, digital deals, and retailer-specific conditions. A useful comparison process must normalize the information rather than assume that similarly named products are equivalent. Product size, unit price, brand, offer period, and loyalty requirements can all affect whether two promotions are genuinely comparable.
A workflow designed to track sale prices across Walmart, Kroger and Target should record the displayed offer and its conditions alongside the product details. The keyword Weekly Circular Promotion Scraping describes the collection approach; it does not mean every price or offer is identical across markets. Retailer advertisements and availability can vary by store and ZIP code.
For example, an analyst comparing a multipack of paper towels should check sheet count and roll size, not just the headline price. For groceries sold by weight, unit prices can provide a more meaningful basis for comparison than package prices alone. Loyalty-only prices should remain separate from offers available to every shopper.
| Comparison field |
Why it matters |
Recommended treatment |
| Product and brand |
Avoids matching unrelated items |
Use product identifiers where available |
| Package size |
Prevents misleading comparisons |
Capture count, weight, and volume |
| Advertised price |
Shows the displayed offer |
Preserve currency and price format |
| Unit price |
Improves value comparisons |
Normalize to a common unit |
| Offer dates |
Establishes validity |
Record start and end dates when shown |
| Eligibility |
Identifies restrictions |
Flag loyalty-card or digital-coupon terms |
| Location |
Explains regional differences |
Store ZIP or location ID where available |
Retailer-owned pages are the preferred source for verifying an advertised offer: Walmart, Kroger, and Target. Their public pages and offers may change, so captured records should retain a source URL and collection timestamp. The practical outcome is a more reliable comparison process that supports pricing reviews without overstating what the data proves.
How can grocery teams identify weekly price changes over time?
A single circular shows what a retailer advertised during one period. A time series shows how that offer changes across consecutive periods. By storing weekly records consistently, grocery teams can identify repeated discounts, changing promotion frequency, short-term price movements, and shifts in which products receive promotional attention.
To track weekly price changes at supermarkets, analysts should maintain a history rather than overwrite old observations. Each record should include the collection date, advertised price, unit price where calculable, product match confidence, promotion dates, and conditions. A change-detection process can then flag records that differ from the previous observation. Human review is important when the product description, package size, or offer terms have changed.
National inflation data provides context for interpreting these trends. USDA ERS recorded a sharp 11.4% rise in food-at-home prices in 2022, followed by slower annual increases in 2023 and 2024. Its September 2026 forecast places the 2026 annual increase at 2.4%. These are national annual averages and forecasts, not weekly supermarket price measurements. Source: USDA ERS
| Year |
Food-at-home price change |
Possible analytical use |
| 2020 |
+3.5% |
Establish a pre-peak comparison point |
| 2021 |
+3.5% |
Compare ongoing price pressure |
| 2022 |
+11.4% |
Contextualize unusually strong inflation |
| 2023 |
+5.0% |
Review easing annual inflation |
| 2024 |
+1.2% |
Compare a slower-growth year |
| 2025 |
+2.3% |
Track renewed but moderate growth |
| 2026 |
+2.4% forecast |
Use as a forecast, not a final result |
Actionable insight: Build alerts around meaningful changes, not every data difference. A price alert should trigger only after checking product equivalence, location, offer dates, and eligibility. This reduces false positives and helps category managers focus on changes that may require a response.
What should a US-focused collection service capture?
A grocery promotion is useful to competitor analysis only when its context is preserved. An offer may apply to selected stores, require a loyalty account, depend on a digital coupon, or remain available for a limited period. A collection workflow that captures only the product name and headline price can miss these conditions and produce misleading comparisons.
A grocery promotion scraping service in the US should prioritize publicly available retailer information and preserve the context needed for verification. Weekly Circular Promotion Scraping can support this workflow by collecting the offer details that retailers display, then organizing them for review. Collection frequency should reflect how often the source changes and how quickly the business needs to act; it should not be assumed that every retailer publishes new offers on the same schedule.
| Data field |
Validation check |
Business value |
| Retailer and location |
Confirm the source and market |
Supports regional comparisons |
| Product title and brand |
Check for duplicate or ambiguous matches |
Improves product matching |
| Size and quantity |
Confirm units and pack counts |
Enables fair comparisons |
| Sale price |
Check currency and displayed format |
Supports offer analysis |
| Regular price, if shown |
Preserve the retailer's displayed value |
Helps calculate advertised savings |
| Coupon or membership terms |
Capture restrictions and eligibility |
Avoids overstating deal accessibility |
| Offer period |
Store dates as displayed |
Helps identify expired promotions |
| Source URL and timestamp |
Retain collection evidence |
Supports auditing and troubleshooting |
The FTC's work on pricing transparency and consumer data practices reinforces the importance of responsible data handling. Its 2024 inquiry into surveillance-pricing providers examined how personal information may be used in pricing systems; it was not a finding that all retailer price monitoring is improper. See the FTC's announcement.
For grocery analysts, the practical rule is straightforward: use relevant public offer information, respect access restrictions and website terms, avoid collecting unnecessary personal data, and retain enough source context to verify every comparison.
How can weekly circular analysis support grocery-chain decisions?
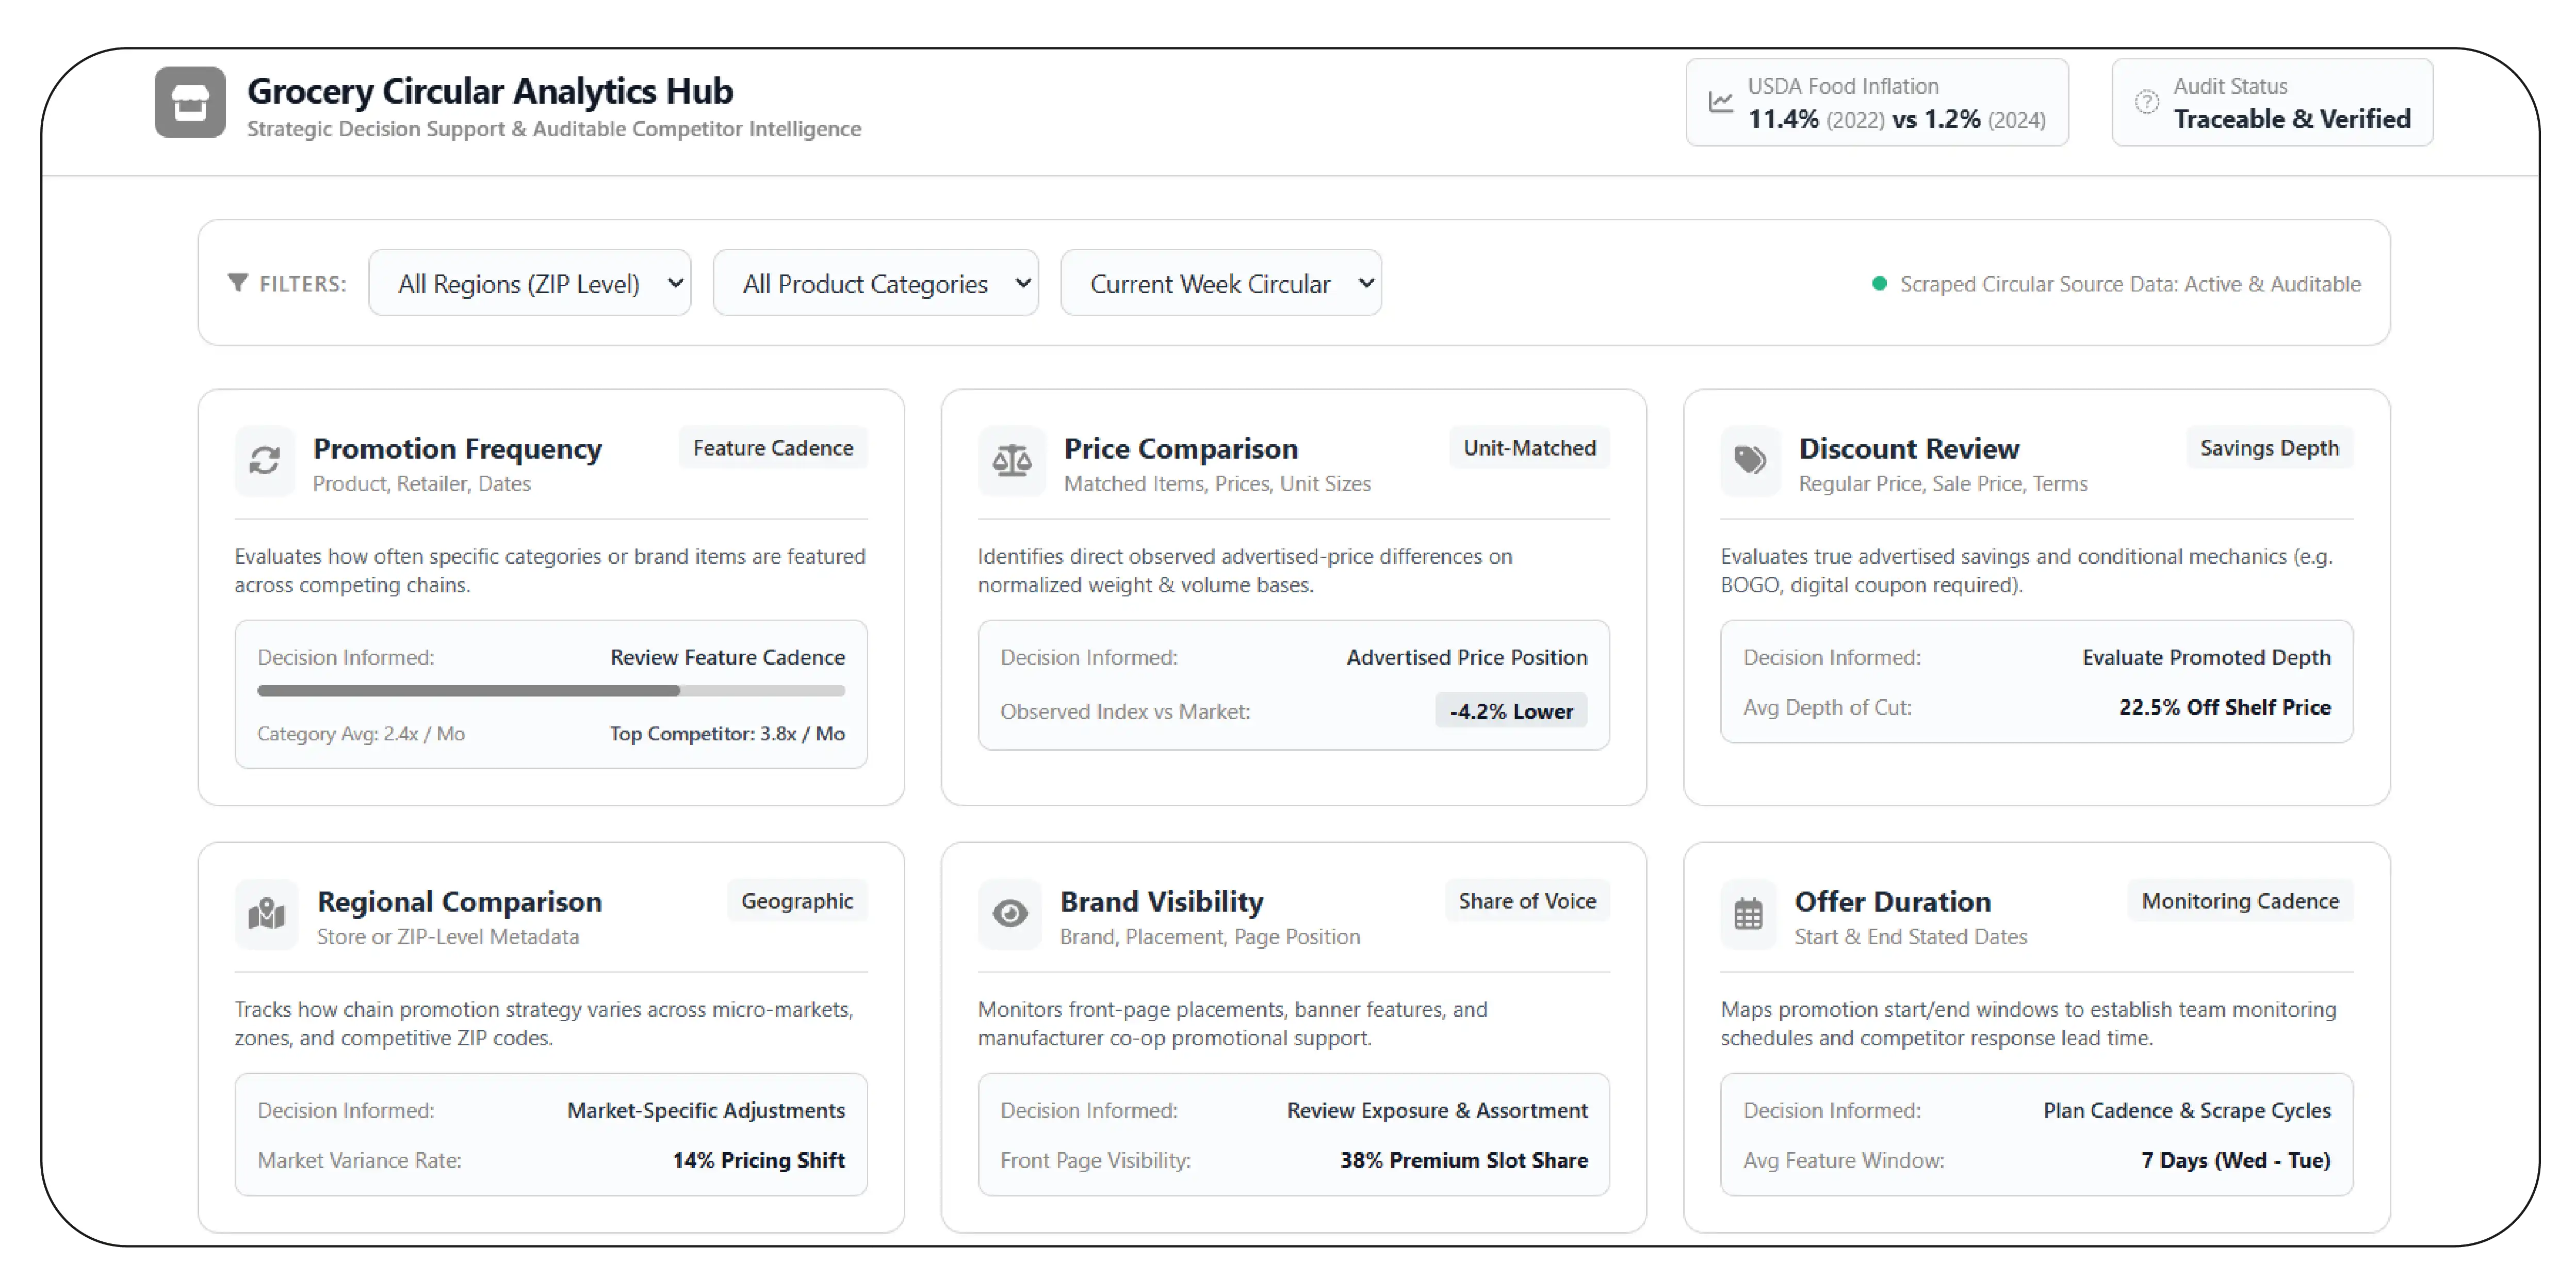
A structured dataset becomes valuable when teams can use it to answer business questions. Retail pricing managers may want to know which competitors discount a product category most frequently, whether a featured item remains competitively priced, or how often a retailer advertises a particular brand. Merchandising teams may use the same information to review assortment visibility and promotional timing.
Weekly circular promotion scraping for US grocery chains can help teams organize these questions into repeatable reports. The analysis should separate observed facts—such as an advertised price or stated offer period—from interpretations, such as whether a promotion appears aggressive compared with similar products. Those interpretations depend on product matching, store coverage, and the completeness of the source data.
The following reporting framework is based on the fields needed to conduct an auditable comparison; it does not claim measured outcomes for any named retailer.
| Analysis |
Required data |
Decision it can inform |
| Promotion frequency |
Product, retailer, dates |
Review how often items are featured |
| Price comparison |
Matched products, prices, unit sizes |
Identify observed advertised-price differences |
| Discount review |
Regular price when shown, sale price, terms |
Evaluate the advertised saving |
| Regional comparison |
Store or ZIP-level source information |
Identify differences across markets |
| Brand visibility |
Brand, product, circular appearance |
Review promotional exposure |
| Offer duration |
Start and end dates where shown |
Plan monitoring and reporting cadence |
USDA's food-price series also helps teams interpret the broader market. Food-at-home inflation was 11.4% in 2022 and 1.2% in 2024, illustrating how national conditions can vary from year to year. However, national CPI data cannot establish why one chain chose a specific offer. Retailer circular records are needed to examine the offers themselves. USDA ERS historical data and outlook
The most useful output is not a list of scraped prices. It is a traceable comparison that allows teams to verify product equivalence, understand offer restrictions, identify patterns, and decide which differences merit further investigation.
What role do data APIs play in promotion monitoring?
Retailers and data teams need consistent ways to move information from public source pages into internal analytics systems. Where an authorized API or structured data feed is available, it may offer a more stable integration route than extracting information from changing page layouts. When collection relies on public webpages, the process should be designed around the source's permitted access methods and technical restrictions.
U.S. Grocery Chains Use Data Scraping APIs as part of broader data workflows when they need structured records that can feed dashboards, reporting tools, or internal databases. The phrase describes a possible approach, not a claim that every major chain uses the same technology or makes a dedicated circular API publicly available. Weekly Circular Promotion Scraping can be one component of this workflow, provided the collection method is permitted and the source information is accurately represented.
A dependable pipeline typically includes:
- Source selection: Identify official public circulars, offer pages, or approved feeds.
- Collection: Retrieve available data at a cadence suited to the source and business need.
- Normalization: Standardize prices, units, dates, retailer names, and product attributes.
- Validation: Flag missing fields, duplicates, expired offers, and uncertain product matches.
- Storage: Retain historical records with source URLs and timestamps.
- Analysis: Produce competitor comparisons, promotion histories, and exception reports.
- Review: Check unusual results before using them in pricing or merchandising decisions.
The USDA's Food Price Outlook demonstrates why it is important to distinguish observed data from forecasts: the agency publishes historical price changes and model-based projections separately. Grocery promotion dashboards should apply the same discipline by labeling actual advertised offers, calculated metrics, and analyst interpretations distinctly. USDA ERS methodology and data
For decision-makers, the key success measures are data freshness, product-match accuracy, source coverage, and the ability to reproduce a comparison—not simply the volume of collected records. Teams should verify access permissions, applicable terms, and data-quality controls before operationalizing a collection pipeline.
Why Choose Product Data Scrape?
Retail teams need competitor data that is organized, verifiable, and useful for day-to-day decisions. A practical monitoring workflow should preserve source links, collection timestamps, offer conditions, and product attributes so analysts can investigate differences rather than rely on unexplained price figures.
AI-Powered Shelf Analytics can complement promotion monitoring by helping teams organize product information, identify unusual changes, and prioritize records for review. Any automated match or alert should remain subject to quality checks, particularly when package sizes, descriptions, or promotional conditions differ. Automation should assist analysts, not turn uncertain matches into unquestioned facts.
A well-designed process can help grocery businesses maintain historical comparisons, reduce repetitive manual review, and build reports around the categories and markets that matter most. Data coverage and accuracy should be measured against the actual sources available, with limitations documented clearly.
Weekly Circular Promotion Scraping is most effective when supported by consistent collection rules, transparent validation, and reporting aligned with pricing and merchandising goals. This approach gives teams a stronger foundation for making evidence-based decisions without confusing national price trends with individual retailer offers.
Conclusion
Competitor circulars provide a useful view of advertised grocery deals, but their value depends on accurate collection and fair comparison. By tracking product details, sale prices, offer dates, location differences, and eligibility terms, retailers can build a clearer picture of how competitors promote their products. National inflation figures add market context, while verified circular records show the specific offers being advertised. A consistent workflow helps teams identify patterns, investigate price differences, and support better-informed pricing and merchandising reviews.
Use a US Grocery Price Inflation Tracker alongside verified promotional records to separate broad market movements from retailer-specific offers.
Contact Product Data Scrape to discuss a tailored grocery promotion monitoring workflow, source coverage, and data-quality requirements for your business!
Frequently Asked Questions
1. What is weekly circular promotion monitoring?
It is the structured collection and comparison of publicly available grocery advertisements, including product prices, discounts, offer dates, locations, and restrictions, to help retailers evaluate competitor promotions.
2. Can circular data compare prices across different grocery chains?
Yes. Comparisons are more reliable when products, package sizes, unit prices, locations, and coupon conditions are matched consistently and the original source is retained for verification.
3. How often should grocery promotion data be collected?
Collection frequency should reflect source update schedules and business needs. Teams should validate offer dates and source changes rather than assume every retailer updates its circular at identical intervals.
4. What data fields are most important for promotion analysis?
Retailer, product name, brand, package size, advertised price, offer dates, location, eligibility conditions, source URL, and collection timestamp are key fields for dependable comparison and auditing.
5. How can Product Data Scrape support grocery retailers?
Product Data Scrape can be approached for a discussion of collection scope, source coverage, data structure, and validation needs. Specific capabilities and coverage should be confirmed before engagement.


 Singapore
 EMAIL
 PHONE










.webp)