Introduction
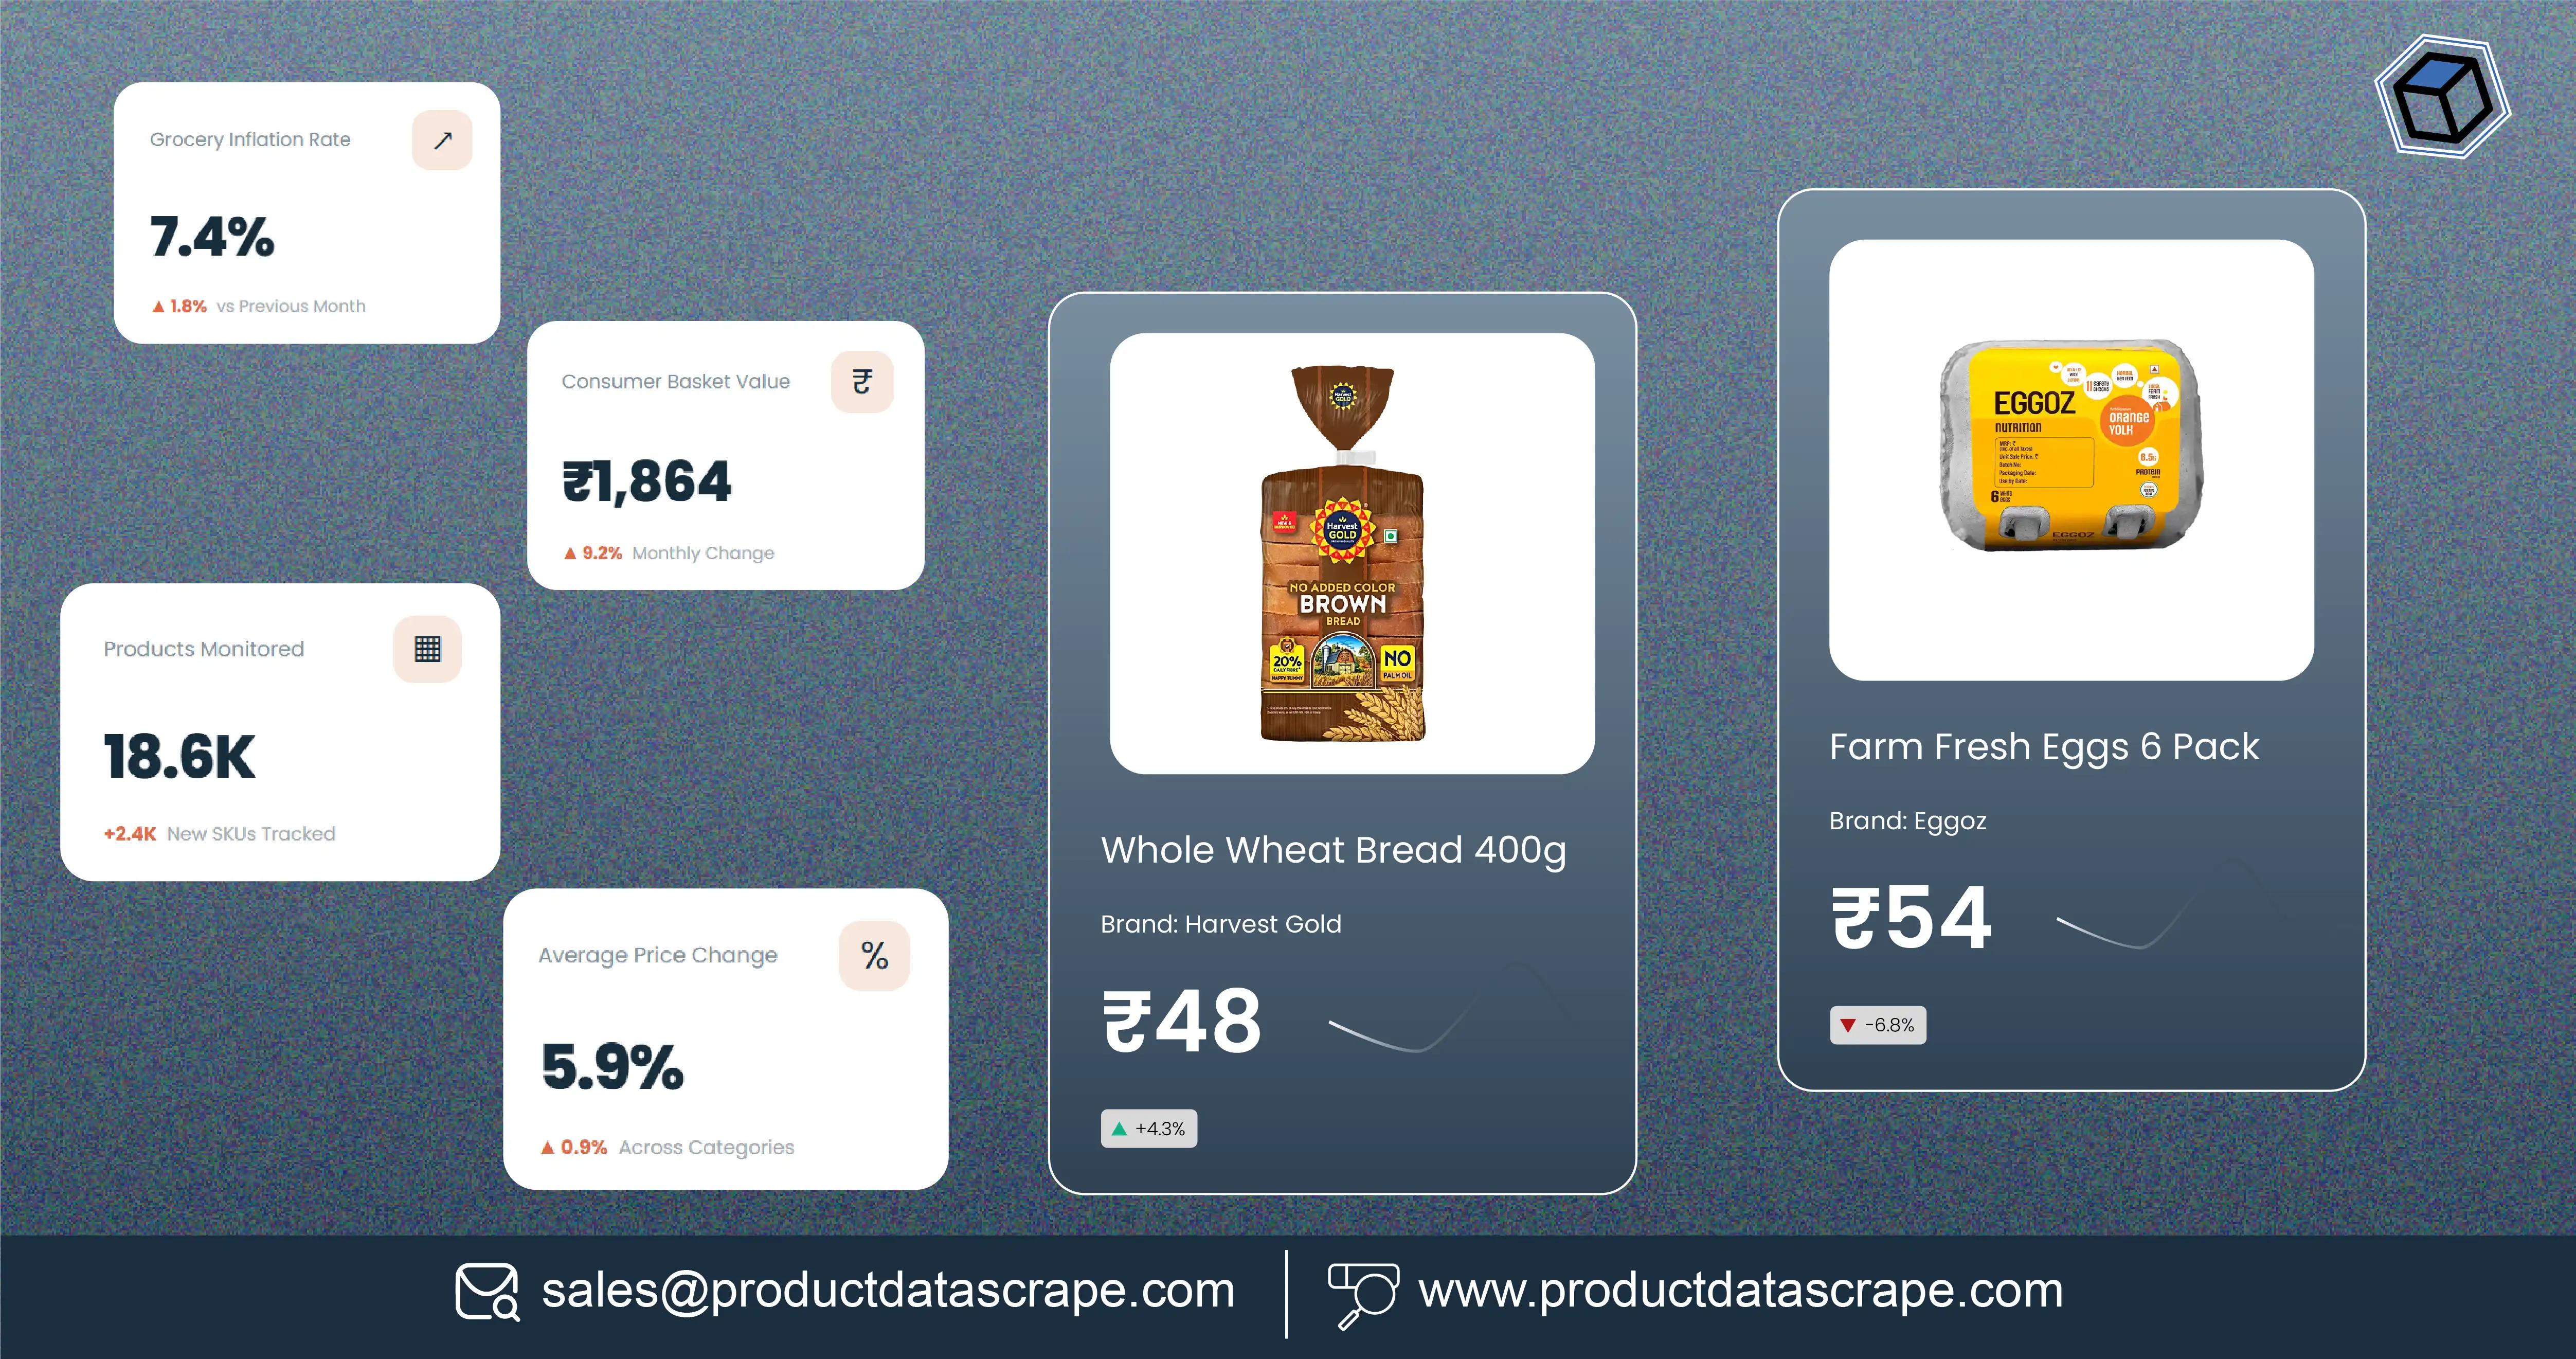
Retailers can turn changing grocery prices into actionable decisions by continuously collecting product-level prices, promotions, pack sizes, availability, and competitor data. Grocery Inflation Tracking Data helps businesses identify where prices are rising, which categories are most exposed, and how competitors are responding. This matters because inflation does not affect every product equally. In India, the World Bank reports headline consumer inflation of 6.6% in 2020, 5.1% in 2021, 6.7% in 2022, 5.6% in 2023, 5.0% in 2024, and 2.4% in 2025.
For retailers, however, headline inflation alone is not enough. inflation-driven cost pressures can appear differently across rice, edible oils, dairy, packaged foods, beverages, snacks, and household essentials. Product-level monitoring reveals these differences and enables businesses to compare prices across stores, locations, competitors, and time periods.
The opportunity is to connect macroeconomic signals with granular marketplace observations. Product Data Scrape can support this process by converting publicly visible grocery listings into structured datasets that can be analyzed for pricing, promotions, assortment, and competitive movement.
How Are Grocery Prices Changing Across Categories and Years?
Grocery prices have moved through several distinct inflation cycles since 2020. The global food consumer price inflation rate increased from 3.5% in 2021 to 10.1% in 2022 before easing to 8.3% in 2023 and 3.3% in 2024, according to FAO data.
For retailers, this creates a need to distinguish temporary price shocks from sustained category-level movements. A price-tracking system can compare identical SKUs over time while accounting for promotions, pack-size changes, retailer differences, and availability.
The combination of Grocery Price Trends and Inflation Insights with Grocery Store Deal Matching Data Scraping enables retailers to compare regular prices against promotional prices and understand whether apparent savings are consistent across competitors.
| Year |
Global food inflation trend |
Retail implication |
| 2020 |
Pandemic disruption |
Monitor supply and availability |
| 2021 |
3.5% food inflation |
Rising pressure begins |
| 2022 |
10.1% |
Major price volatility |
| 2023 |
8.3% |
Inflation remains elevated |
| 2024 |
3.3% |
Broad easing |
| 2025 |
~3.4% globally |
Stabilization with category variation |
| 2026 |
Ongoing monitoring |
Detect new movements early |
FAO's latest update puts global food consumer inflation at approximately 3.4% in 2025.
A useful dataset should therefore capture product name, brand, SKU, listed price, MRP, discount, pack size, unit price, timestamp, retailer, location, and availability. Retail teams can then calculate weekly and monthly changes instead of relying only on broad inflation indicators.
Why Does Price Intelligence Matter for FMCG Brands?
FMCG brands operate in markets where retailers can change prices frequently and consumers can compare competing products within seconds. A manufacturer may know its recommended retail price, but that does not necessarily represent the price consumers actually encounter online.
Grocery Price Intelligence for FMCG Brands gives manufacturers a more detailed view of market execution. By monitoring competing SKUs, brands can identify discounting intensity, price gaps, promotional frequency, and changes in pack-size economics.
This becomes particularly valuable during inflationary periods. A brand may maintain a stable sticker price while reducing pack quantity, while another competitor may increase price but offer deeper promotions. Looking only at the displayed price can therefore produce misleading conclusions.
| Intelligence metric |
FMCG application |
| Average selling price |
Track market movement |
| Price gap |
Benchmark competitors |
| Discount depth |
Measure promotion intensity |
| Pack-size change |
Detect value changes |
| Unit price |
Compare equivalent products |
| Availability |
Identify distribution issues |
The FAO reported that global food inflation reached 13% in 2023 before declining to 3.1% in 2024 and around 3.4% in 2025. These changes demonstrate why brands need continuous rather than occasional monitoring.
For FMCG teams, the practical objective is not simply to collect prices. It is to understand whether price changes are market-wide, competitor-specific, promotion-led, location-specific, or connected to changes in product configuration.
What Should a Grocery Retail Pricing Dataset Contain?
A reliable dataset should connect every observed price with enough context to explain why that price exists. Grocery Retail Pricing Trends Dataset development should therefore go beyond collecting product names and prices.
A useful structure combines historical price observations with product attributes, retailer information, promotion details, and timestamps. This allows analysts to distinguish genuine inflation from temporary discounts or assortment changes.
| Dataset field |
Why it matters |
| Product/SKU ID |
Maintains product identity |
| Brand |
Enables competitive analysis |
| Category |
Supports category-level trends |
| Pack size |
Prevents misleading comparisons |
| Listed price |
Measures observed selling price |
| MRP |
Measures discount positioning |
| Unit price |
Enables normalized comparison |
| Promotion |
Separates deals from regular prices |
| Availability |
Identifies supply-related effects |
| Retailer |
Enables competitor benchmarking |
| Location/pincode |
Captures geographic variation |
| Timestamp |
Builds historical trends |
From 2020 through 2022, global food inflation accelerated sharply, while the following years brought substantial moderation. That historical pattern shows why a dataset should preserve observations instead of overwriting old prices.
For example, a retailer could calculate the median price of a one-kilogram product every month and compare it with the same period a year earlier. Analysts can also calculate promotional frequency, average discount, price dispersion, and SKU-level volatility.
The strongest datasets are therefore designed for repeated analysis. They allow pricing teams to move from "What is today's price?" to "How has this product's effective market price changed, and what caused the movement?"
How Can an API Make Continuous Price Monitoring Easier?
Manual price checks become inefficient when retailers need to monitor thousands of SKUs across multiple websites and locations. Grocery Price Trend Monitoring API workflows can automate the collection of structured observations at defined intervals.
An automated pipeline can capture product information, pricing, discounts, availability, and other attributes, then store each observation with a timestamp. Analysts can subsequently calculate daily, weekly, or monthly movements.
| Monitoring stage |
Output |
| Product discovery |
Current SKU catalogue |
| Data collection |
Fresh product observations |
| Normalization |
Comparable product records |
| Historical storage |
Time-series dataset |
| Change detection |
Price movement alerts |
| Analytics |
Inflation and competitor insights |
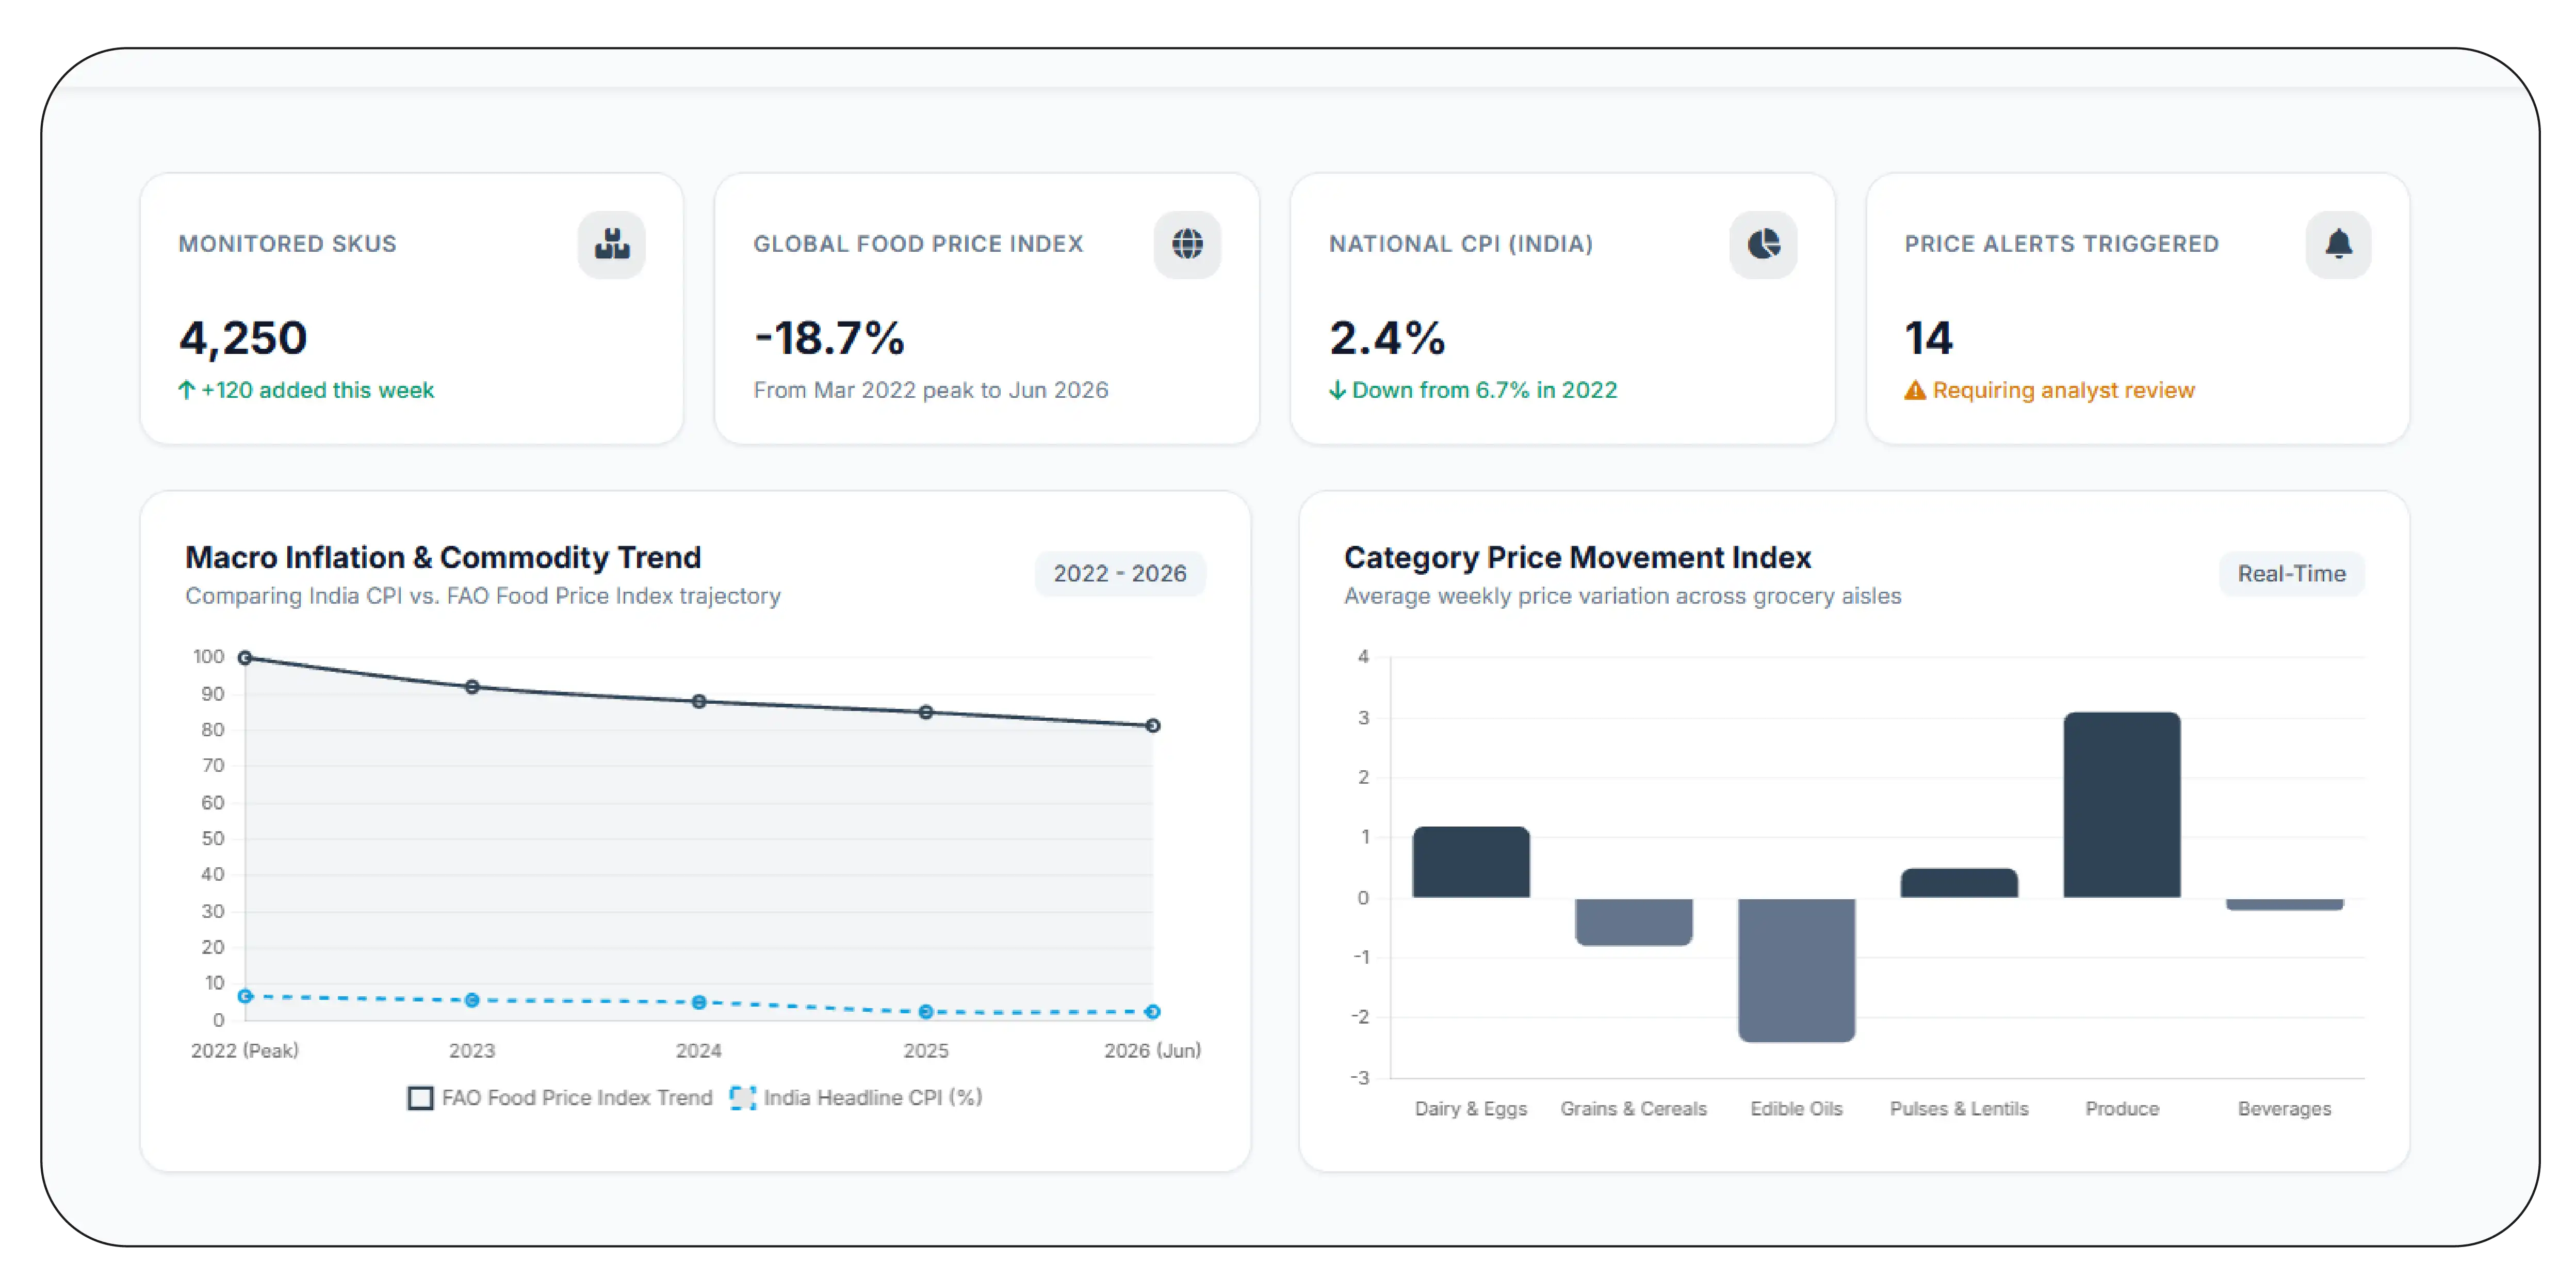
The business case is especially strong when market conditions change quickly. FAO reported that its global Food Price Index reached a peak in March 2022 and remained 18.7% below that peak by June 2026, showing how dramatically food commodity conditions can change over several years.
At the national level, India also experienced changing inflation conditions. The World Bank's headline CPI series shows inflation declining from 6.7% in 2022 to 5.6% in 2023, 5.0% in 2024, and 2.4% in 2025.
An API-based approach lets businesses respond to these changing environments without depending entirely on periodic manual research. It can feed dashboards, pricing models, competitive intelligence systems, and internal alerts.
The key requirement is consistency: the same products, fields, locations, and collection logic should be monitored over time.
Can Grocery Data Improve Inflation Forecasting?
Yes. Historical grocery observations can strengthen forecasting by revealing product-level signals that broad inflation statistics may not capture quickly enough. Grocery Market Data for Inflation Forecasting can combine observed retail prices with category, location, promotion, availability, and pack-size information.
The goal is not to replace official inflation statistics. Instead, granular retail data can provide additional market signals for businesses planning purchasing, inventory, pricing, and promotions.
| Forecasting signal |
Potential business use |
| SKU price velocity |
Identify accelerating increases |
| Category inflation |
Prioritize exposed categories |
| Price dispersion |
Detect regional differences |
| Promotion frequency |
Estimate effective prices |
| Stock availability |
Identify supply pressure |
| Pack-size changes |
Measure hidden value changes |
| Competitor movements |
Anticipate market responses |
Official statistics remain essential. India's January 2026 Consumer Food Price Index inflation was 2.13% year over year, according to India's Ministry of Statistics and Programme Implementation. Meanwhile, FAO reported that global food prices in 2025 averaged 4.3% higher than in 2024 on its Food Price Index.
These figures illustrate an important point: national consumer inflation, global commodity prices, and individual grocery prices do not move identically.
Retailers can use product-level observations to build category-specific indicators and detect emerging movements. For instance, if prices for several brands within a category rise simultaneously across multiple retailers, the signal may be stronger than an isolated SKU increase.
Combining historical data with external inflation indicators can therefore improve scenario planning and help businesses prepare for changing purchasing costs and consumer price sensitivity.
How Can Indian Grocery Data Reveal Local Inflation Differences?
India's grocery market is highly diverse, making geographic price monitoring particularly valuable. Scrape India Grocery datasets can compare product prices across cities, retailers, marketplaces, and pincodes while preserving the local context of each observation.
This matters because two consumers can encounter different prices for the same product based on location, retailer, promotion, delivery economics, or availability. A national average can hide these differences.
| Geographic signal |
Retail application |
| City-level price |
Regional benchmarking |
| Pincode-level price |
Local pricing analysis |
| Retailer-level price |
Competitive comparison |
| SKU availability |
Supply monitoring |
| Discount by location |
Promotion analysis |
| Unit price |
Fair product comparison |
The need for granular monitoring is supported by India's changing inflation environment. Headline CPI inflation was 6.6% in 2020, reached 6.7% in 2022, and fell to 2.4% in 2025 according to World Bank data. Yet a national number cannot show whether a specific grocery category is experiencing greater pressure in one market than another.
A strong Grocery Inflation Tracking Data workflow should therefore preserve location, timestamp, SKU, pack size, retailer, listed price, discount, and availability.
For Indian retailers and FMCG companies, this creates an opportunity to identify localized price gaps, benchmark competitors, detect promotional differences, and understand how consumers in different markets experience inflation.
The result is a more actionable view of grocery pricing: not simply whether prices are increasing, but where, when, how much, and across which products.
Why Should Retailers Choose Product Data Scrape?
Retailers need structured, consistent, and analysis-ready product information rather than disconnected price snapshots. Product Data Scrape helps transform publicly available grocery information into datasets suitable for competitive benchmarking, historical analysis, assortment research, and pricing intelligence.
A strong data workflow can capture product names, brands, categories, prices, discounts, pack sizes, availability, retailer information, and timestamps. This supports both operational monitoring and longer-term market research.
The approach is especially useful when teams need to compare large product catalogues or track changes across multiple markets. Instead of relying on manually collected spreadsheets, businesses can build repeatable datasets that support dashboards and analytical models.
The value ultimately comes from turning fragmented market observations into structured evidence that pricing, category, procurement, and strategy teams can act upon.
Conclusion
Grocery pricing changes continuously, and retailers need more than periodic inflation reports to understand what customers are actually paying. Price Intelligence connects product-level observations with competitive, geographic, and historical context, helping businesses identify meaningful movements and respond faster.
The strongest approach combines official inflation indicators with granular marketplace observations. FAO's data shows that global food inflation and commodity prices can shift significantly across relatively short periods, while India's inflation indicators demonstrate that national conditions can also change considerably.
A structured Grocery Inflation Tracking Data strategy can support pricing, promotions, procurement, forecasting, assortment planning, and competitive benchmarking.
Turn changing grocery prices into actionable market intelligence with Product Data Scrape—start building your retail pricing dataset today!
FAQs
1. What is grocery inflation tracking?
Grocery inflation tracking monitors product prices over time to identify increases, decreases, category movements, promotional changes, regional differences, and competitive pricing patterns.
2. Why is grocery price data important for retailers?
It helps retailers understand market movements, benchmark competitors, identify pricing opportunities, monitor promotions, improve forecasting, and respond to changing consumer purchasing conditions.
3. What products can be monitored?
Businesses can monitor packaged foods, staples, beverages, dairy, snacks, fresh categories, household essentials, personal-care products, and other grocery SKUs available across targeted retailers.
4. How can Product Data Scrape support grocery analysis?
Product Data Scrape can help businesses create structured product datasets containing pricing, product attributes, promotions, availability, and historical observations for analytical applications.
5. How frequently should grocery prices be tracked?
Tracking frequency depends on category volatility and business objectives. High-change categories may require daily monitoring, while slower-moving products can be reviewed weekly or monthly.


 Singapore
 EMAIL
EMAIL
 PHONE
PHONE


.webp "thumb")













.webp)






