Introduction
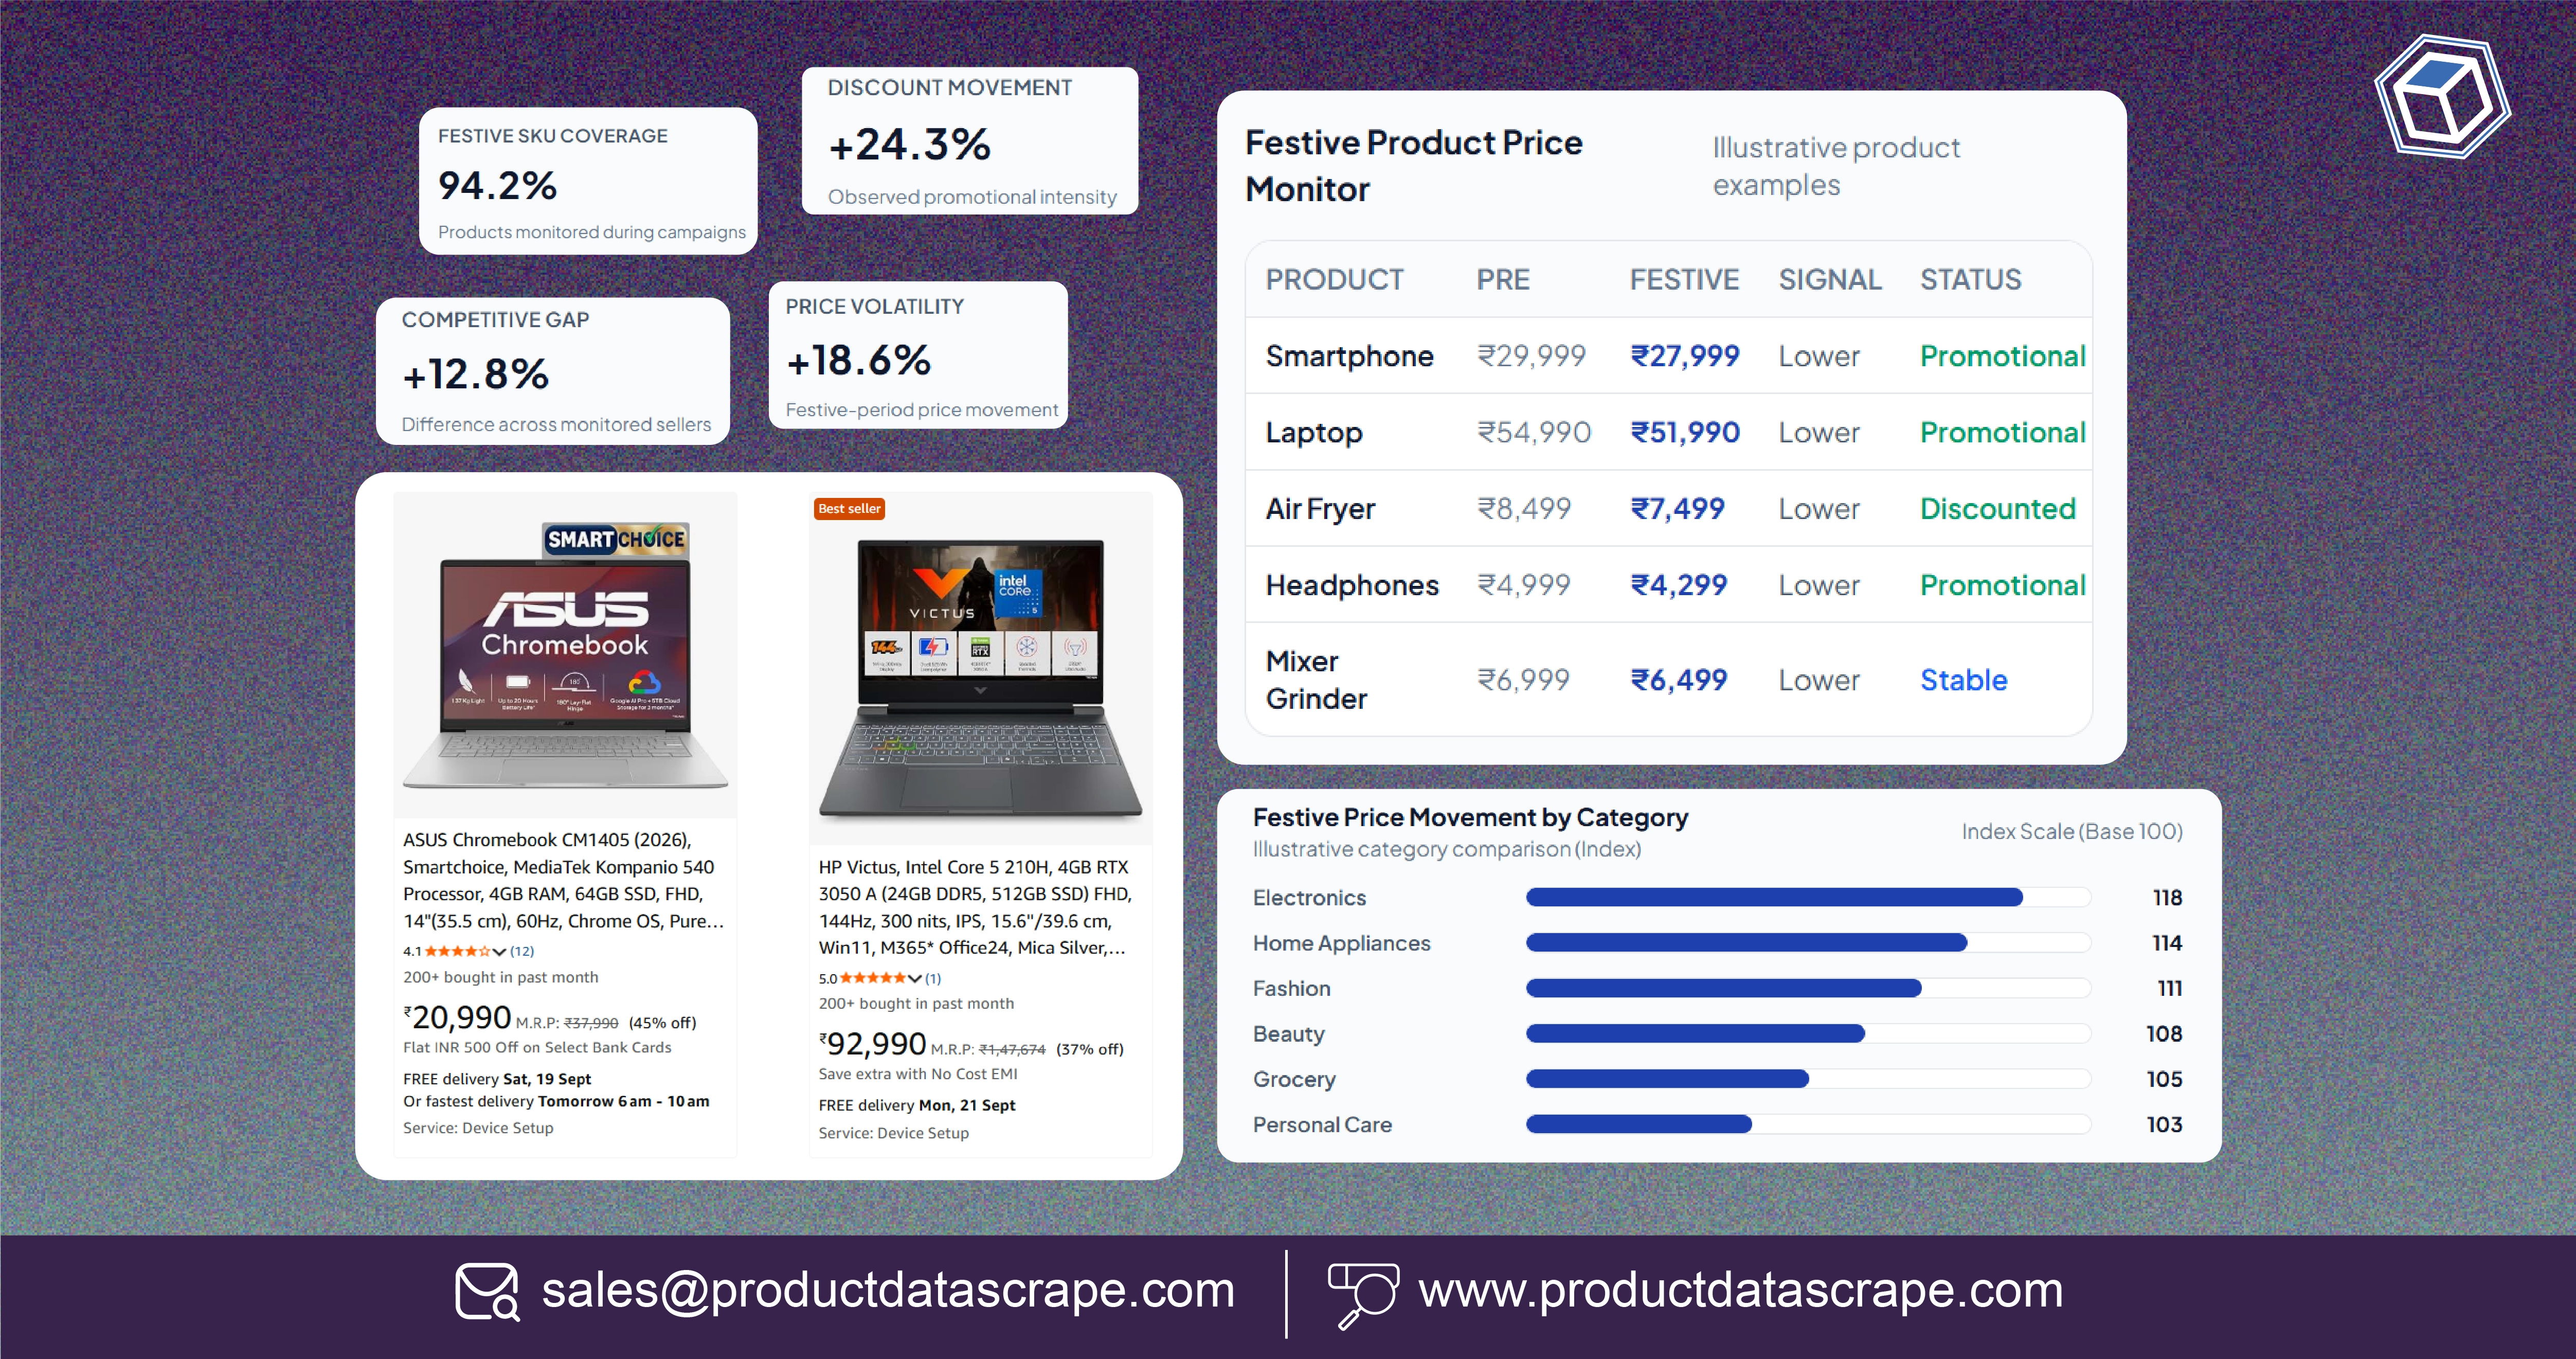
Businesses can solve festive-season pricing challenges by continuously collecting product prices, discounts, availability, and competitor offers before, during, and after major shopping events. festive season price tracking India gives brands and retailers the historical context needed to distinguish genuine discounts from temporary promotional changes.
India's festive period creates a concentrated window of high consumer activity. Diwali, Big Billion Days (BBD), and the Great Indian Festival bring aggressive promotions across electronics, fashion, groceries, beauty, home products, and other categories. For pricing managers, e-commerce teams, marketplace sellers, and market researchers, manually monitoring thousands of products is difficult and inconsistent.
A structured price dataset can capture product names, categories, sellers, current prices, original prices, discounts, ratings, reviews, availability, and timestamps. This allows teams to compare today's offer with historical observations rather than evaluating a promotion in isolation.
Tracking Festive Discounting becomes especially useful when businesses need to answer practical questions: Which products have the biggest price reductions? Which competitors are discounting more aggressively? Which categories experience the highest price volatility? Which promotions remain active after the peak event?
The sections below explain how businesses can build a scalable festive pricing intelligence strategy using structured e-commerce and marketplace data.
How Can Businesses Track Competitor Prices During BBD?
BBD competitor price tracking, E-commerce data scraping can help brands monitor competitive price movements during Big Billion Days and other high-volume shopping periods. The core objective is to create comparable, timestamped records across products and sellers.
For a pricing analyst, collecting a single price is rarely enough. A stronger dataset includes the product's previous price, current promotional price, discount percentage, seller, availability, rating, review count, and collection timestamp. These fields make it possible to measure price changes and identify which competitors are most aggressive.
India's digital commerce market has expanded rapidly. IBEF reported India's e-commerce market at approximately $46.2 billion in 2020 and projected it to reach $111.4 billion by 2025. The scale of online retail means manual competitive research becomes increasingly difficult.
| Year |
India E-commerce Market* |
Pricing Intelligence Opportunity |
| 2020 |
$46.2B |
Establish baseline |
| 2021 |
Growing market |
Expand competitor coverage |
| 2022 |
Growing market |
Monitor category pricing |
| 2023 |
Growing market |
Compare promotional depth |
| 2024 |
Growing market |
Increase historical tracking |
| 2025 |
$111.4B projected |
Scale automated monitoring |
| 2026 |
Ongoing |
Apply historical benchmarks |
2020 and 2025 figures are cited market estimates; intermediate years are intentionally described qualitatively rather than presented as unsupported exact values.
A useful BBD workflow should begin several weeks before the event. Pre-event prices establish a baseline. During BBD, higher-frequency collection captures promotional changes. After the event, continued monitoring shows whether prices return to their previous levels.
This creates a complete price journey instead of a single promotional snapshot.
For brands, the resulting intelligence can support competitor benchmarking, promotional planning, pricing decisions, and product-level market research.
How Can Brands Understand Festive Pricing Trends Across India?
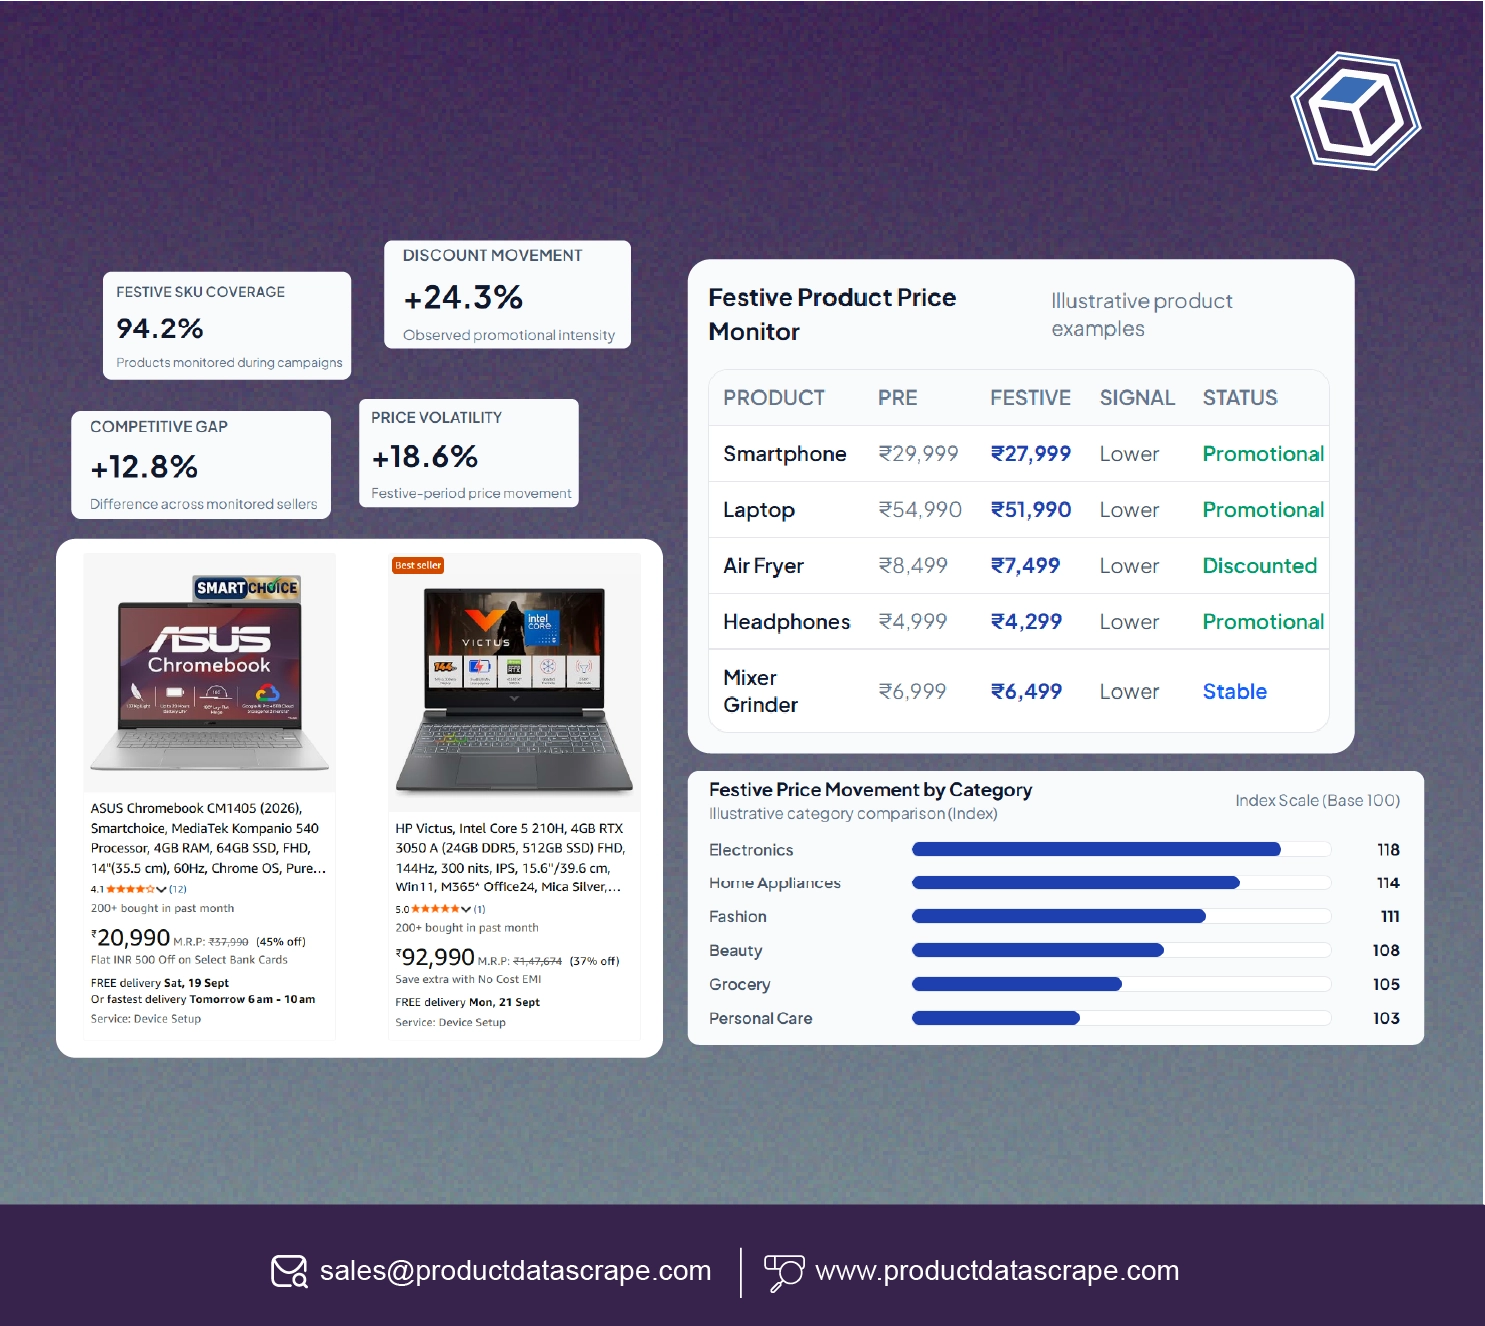
festive season pricing analysis India helps businesses understand how prices behave across categories, products, sellers, and shopping events. Instead of focusing exclusively on individual discounts, analysts can study broader patterns such as average discount depth, price volatility, promotional duration, and category-level competition.
A useful approach is to create category benchmarks. For example, electronics may experience deeper promotional activity than everyday grocery products, while fashion may have different discount patterns based on seasonality and inventory levels.
Historical observations can help businesses establish these differences. A product observed at ₹10,000 before a festive event and ₹8,500 during the event shows a 15% reduction. If the same product was already available for ₹8,700 two weeks earlier, however, the advertised discount requires more context.
India's e-commerce industry has been supported by rising internet adoption and expanding digital payments. IBEF estimates that India's e-commerce market could reach $350 billion by 2030.
| Year |
Market Development |
Analytical Focus |
| 2020 |
Rapid digital adoption |
Build historical baseline |
| 2021 |
Online shopping expansion |
Track festive categories |
| 2022 |
Marketplace maturity |
Compare seller pricing |
| 2023 |
Broader digital assortment |
Analyze discount depth |
| 2024 |
Increasing competition |
Monitor price volatility |
| 2025 |
Larger e-commerce opportunity |
Scale automated collection |
| 2026 |
Continued expansion |
Develop predictive benchmarks |
For pricing teams, historical data should be segmented by product, category, seller, marketplace, and event. This allows businesses to compare Diwali against BBD, Great Indian Festival promotions, and other seasonal campaigns.
The most valuable output is not simply a list of discounted products. It is a dataset showing how pricing behavior changes over time and across competitive environments.
How Can Retailers Monitor Prices Throughout the Festive Shopping Period?
festive eCommerce price tracking gives businesses continuous visibility into product prices throughout the shopping cycle. Festive promotions rarely remain static. Prices can change during pre-event sales, launch offers, peak-day promotions, and post-event clearance campaigns.
A scheduled monitoring system can collect priority products at predefined intervals. High-value or highly competitive SKUs can be monitored more frequently, while stable products can be checked at longer intervals.
This approach improves efficiency because businesses do not need to treat every product equally. A pricing team might monitor high-revenue electronics hourly during a peak event while collecting lower-volatility household products several times per day.
India's digital commerce growth provides strong justification for scalable monitoring. The country's e-commerce market was estimated at $46.2 billion in 2020 and projected at $111.4 billion for 2025 by IBEF.
| Year |
Market Context |
Monitoring Strategy |
| 2020 |
Rapid online adoption |
Establish product baselines |
| 2021 |
Higher online participation |
Increase category coverage |
| 2022 |
Marketplace growth |
Track seller-level changes |
| 2023 |
More competitive offers |
Increase collection frequency |
| 2024 |
Expanding online assortment |
Add historical comparisons |
| 2025 |
$111.4B projected market |
Scale monitoring |
| 2026 |
Continuing market development |
Apply predictive models |
The dataset should retain both current and previous observations. This makes it possible to calculate absolute price movement and percentage change.
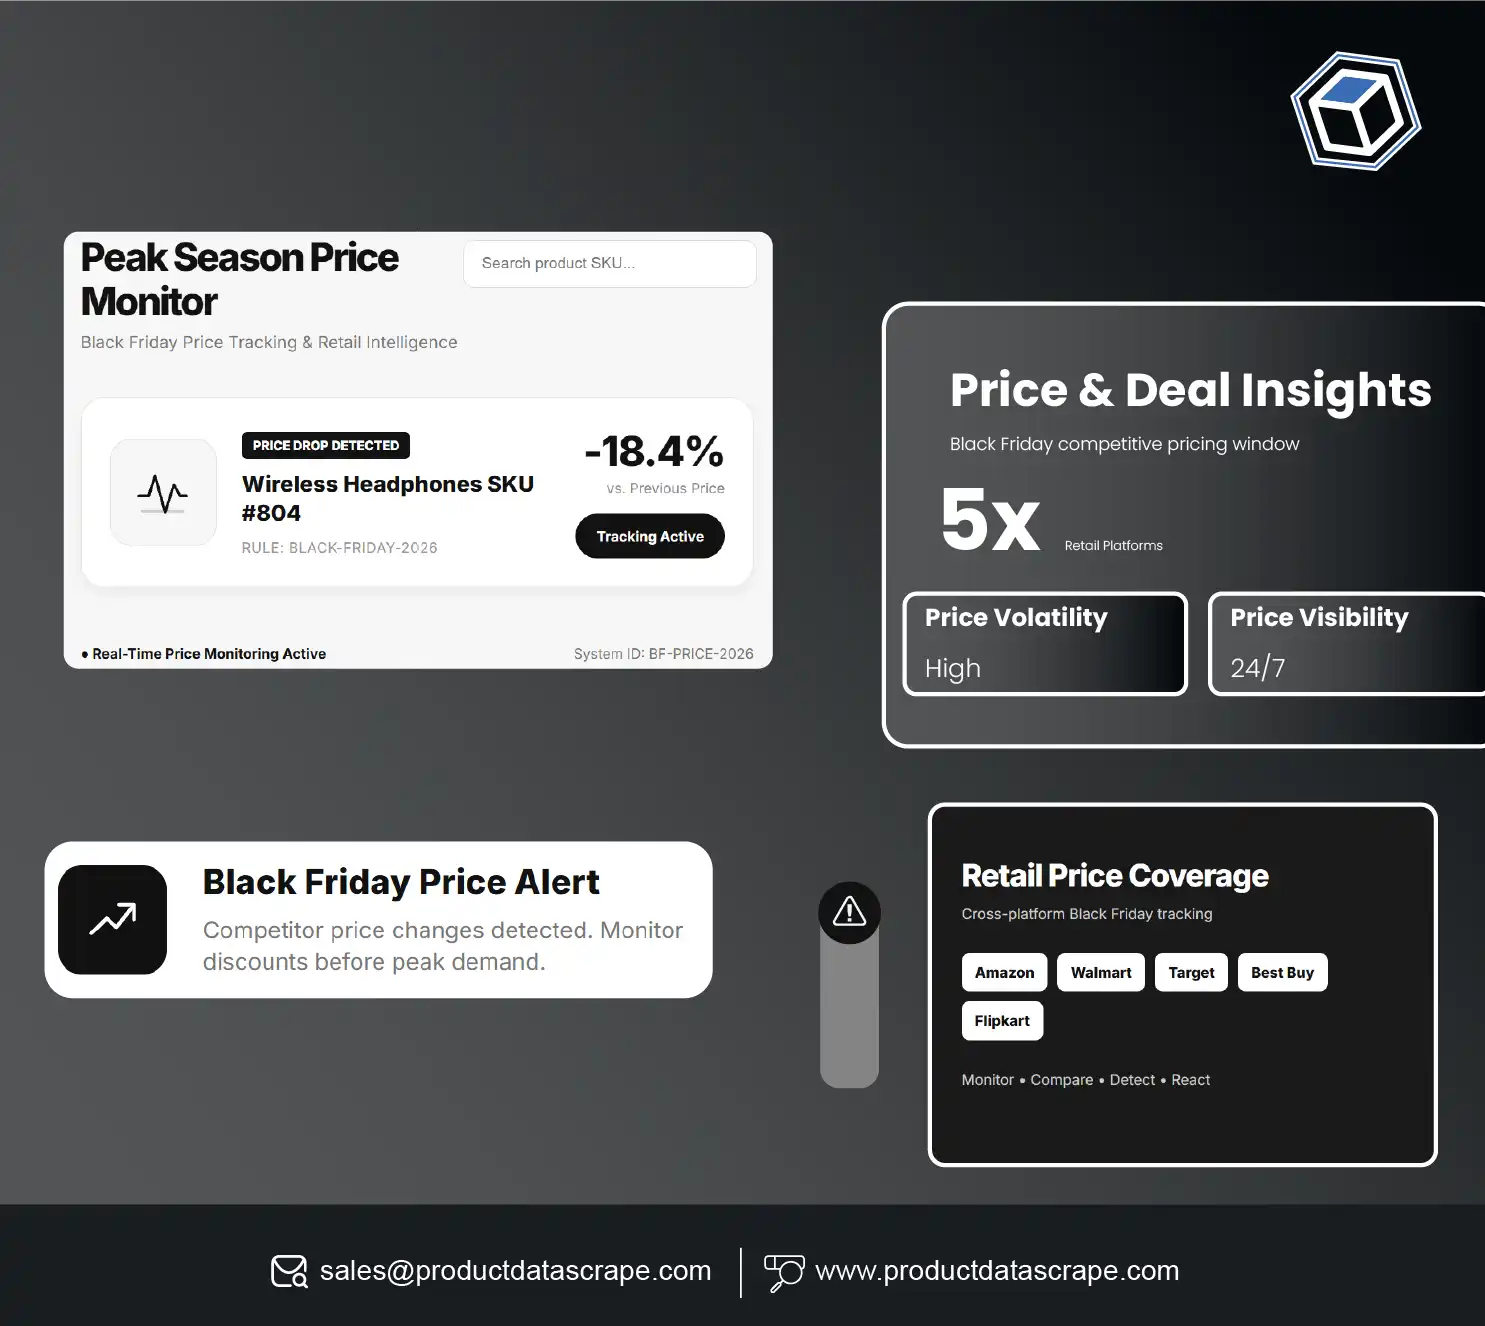
A monitoring workflow can also trigger alerts when a product falls below a target threshold, when a competitor's price changes significantly, or when a product becomes unavailable.
For e-commerce managers, this transforms price monitoring from a manual research task into an operational intelligence system.
How Can Brands Analyze Pricing Across Multiple Marketplaces?
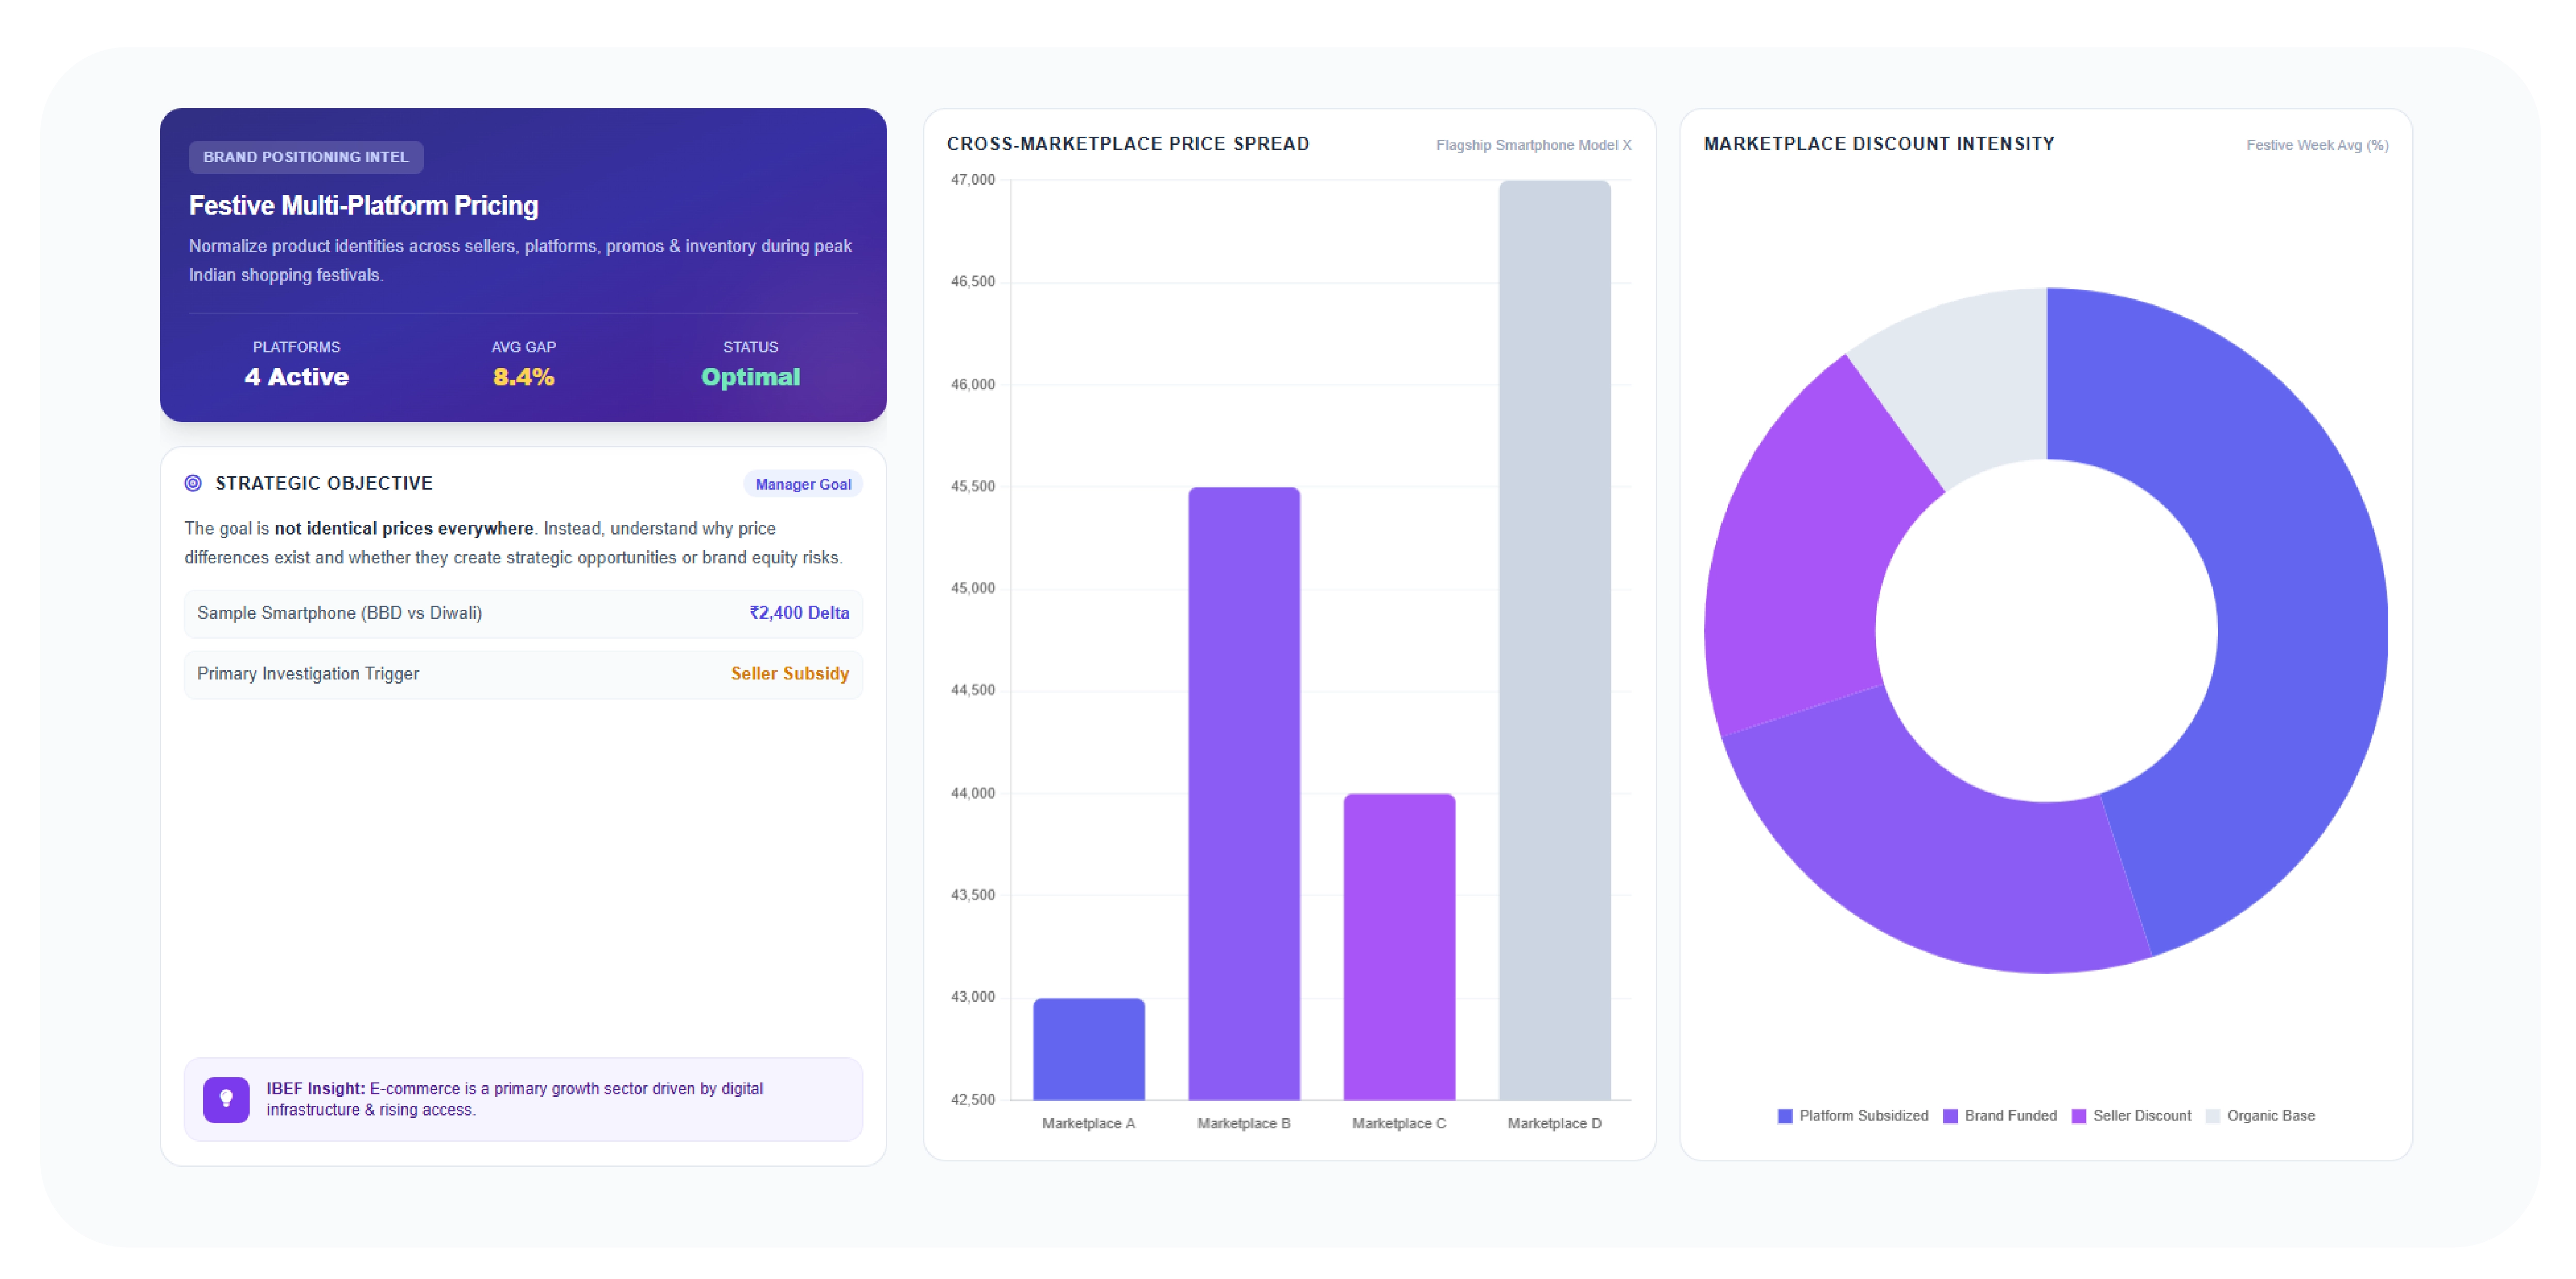
festive marketplace pricing analysis helps brands compare product positioning across different online marketplaces during India's major shopping festivals. The same product can appear at different prices depending on seller, platform, promotion, inventory, and timing.
A cross-marketplace dataset should therefore normalize product identities before prices are compared. Product titles alone may not be sufficient because different marketplaces can use different naming conventions.
Useful fields include product identifiers, brand, model number where available, product title, seller, price, discount, rating, review count, availability, marketplace, and timestamp.
India's online marketplace ecosystem has become increasingly important to retail businesses. IBEF identifies e-commerce as a major growth sector supported by internet adoption, digital infrastructure, and expanding consumer access.
| Year |
Digital Commerce Trend |
Marketplace Analysis |
| 2020 |
E-commerce acceleration |
Establish marketplace baselines |
| 2021 |
Broader online adoption |
Expand platform coverage |
| 2022 |
Marketplace competition |
Compare seller prices |
| 2023 |
More promotional activity |
Monitor product-level discounts |
| 2024 |
Growing digital assortment |
Analyze platform differences |
| 2025 |
Larger market opportunity |
Automate cross-marketplace tracking |
| 2026 |
Continued expansion |
Build predictive price intelligence |
For example, a brand can compare the price of the same smartphone across multiple marketplaces during BBD and Diwali. If one platform consistently offers a lower effective price, the brand can investigate seller behavior, promotional funding, or marketplace-specific campaigns.
Cross-marketplace analysis also helps identify price gaps that may affect brand positioning.
For marketplace managers, the goal is not necessarily to force identical prices everywhere. Instead, the goal is to understand why price differences exist and whether they create strategic opportunities or risks.
How Can Businesses Monitor Great Indian Festival Pricing?
Great Indian Festival price scraping can help brands and retailers collect structured promotional data throughout one of India's most important online shopping events. Amazon's Great Indian Festival can create significant changes in product pricing, seller activity, availability, and promotional messaging.
The most useful strategy is to establish a pre-event benchmark and then compare prices throughout the promotional period. Businesses can track products across multiple snapshots and calculate the lowest observed price, average price, discount depth, and price recovery after the event.
The value of historical monitoring is particularly important for high-ticket products. A large advertised discount can attract attention, but businesses need historical observations to determine whether the effective price is genuinely lower than its recent market position.
| Year |
Festive Data Strategy |
Business Application |
| 2020 |
Capture event baselines |
Establish historical records |
| 2021 |
Expand product coverage |
Compare category promotions |
| 2022 |
Monitor seller activity |
Identify competitive changes |
| 2023 |
Increase frequency |
Track price volatility |
| 2024 |
Monitor promotional depth |
Benchmark competitors |
| 2025 |
Automate event collection |
Build reusable datasets |
| 2026 |
Apply historical intelligence |
Improve event forecasting |
A strong dataset should preserve the exact observation time. This allows analysts to identify whether a price change happened before the main event, during a peak promotional window, or afterward.
Businesses can also combine pricing with availability. A deeply discounted product that repeatedly goes out of stock tells a different commercial story from a similarly priced product that remains consistently available.
The same data can support competitor research, promotion analysis, demand forecasting, and category-level market intelligence.
How Can Businesses Measure Diwali Promotional Pricing More Effectively?
Diwali festive promotional pricing analysis allows businesses to examine the relationship between festive campaigns, discounting, product categories, and competitive behavior. Diwali is not a single-day commercial event; promotional activity often begins weeks earlier and can continue into post-festival campaigns.
For brands, this creates an opportunity to compare pricing phases. A pre-Diwali period can establish the baseline. Early promotions can reveal initial discounting. Peak-period observations can capture the strongest offers. Post-Diwali monitoring can show whether prices recover or remain discounted.
A simple price index can be created by setting the pre-event average price to 100. If the festive price index falls to 85, the product's observed price is approximately 15% below the baseline.
| Year |
Festive Analysis Stage |
Recommended Measurement |
| 2020 |
Baseline |
Record pre-event prices |
| 2021 |
Early promotion |
Track initial discounts |
| 2022 |
Peak promotion |
Measure price drops |
| 2023 |
Competitive expansion |
Compare sellers |
| 2024 |
Multi-platform promotions |
Compare marketplaces |
| 2025 |
Higher data availability |
Increase monitoring |
| 2026 |
Ongoing |
Use historical benchmarks |
The dataset should also include promotional context where publicly displayed. Coupon offers, bundle discounts, bank offers, and seller-level promotions can affect the effective consumer price and should not automatically be treated as equivalent to a direct product-price reduction.
For pricing analysts, separating these mechanisms improves data quality.
A mature Diwali intelligence workflow can answer questions such as which categories receive the deepest direct discounts, which products maintain stable prices, which competitors become more aggressive, and how quickly prices recover after the festival.
These insights can improve promotional planning for future festive periods.
Why Choose Product Data Scrape?
Product Data Scrape helps brands and retailers transform fragmented festive pricing information into structured datasets for competitive analysis. Festive Gifting Demand Tracking, festive season price tracking India can support monitoring of prices, discounts, sellers, availability, product categories, ratings, and promotional movements.
For pricing teams, the benefit is consistent historical data rather than isolated manual observations. Businesses can define priority products, set monitoring frequencies, compare marketplaces, and analyze price changes across major festive events.
The approach can support pricing intelligence, competitor benchmarking, promotional analysis, assortment research, and market reporting. Data can also be organized for dashboards and downstream analytics, allowing teams to focus on decisions rather than repetitive data collection.
The key is to combine reliable extraction, normalization, timestamps, and historical storage into one scalable workflow.
Conclusion
Festive pricing challenges are best addressed with continuous, historical, and structured data. Marketplace Seller Intelligence, festive season price tracking India gives brands visibility into seller behavior, product prices, discounts, availability, and competitive movements across major shopping events.
The strongest strategy starts before the festival, monitors prices throughout the event, and continues after promotions end. This allows businesses to distinguish genuine price reductions from short-term promotional claims and understand how competitors position products.
For brands, retailers, marketplace teams, and pricing analysts, this intelligence can support better promotional planning, competitive benchmarking, assortment decisions, and market forecasting.
Ready to build a scalable festive pricing intelligence workflow? Partner with Product Data Scrape to track prices, sellers, discounts, and competitive movements across Diwali, BBD, Great Indian Festival, and other major Indian shopping events!
FAQs
1. What is festive price tracking?
Festive price tracking monitors product prices, discounts, sellers, and availability before and during major shopping events to help businesses identify pricing trends and competitive movements.
2. Why should brands track prices before festivals?
Pre-festival prices establish a baseline, allowing brands to determine whether advertised discounts represent genuine reductions and compare promotional pricing with recent historical market prices.
3. Which Indian festivals should businesses monitor?
Businesses can monitor Diwali, Big Billion Days, Great Indian Festival, and other major seasonal campaigns depending on their product categories, marketplaces, customers, and competitive intelligence requirements.
4. How frequently should festive prices be collected?
High-priority products can be monitored frequently during peak promotions, while stable products can use scheduled intervals. Frequency should reflect volatility, product value, and business objectives.
5. Can Product Data Scrape support festive pricing analysis?
Yes. Product Data Scrape can help businesses collect structured product, price, seller, discount, availability, and marketplace information for recurring festive competitive intelligence and pricing analysis.


 Singapore
 EMAIL
EMAIL
 PHONE
PHONE















.webp)






