Introduction
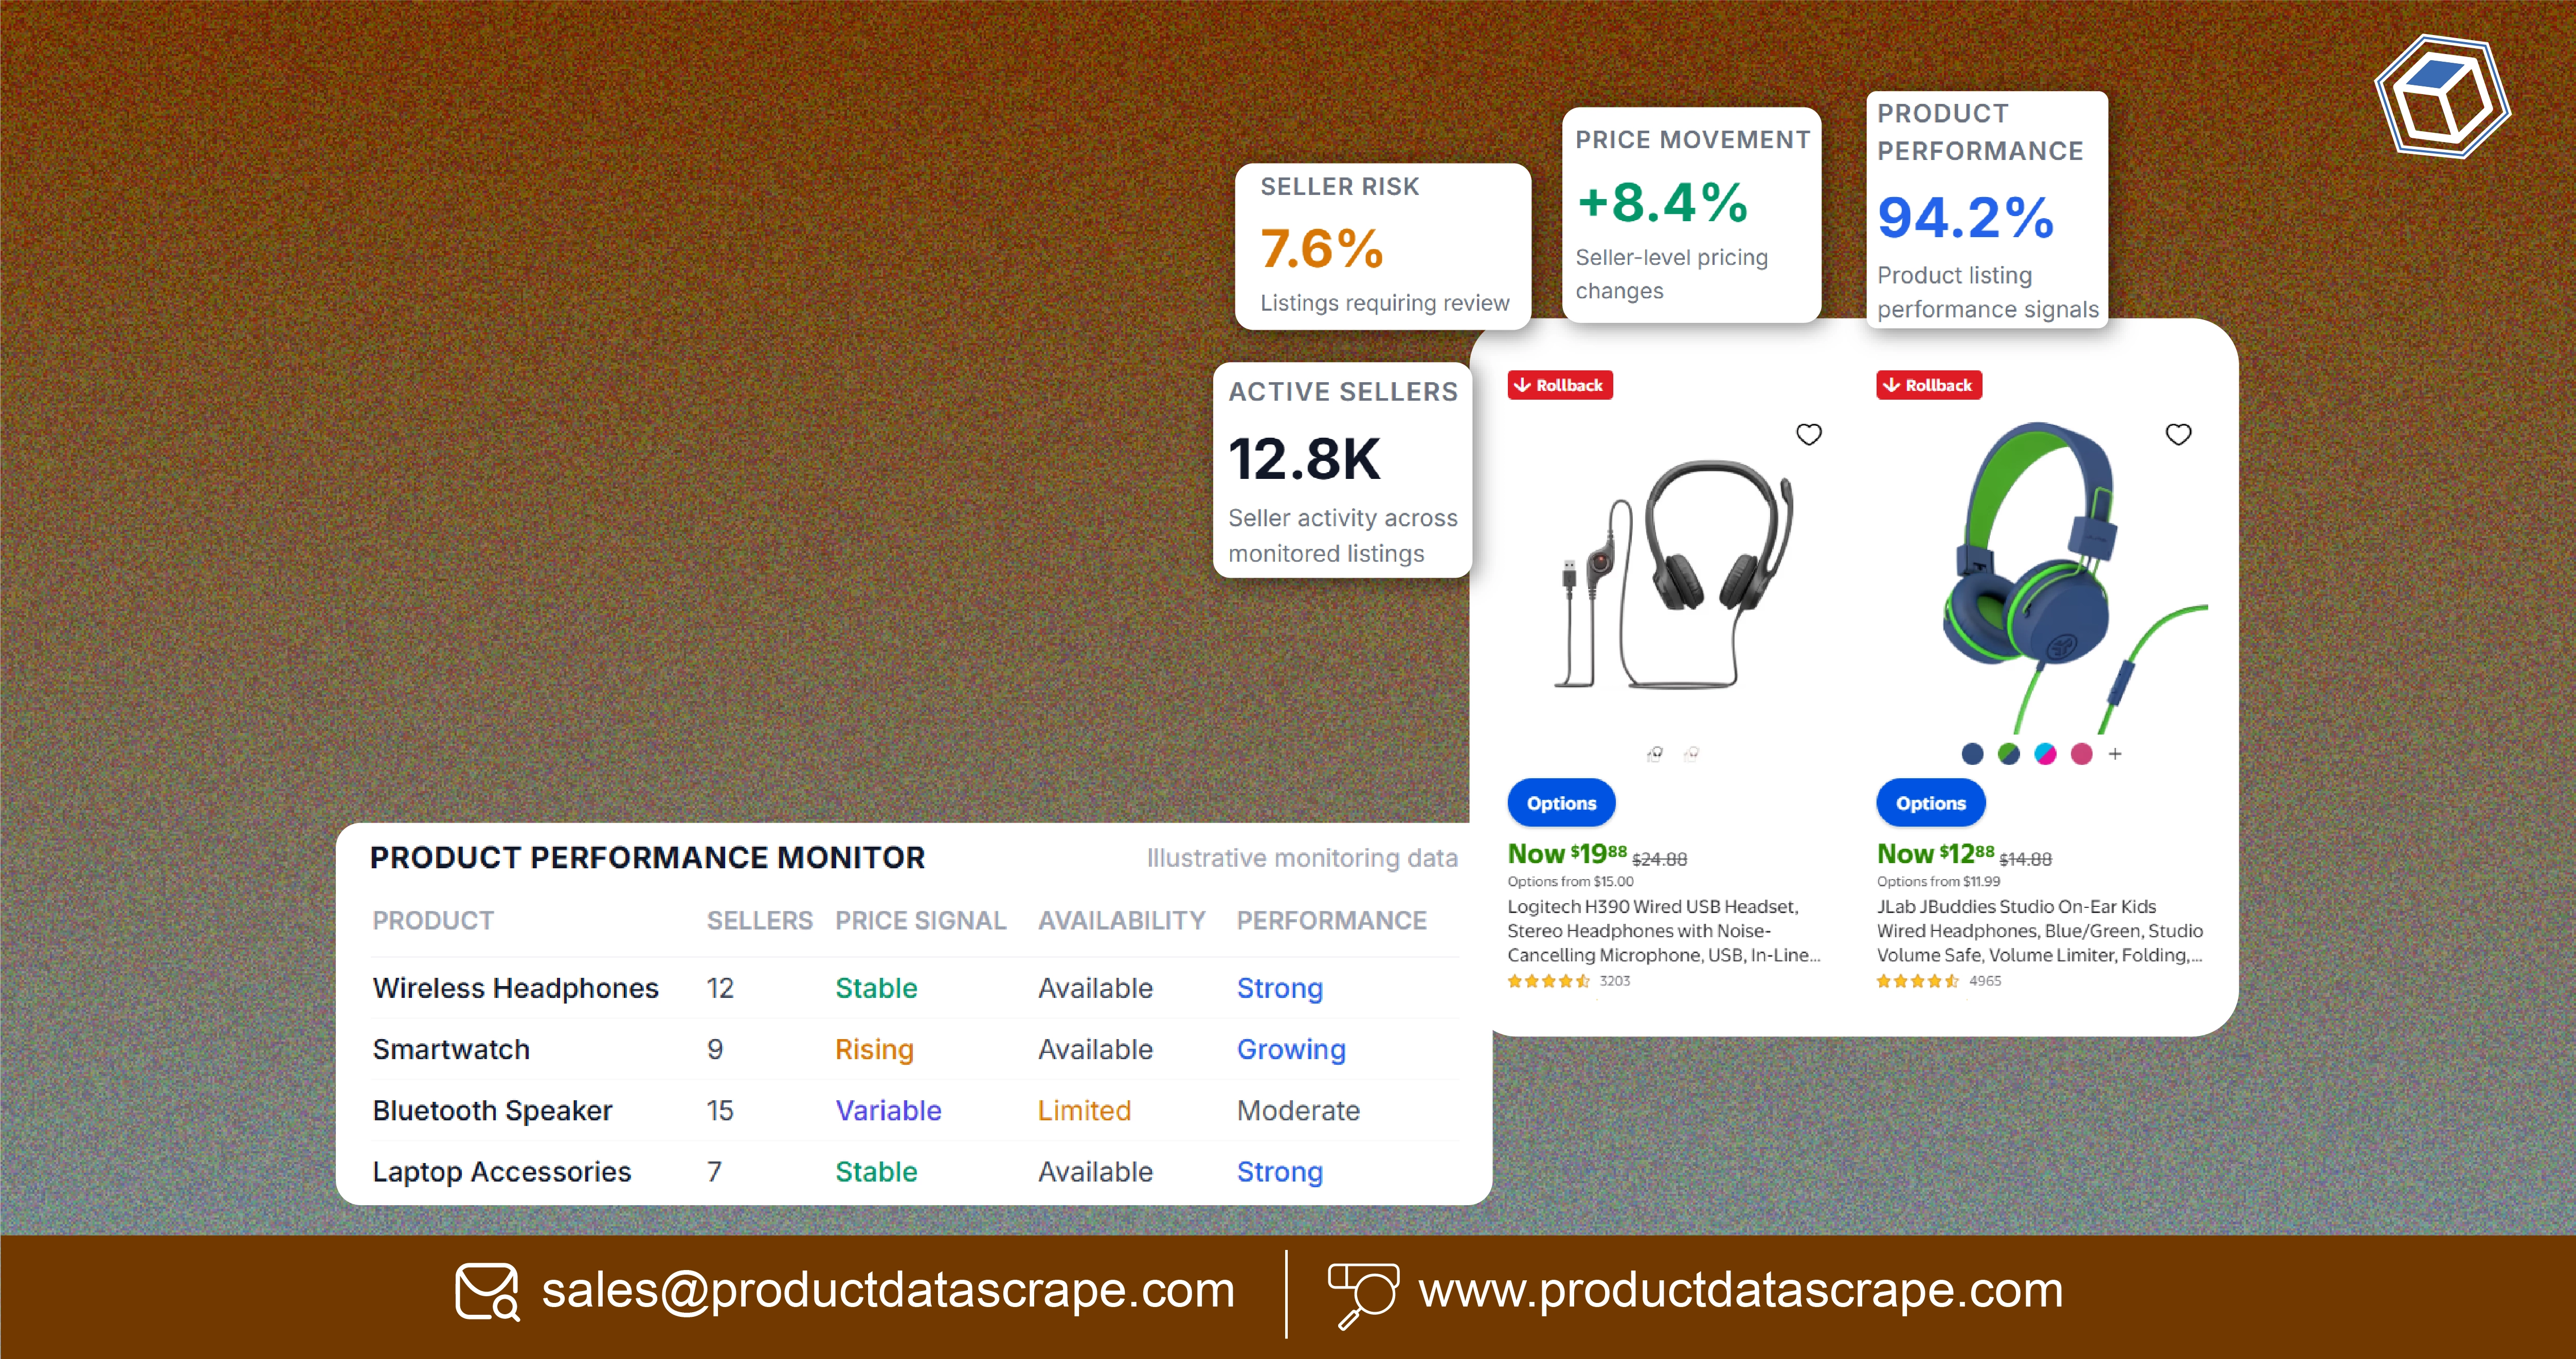
Brands can solve marketplace visibility challenges by building a structured data pipeline that continuously tracks sellers, products, prices, availability, ratings, and reviews. marketplace seller intelligence Data for brands turns fragmented marketplace activity into actionable intelligence for pricing, assortment, competitor analysis, and seller monitoring.
For a brand manager, marketplace operations team, pricing analyst, or e-commerce intelligence provider, the challenge is no longer simply knowing where a product is listed. The bigger problem is understanding who is selling it, at what price, with what assortment, and how that position changes over time.
The global e-commerce market illustrates why this intelligence is increasingly important. Worldwide retail e-commerce sales were approximately $4.25 trillion in 2020 and are forecast to reach roughly $7.47 trillion in 2026 under one eMarketer forecast series. Online marketplaces represented 62% of global retail e-commerce sales in 2024, reaching about $2.4 trillion, while third-party sellers accounted for 81% of marketplace sales.
Marketplace selling intelligence allows brands to move from isolated marketplace checks to systematic monitoring. A structured dataset can identify new sellers, detect price changes, compare product coverage, map duplicate listings, and reveal where unauthorized or inconsistent offers appear.
The following sections explain how brands can build a scalable approach to seller and product intelligence, with practical data fields, workflows, and market statistics.
1. How Can Brands Monitor Seller Assortments More Effectively?
marketplace seller assortment monitoring, Marketplace Seller Intelligence Guide provides a framework for understanding which sellers offer which products across marketplaces. For brands, assortment visibility matters because competitors may introduce similar products, sellers may expand into new categories, and individual listings can change frequently.
A useful seller dataset should connect seller identity with product identifiers, product titles, categories, prices, ratings, review counts, availability, seller status, product URLs, and collection timestamps. Once these fields are standardized, brands can compare seller coverage instead of manually reviewing marketplace pages.
The scale of digital commerce makes this increasingly important. Global retail e-commerce sales increased from approximately $4.25 trillion in 2020 to $4.99 trillion in 2021 and $5.31 trillion in 2022 in the referenced eMarketer series. By 2026, the same source projected approximately $7.47 trillion.
| Year |
Global Retail E-commerce Sales |
Seller Intelligence Opportunity |
| 2020 |
$4.25T |
Establish seller baselines |
| 2021 |
$4.99T |
Expand seller discovery |
| 2022 |
$5.31T |
Track category expansion |
| 2023 |
$5.78T |
Compare marketplace coverage |
| 2024 |
$6.33T |
Monitor seller competition |
| 2025 |
$6.88T |
Strengthen recurring monitoring |
| 2026 |
$7.47T* |
Analyze current seller movements |
2025 and 2026 are forecast values in this eMarketer series.
For example, a brand can identify that a particular product is being sold by five sellers today but eight sellers next month. That change may indicate increased competition, reseller activity, or broader marketplace availability.
The key insight is that assortment should be monitored as a relationship between seller → product → marketplace → price → availability. Capturing these relationships over time allows brands to identify emerging sellers and changing competitive pressure.
A practical workflow should prioritize high-value SKUs first. Brands can then expand monitoring to long-tail products once the core dataset is stable. This reduces unnecessary collection while producing meaningful intelligence quickly.
2. What Data Should Brands Extract From Marketplace Sellers?
marketplace seller data extraction for brands should capture enough information to connect seller activity with product and pricing behavior. A seller name alone is rarely sufficient for strategic analysis.
A more useful dataset can include seller name, seller ID where publicly available, product ID, product title, brand, category, current price, previous price when available, discount, stock status, rating, review count, shipping information, marketplace URL, seller URL, and extraction timestamp.
The dataset should also distinguish between seller-level and product-level information. One seller may offer hundreds of products, while one product may be offered by multiple sellers. Maintaining these relationships enables brands to identify which sellers compete directly for the same products.
Marketplace scale provides a strong reason for this approach. Euromonitor reported that online marketplaces accounted for 62% of global retail e-commerce sales in 2024, while third-party sales represented 81% of marketplace sales.
| Year |
Global E-commerce Sales |
Brand Data Priority |
| 2020 |
$4.25T |
Build core seller records |
| 2021 |
$4.99T |
Expand seller coverage |
| 2022 |
$5.31T |
Normalize product relationships |
| 2023 |
$5.78T |
Monitor pricing and availability |
| 2024 |
$6.33T |
Track third-party seller activity |
| 2025 |
$6.88T* |
Increase monitoring frequency |
| 2026 |
$7.47T* |
Support continuous intelligence |
Forecast figures for 2025–2026 from the referenced eMarketer series.
For a brand protection or marketplace operations team, the value lies in historical comparison. If a seller suddenly begins listing a large number of branded products, the system can flag that seller for investigation.
Similarly, a sudden change in seller price can be connected to the specific product and marketplace. This makes it easier to distinguish genuine competitive movement from unrelated changes.
Data extraction should therefore be designed around business questions. Instead of asking only "What sellers exist?", brands should ask:
• Which sellers are entering my product categories?
• Which sellers have the largest assortment?
• Which sellers consistently undercut the market?
• Which products have the highest seller concentration?
• Which sellers appear or disappear frequently?
These questions turn raw marketplace data into commercial intelligence.
3. How Can Seller Data Improve Competitor Analysis?
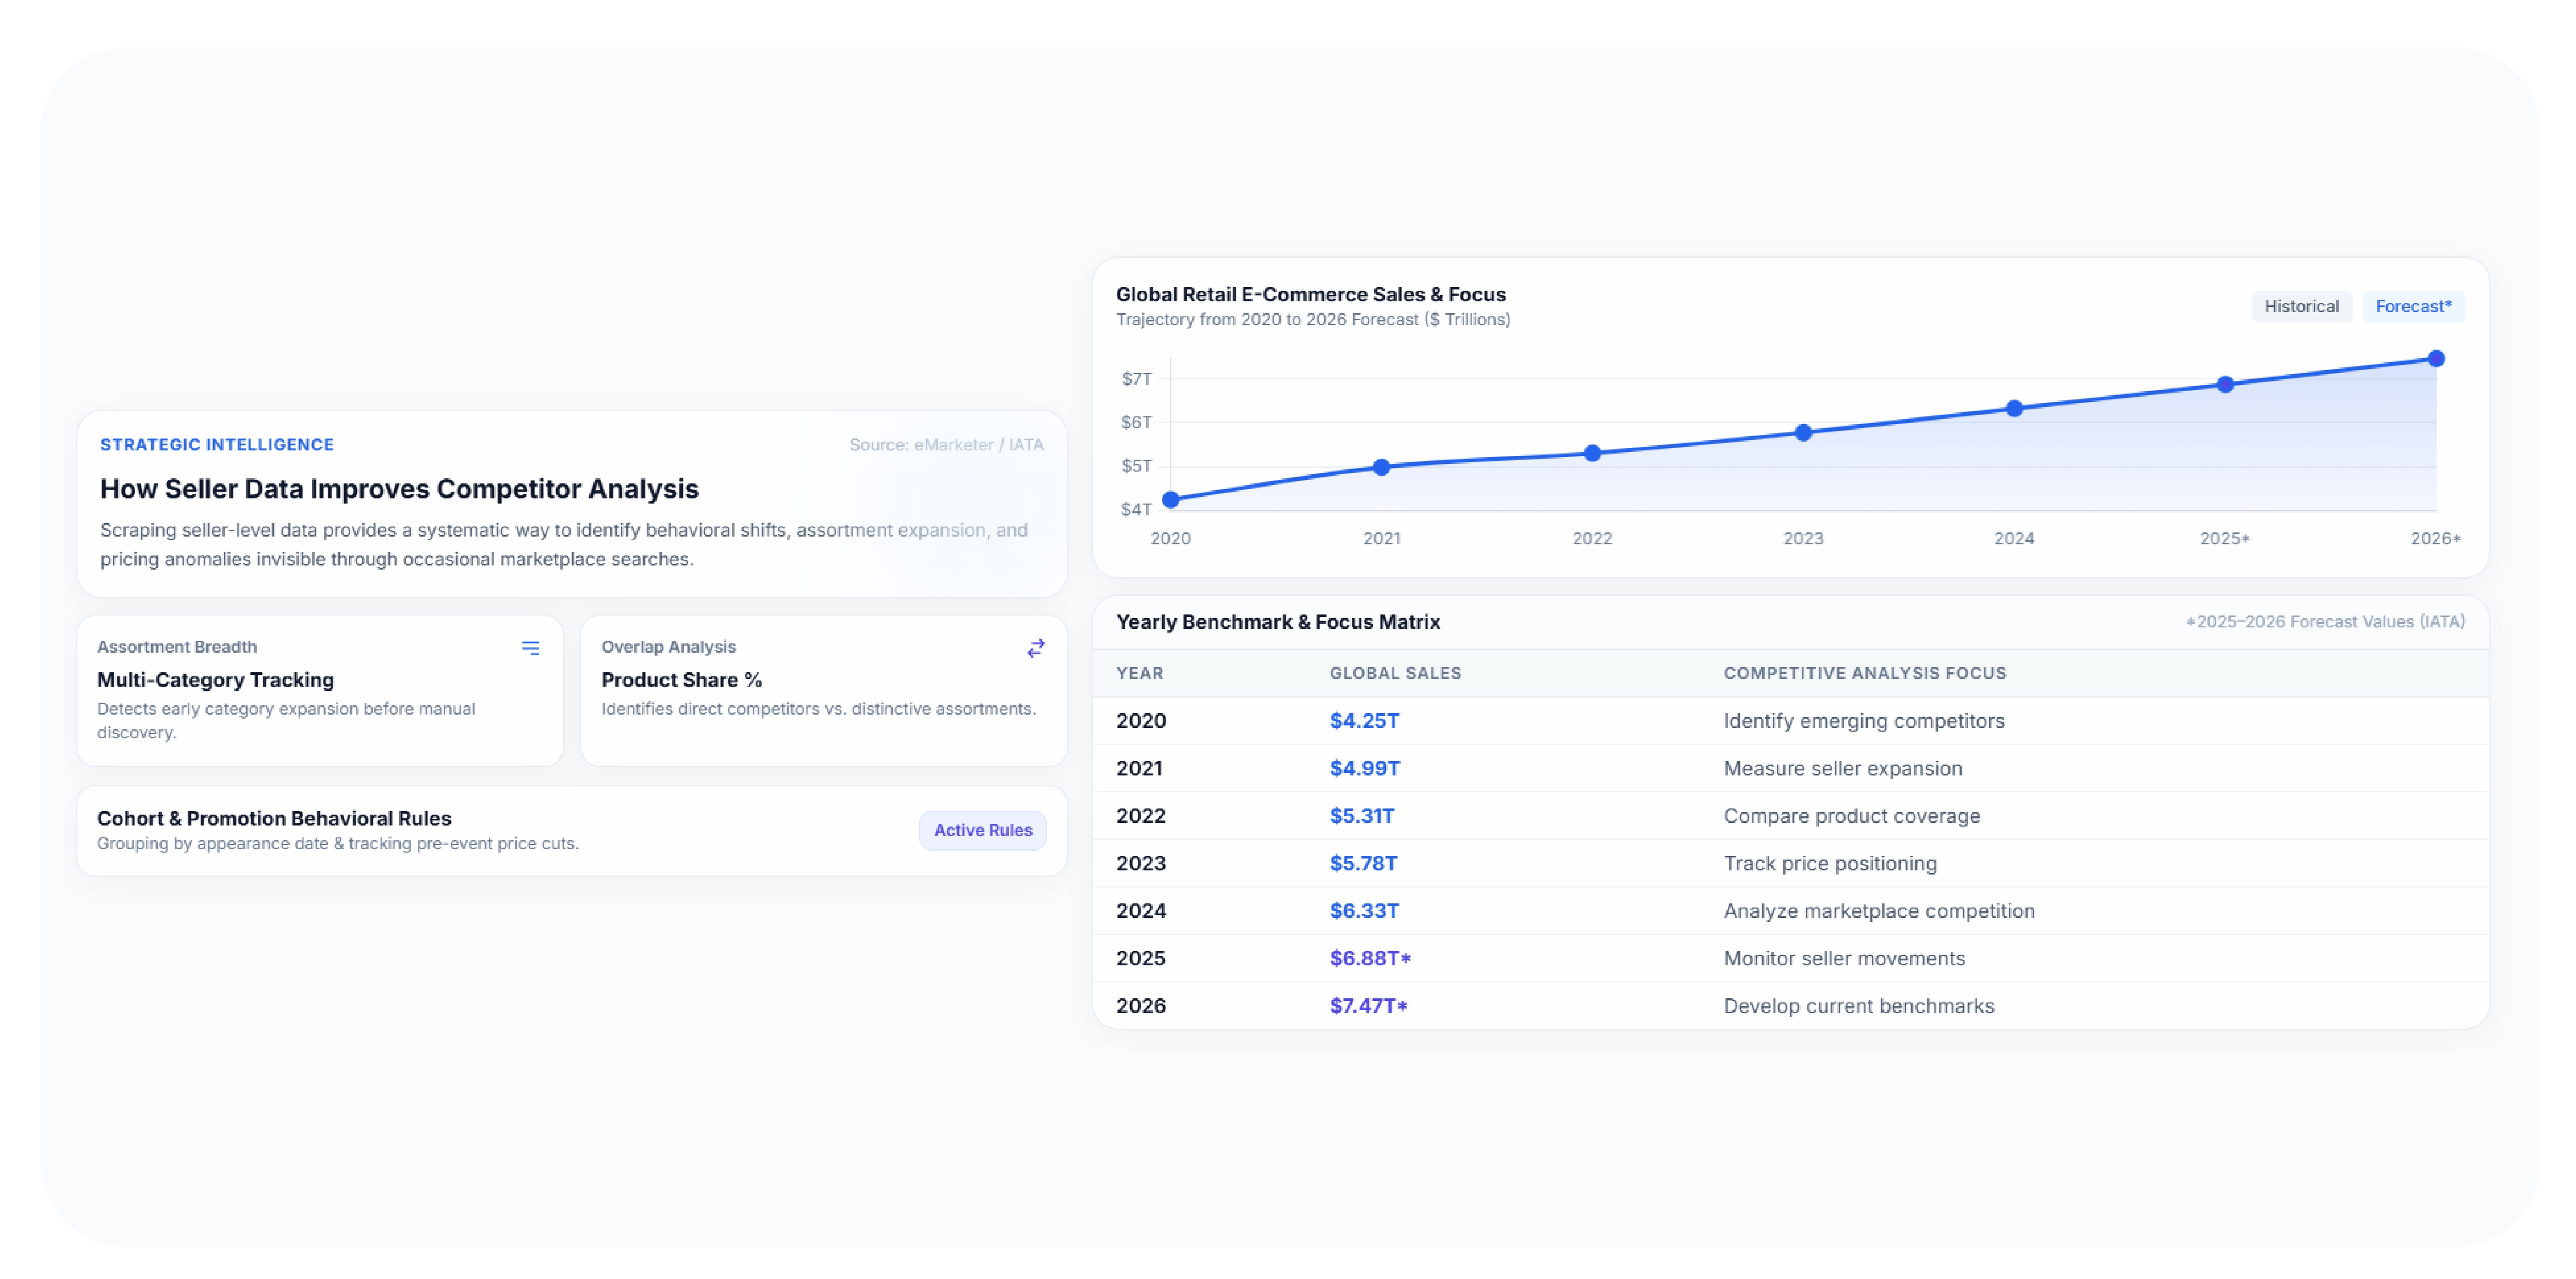
Scrape Seller Data for Competitor Analysis gives brands a systematic way to identify competitive behavior that is difficult to observe through occasional marketplace searches. Seller-level data can show not only what competitors sell but also how broadly they operate and how their positions change.
For example, a competitor may initially sell products in one category and gradually expand into related categories. Historical seller-product relationships can reveal that expansion before it becomes obvious through manual research.
Brands can also calculate seller assortment breadth, average selling price, discount frequency, rating averages, review growth, and product availability. These indicators can be combined into seller-level profiles.
The broader growth of online retail supports the need for such datasets. Global retail e-commerce sales reached approximately $6.33 trillion in 2024 in the eMarketer series, with forecasts of $6.88 trillion for 2025 and $7.47 trillion for 2026.
| Year |
Global E-commerce Sales |
Competitive Analysis Focus |
| 2020 |
$4.25T |
Identify emerging competitors |
| 2021 |
$4.99T |
Measure seller expansion |
| 2022 |
$5.31T |
Compare product coverage |
| 2023 |
$5.78T |
Track price positioning |
| 2024 |
$6.33T |
Analyze marketplace competition |
| 2025 |
$6.88T* |
Monitor seller movements |
| 2026 |
$7.47T* |
Develop current benchmarks |
2025–2026 are forecast values.
A particularly useful technique is seller cohort analysis. Sellers can be grouped according to when they first appeared, how many products they offer, or how frequently they change prices. This helps brands distinguish established competitors from recently emerging sellers.
Another useful technique is seller-product overlap analysis. If two sellers share a large percentage of products, they may represent direct competition. If a seller has a distinctive assortment, it may represent a new competitive segment.
Brands can also use historical records to identify seller behavior around promotions. A seller that consistently lowers prices before major shopping events may require different monitoring rules from a seller that maintains stable pricing.
The result is a more detailed competitor picture based on observed marketplace activity rather than assumptions.
4. How Can Brands Build a Map of Marketplace Competitors?
Marketplace Seller Competitor Mapping connects sellers, products, categories, prices, and marketplaces into a structured competitive landscape. The objective is to understand where each seller fits within the market rather than simply creating a list of seller names.
A mapping system can assign each seller to product categories and connect every observed listing to a product identifier. Brands can then visualize or analyze relationships such as seller-to-product overlap, seller-to-category concentration, and price positioning.
For example, if Seller A offers 2,000 products across five categories while Seller B offers 400 products in one category, their competitive profiles are very different. A simple seller count would not reveal that distinction.
The continued expansion of online retail increases the volume of relationships that brands need to understand. U.S. retail e-commerce sales totaled approximately $1.234 trillion in 2025, according to the U.S. Census Bureau, representing 16.4% of total U.S. retail sales.
| Year |
U.S. E-commerce Indicator |
Mapping Application |
| 2020 |
~$788B annual sales |
Establish digital competitor baseline |
| 2021 |
~$871B |
Expand seller mapping |
| 2022 |
~$1.03T |
Identify category competition |
| 2023 |
~$1.10T |
Compare seller positioning |
| 2024 |
~$1.19T |
Monitor marketplace expansion |
| 2025 |
~$1.23T |
Strengthen seller intelligence |
| 2026 |
Ongoing |
Track current marketplace structure |
2020–2024 values are rounded historical estimates based on Census data; 2025 is the Census Bureau's latest annual estimate. 2026 is not a completed annual figure.
A strong mapping system should include four layers.
Seller layer: seller identity, seller activity, and seller history.
Product layer: product identity, category, brand, and attributes.
Commercial layer: price, discount, availability, rating, and reviews.
Marketplace layer: platform, URL, region, and collection date.
These layers make it possible to perform queries such as "show all sellers offering Brand X products below the target price" or "identify products with increasing seller counts."
This is particularly valuable for brand managers because competitive pressure can be measured at SKU level rather than inferred from general marketplace activity.
5. How Can Brands Match the Same Product Across Different E-commerce Sites?
Product-Data Mapping Across Ecommerce Sites helps solve one of the most difficult marketplace intelligence problems: determining when different listings represent the same or equivalent product.
A product may appear under different titles, descriptions, URLs, seller names, or category structures on different marketplaces. Without normalization, a brand may incorrectly treat the same product as multiple products.
A mapping process can combine product identifiers, brand names, model numbers, GTINs where available, specifications, titles, images, and other relevant attributes. Exact identifiers can provide strong matches, while normalized attributes can support matching where identifiers are unavailable.
Global marketplace activity creates a substantial need for this capability. Euromonitor estimated that online marketplaces generated $2.4 trillion in 2024 and represented 62% of global retail e-commerce sales.
| Year |
Global E-commerce Sales |
Product Mapping Need |
| 2020 |
$4.25T |
Establish product identities |
| 2021 |
$4.99T |
Normalize marketplace listings |
| 2022 |
$5.31T |
Expand cross-platform matching |
| 2023 |
$5.78T |
Improve competitive comparisons |
| 2024 |
$6.33T |
Track third-party assortment |
| 2025 |
$6.88T* |
Automate product relationships |
| 2026 |
$7.47T* |
Support continuous mapping |
2025–2026 figures are forecasts from the referenced eMarketer series.
Consider a hypothetical electronics brand selling a wireless speaker. Marketplace A may list it using the full model number, while Marketplace B uses a shortened title and Marketplace C includes a seller-specific title. A simple text comparison may classify them as different products.
A normalized product record can solve this by retaining the underlying product identity separately from marketplace-specific listing information.
This distinction is crucial for price intelligence. Brands need to compare the price of the same product, not simply products that appear similar.
Product mapping also improves seller analysis. Once listings are mapped to common products, brands can calculate seller counts, price ranges, availability differences, and marketplace coverage for individual SKUs.
6. How Can Brands Create an End-to-End Product and Seller Intelligence System?
Ultimate Guide to Product Mapping, marketplace seller intelligence Data for brands requires combining seller discovery, product mapping, price monitoring, assortment tracking, and historical storage into one repeatable workflow.
The first stage is data collection. Publicly available marketplace information can be collected according to the required scope and applicable platform rules. The second stage is normalization, where product names, seller records, prices, categories, and identifiers are standardized.
The third stage is entity resolution. Products appearing across multiple marketplaces are mapped to common product identities where sufficient evidence exists. The fourth stage is historical storage. Each observation should retain a timestamp so that future analysis can determine what changed.
The fifth stage is analytics. Brands can calculate seller count, price gap, assortment overlap, category coverage, seller entry rate, seller exit rate, and availability changes.
Global e-commerce sales were forecast to reach $7.47 trillion in 2026 in the cited eMarketer series, demonstrating the scale of the digital retail environment in which this intelligence operates.
| Year |
Global E-commerce Sales |
Recommended Intelligence Capability |
| 2020 |
$4.25T |
Basic seller discovery |
| 2021 |
$4.99T |
Product and seller normalization |
| 2022 |
$5.31T |
Historical price collection |
| 2023 |
$5.78T |
Cross-marketplace mapping |
| 2024 |
$6.33T |
Automated competitor analysis |
| 2025 |
$6.88T* |
Continuous seller monitoring |
| 2026 |
$7.47T* |
Integrated marketplace intelligence |
Forecast values for 2025–2026.
A mature intelligence system should also include data-quality controls. Duplicate products should be identified, anomalous prices should be flagged, missing fields should be monitored, and seller identities should be standardized where possible.
For brands, this creates a single analytical layer for answering questions across multiple dimensions:
Who is selling? Seller intelligence.
What are they selling? Product and assortment intelligence.
Where are they selling? Marketplace coverage.
At what price? Pricing intelligence.
How is performance changing? Historical monitoring.
This structure transforms marketplace research from a periodic manual task into an ongoing decision-support capability.
Why Choose a Dedicated Data Extraction Partner?
A scalable data partner can help brands convert fragmented marketplace information into structured datasets for competitive intelligence. Assortment and availability monitoring, marketplace seller intelligence Data for brands can support recurring collection of seller, product, pricing, stock, rating, and review signals. Product Data Scrape can help businesses structure these records for dashboards, databases, research platforms, and analytics workflows. The focus should be on consistent schemas, timestamped observations, product matching, seller identification, and scalable delivery. For brands, this reduces repetitive marketplace research and creates a stronger foundation for pricing, assortment, competitor, and seller-performance decisions. The resulting intelligence can be adapted to different marketplaces, categories, geographies, and monitoring frequencies according to business requirements.
Conclusion
Marketplace competition is increasingly complex because brands must track not only competitors but also third-party sellers, duplicate listings, changing prices, assortment shifts, and product availability. Brand Protection, marketplace seller intelligence Data for brands can help organizations identify unusual seller activity, monitor product distribution, and create a historical record of marketplace changes.
The strongest approach combines seller discovery, product mapping, pricing analysis, assortment monitoring, and recurring data collection. This gives brand teams a consistent view of marketplace activity instead of relying on occasional manual checks.
For organizations managing large catalogs, the resulting intelligence can support pricing strategy, marketplace operations, competitive research, and brand governance.
Ready to turn marketplace activity into actionable brand intelligence? Partner with Product Data Scrape to build scalable seller, product, price, and assortment datasets that help your team monitor competition and make faster marketplace decisions.
FAQs
1. What is marketplace seller intelligence?
Marketplace seller intelligence combines seller, product, pricing, assortment, availability, rating, and review data to help brands understand marketplace competition and identify meaningful seller-level changes.
2. Why should brands monitor third-party sellers?
Third-party seller monitoring helps brands identify unauthorized distribution, aggressive pricing, expanding competitors, assortment changes, and potential marketplace risks before they materially affect performance.
3. How does product mapping improve competitive analysis?
Product mapping connects equivalent products across marketplaces, allowing brands to compare seller counts, prices, availability, and assortment accurately instead of comparing unrelated listings.
4. How often should seller data be collected?
Collection frequency should match product volatility and business priorities. High-value products and competitive categories can be monitored more frequently than stable long-tail marketplace listings.
5. Can Product Data Scrape support seller intelligence?
Yes. Product Data Scrape can help brands build structured marketplace datasets covering sellers, products, prices, availability, ratings, reviews, and historical observations for recurring competitive analysis.


 Singapore
 EMAIL
EMAIL
 PHONE
PHONE















.webp)






