Introduction
Every year, around the major Indian festive season, a familiar claim appears: grocery prices rise before the festival.
Sometimes the claim is right. Often it is measuring something else entirely — and the something else is one of the most instructive traps in retail data analysis, because the error is invisible in the output. The number looks like inflation. It reads like inflation. It is, quite frequently, mix.
Festive grocery price scraping is genuinely valuable. It informs procurement, promotional planning, trade investment, and category strategy in the highest-volume weeks of the Indian retail year. But it has to be measured in a specific way, and almost every casual analysis of it makes at least one of three errors that reverse the conclusion.
This guide covers what actually happens to grocery prices around Indian festivals, the three measurement traps, and how to build an analysis whose conclusion survives being checked.
What Makes the Festive Grocery Basket Different
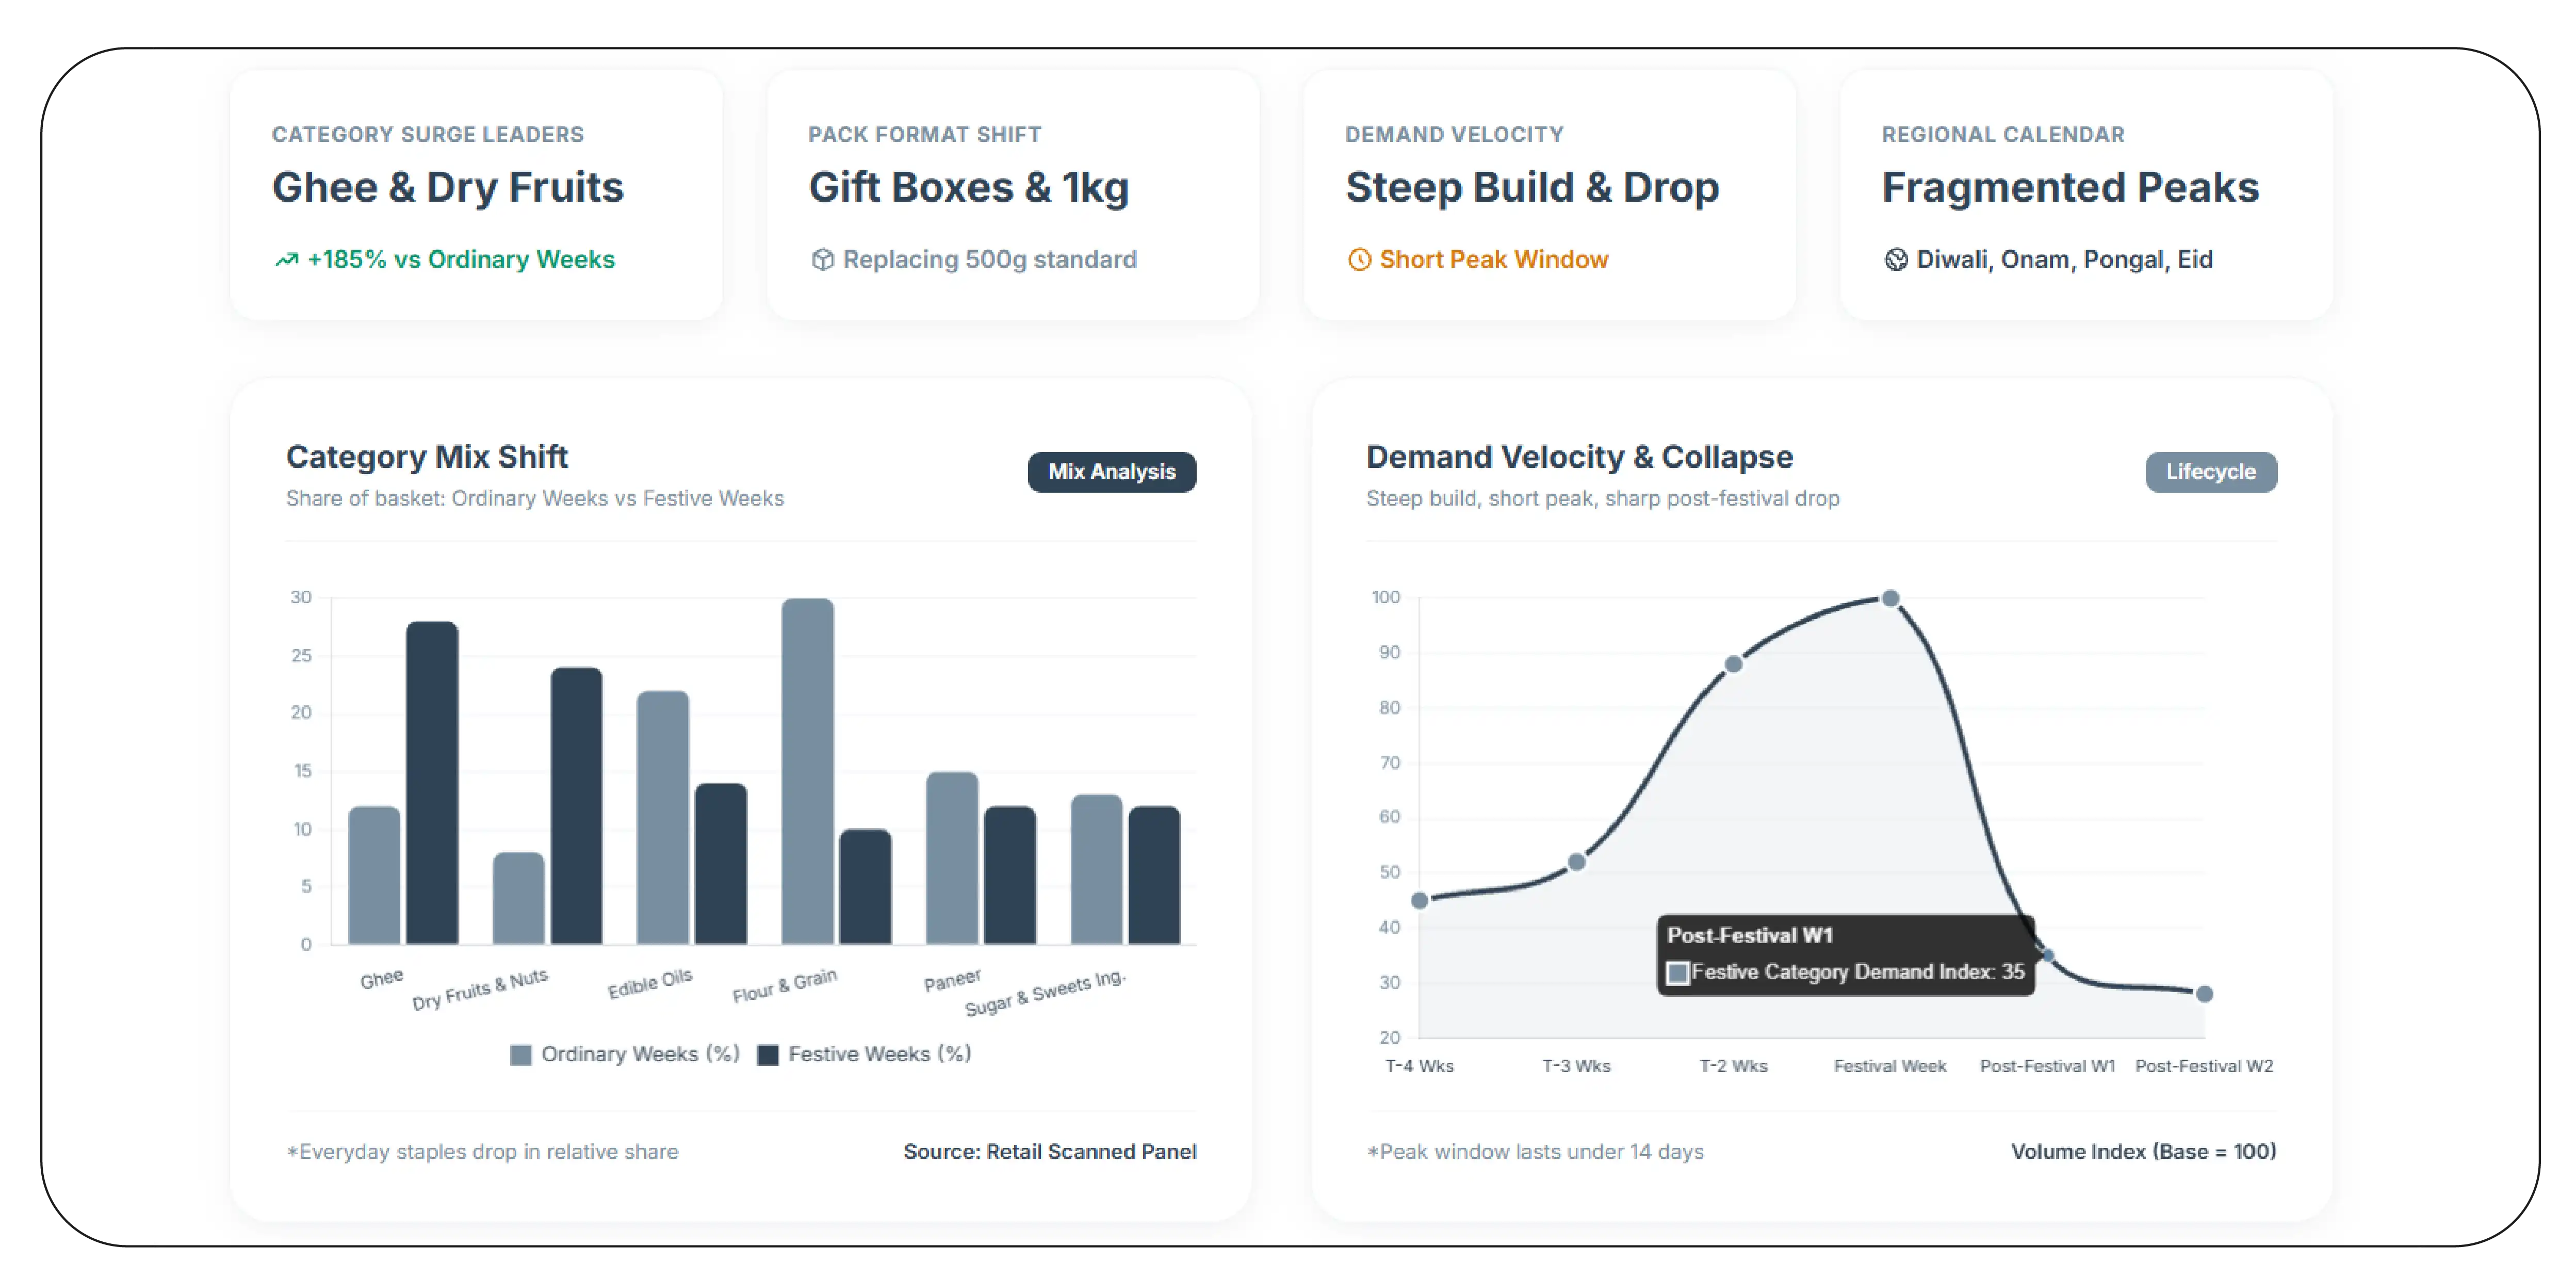
Festive grocery is not the ordinary basket at a different price. It is a different basket, and this is the root of most of the analytical difficulty.
The category mix shifts sharply. Ghee, dry fruits and nuts, edible oils, flour and grain, paneer, sugar, and sweets ingredients surge. Everyday staples do not disappear, but their share of the basket falls as festive categories expand.
Pack formats proliferate. Gift packs, hampers, combination packs, and larger festive formats appear alongside — and frequently in place of — the standard packs stocked the rest of the year. A brand that sells a 500 g pack in ordinary weeks may be selling primarily a 1 kg gift-boxed format in festive weeks.
Premium tiers gain share. Festive purchasing skews toward premium and gifting-grade variants within the same category. The customer buying ghee for a festival buys differently from the customer buying ghee in March.
Demand is time-concentrated and then collapses. The build is steep, the peak is short, and post-festival demand in festive categories drops sharply.
The calendar is regional. Diwali, Onam, Pongal, Durga Puja, Ganesh Chaturthi, and Eid fall at different times and dominate in different regions. A national "festive season" analysis averages across regions whose peaks are weeks apart, blurring every pattern it is trying to detect.
Every one of these features is a reason the naive analysis breaks.
Trap One: Mix Shift Looks Exactly Like Inflation
This is the big one, and it is worth working through carefully because it is so easy to fall into.
Suppose you track the average basket price in a grocery category across the festive window. You find it rises 18% in the four weeks before the festival. The headline writes itself.
Now decompose it. Here is an illustrative version of what is frequently happening underneath:
| Week |
Standard pack share |
Premium/gift pack share |
Standard pack price |
Premium pack price |
Average basket price |
| T-6 |
85% |
15% |
320 |
690 |
375 |
| T-4 |
70% |
30% |
320 |
690 |
431 |
| T-2 |
52% |
48% |
322 |
695 |
501 |
| T-1 |
45% |
55% |
322 |
695 |
527 |
Illustrative figures.
The average basket price rose from 375 to 527 — a 41% increase. And the price of the standard pack moved from 320 to 322, while the premium pack moved from 690 to 695. Neither product got meaningfully more expensive. The customer bought a different product.
That is mix shift. It is a real and important commercial phenomenon — it tells you a great deal about festive purchasing behaviour — but it is not price inflation, and reporting it as inflation is simply wrong.
The only honest measure of festive price movement is same-SKU tracking: follow the identical product, identical pack size, identical variant, across the window, and observe what happened to its price. Everything else is measuring the basket, not the price.
Trap Two: There Is No Baseline
The second error is structural and, unlike the first, cannot be fixed after the fact.
To say anything about festive discounting or festive price movement, you need to know what the price was before the festive window. Not the MRP — the actual street price at which the product was routinely selling in ordinary weeks.
Most analyses begin when the festive season begins. At that point the pre-festive price is no longer observable, and it cannot be reconstructed. The analysis is then forced to fall back on MRP as the reference, which produces discount figures that are arithmetically correct and commercially meaningless, because almost nothing in Indian grocery sells at MRP.
Start capturing at least 30 days before the festive window opens, and ideally 60. The trailing median street price per SKU over that window is the reference against which everything else is measured. It is inexpensive to collect and impossible to backfill.
It is also worth stating what a pre-festive baseline does not license. Observing that a product's price rose before a festival and fell during it is consistent with several explanations — procurement cost movement, seasonal supply and demand, promotional structure, or pre-promotion price setting. Price data records the sequence. It does not establish intent, and analyses that leap from the former to the latter on illustrative or partial data are making a claim their evidence does not carry.
Trap Three: The National Average Hides the Regional Calendar
India does not have a festive season. It has several, staggered across the calendar and concentrated in different states.
An analysis that pools all regions into a national series will find a peak that is broader and flatter than any real regional peak, because it is summing curves whose maxima fall in different weeks. Every pattern — build rate, peak sharpness, post-festival collapse — is understated.
Regional segmentation is not a refinement here. It is the difference between seeing the pattern and seeing an artefact of aggregation. The analysis should be run per region against that region's dominant festival calendar, and only then compared.
Building the Analysis Properly
Putting the three fixes together produces a workable design.
Capture window: T-60 to T+21. Sixty days of pre-festive baseline, the full festive window, and three weeks after — because the post-festival price restoration curve is one of the most informative and least collected parts of the whole series.
Frequency: daily, minimum. Festive-period promotions and pack availability change fast. Weekly capture misses most of the movement.
Unit: same SKU, same pack, unit-normalised. Track identical products. Where pack formats change, normalise to per kilogram or per litre and retain the raw pack size so the normalisation is auditable.
Segmentation: by region, by category, by pack format tier. Standard, premium, and gift formats are tracked as separate series, not merged.
Fields: base price, promotional price, promotion type, availability, pack format, and location. Availability matters more than usual here — festive stockouts are common and a price series that ignores whether the product could be bought overstates its own relevance.
Sample Data: One SKU Across the Festive Window
An illustrative same-SKU series for a single grocery product in one region.
| Point in window |
Base price |
Promo price |
Effective price |
Availability |
vs T-60 median |
| T-60 to T-31 (median) |
545 |
— |
545 |
In stock |
baseline |
| T-30 |
545 |
— |
545 |
In stock |
0% |
| T-14 |
549 |
499 |
499 |
In stock |
−8.4% |
| T-3 |
549 |
479 |
479 |
Low stock |
−12.1% |
| T-1 |
549 |
479 |
479 |
Out of stock |
−12.1% |
| T+3 |
549 |
— |
549 |
In stock |
+0.7% |
| T+14 |
545 |
— |
545 |
In stock |
0% |
Illustrative series.
This is what a clean festive series looks like, and it tells a coherent story that none of the three traps would have produced.
The base price barely moved across the entire window — 545 to 549 and back. The effective price fell more than 12% at the festive peak, entirely through promotion rather than base-price change. And the product was out of stock on the single highest-demand day, which means the deepest discount of the season was partly unavailable to the customers it was designed for.
That last row is the commercially important one, and it only exists because availability was captured alongside price. A price-only series would show a 12% festive discount and miss that it could not be bought.
The structured record at T-3:
{
  "product_id": "GROC-GHEE-1L-BRANDA",
  "region": "west",
  "location_id": "IN-400001",
  "captured_at": "2026-10-17T09:15:00+05:30",

  "festive_context": {
    "festival": "diwali",
    "days_to_peak": 3,
    "window_phase": "pre_peak"
  },

  "pack": {
    "size_value": 1,
    "size_unit": "L",
    "format_tier": "standard"
  },

  "pricing": {
    "base_price": 549,
    "promotional_price": 479,
    "effective_price": 479,
    "promotion_type": "festive_offer",
    "price_per_litre": 479.0,
    "baseline_median_t60_t31": 545,
    "vs_baseline_pct": -12.1
  },

  "availability_state": "low_stock",

  "mix_context": {
    "gift_format_available": true,
    "gift_format_price": 899,
    "gift_format_size_value": 1.5,
    "gift_format_price_per_litre": 599.3
  }
}
The mix_context block is what makes the mix-shift trap avoidable. The gift format is available at 899 for 1.5 litres — 599 per litre against the standard pack's 479. A basket-average analysis that swept both into one number would report festive prices rising. The per-SKU, per-format view shows the standard pack fell 12% and a differently-priced format appeared alongside it. Those are completely different findings.
What the Data Reliably Shows
Run properly, festive grocery price scraping supports several conclusions that hold up.
Promotional depth, not base-price movement, drives most festive price change. Base prices in staple grocery categories tend to be relatively stable across the festive window; the movement is in promotion.
Availability becomes the binding constraint at peak. Festive stockouts on discounted SKUs are common, which means measured discount depth systematically overstates the discount actually available to shoppers at peak.
Mix shift is large and category-specific. In gifting-adjacent categories — dry fruits, ghee, sweets ingredients — the format and premium-tier shift is dramatic. In everyday staples it is modest. A single national figure averages these into something meaningless.
Post-festival restoration is fast but not instant. Prices return toward baseline over days, not immediately, and the shape of that curve differs by category and retailer.
Regional peaks are genuinely distinct. Segmented by region and festival, the curves are sharper and the timing differences substantial.
Who Uses Festive Grocery Price Scraping
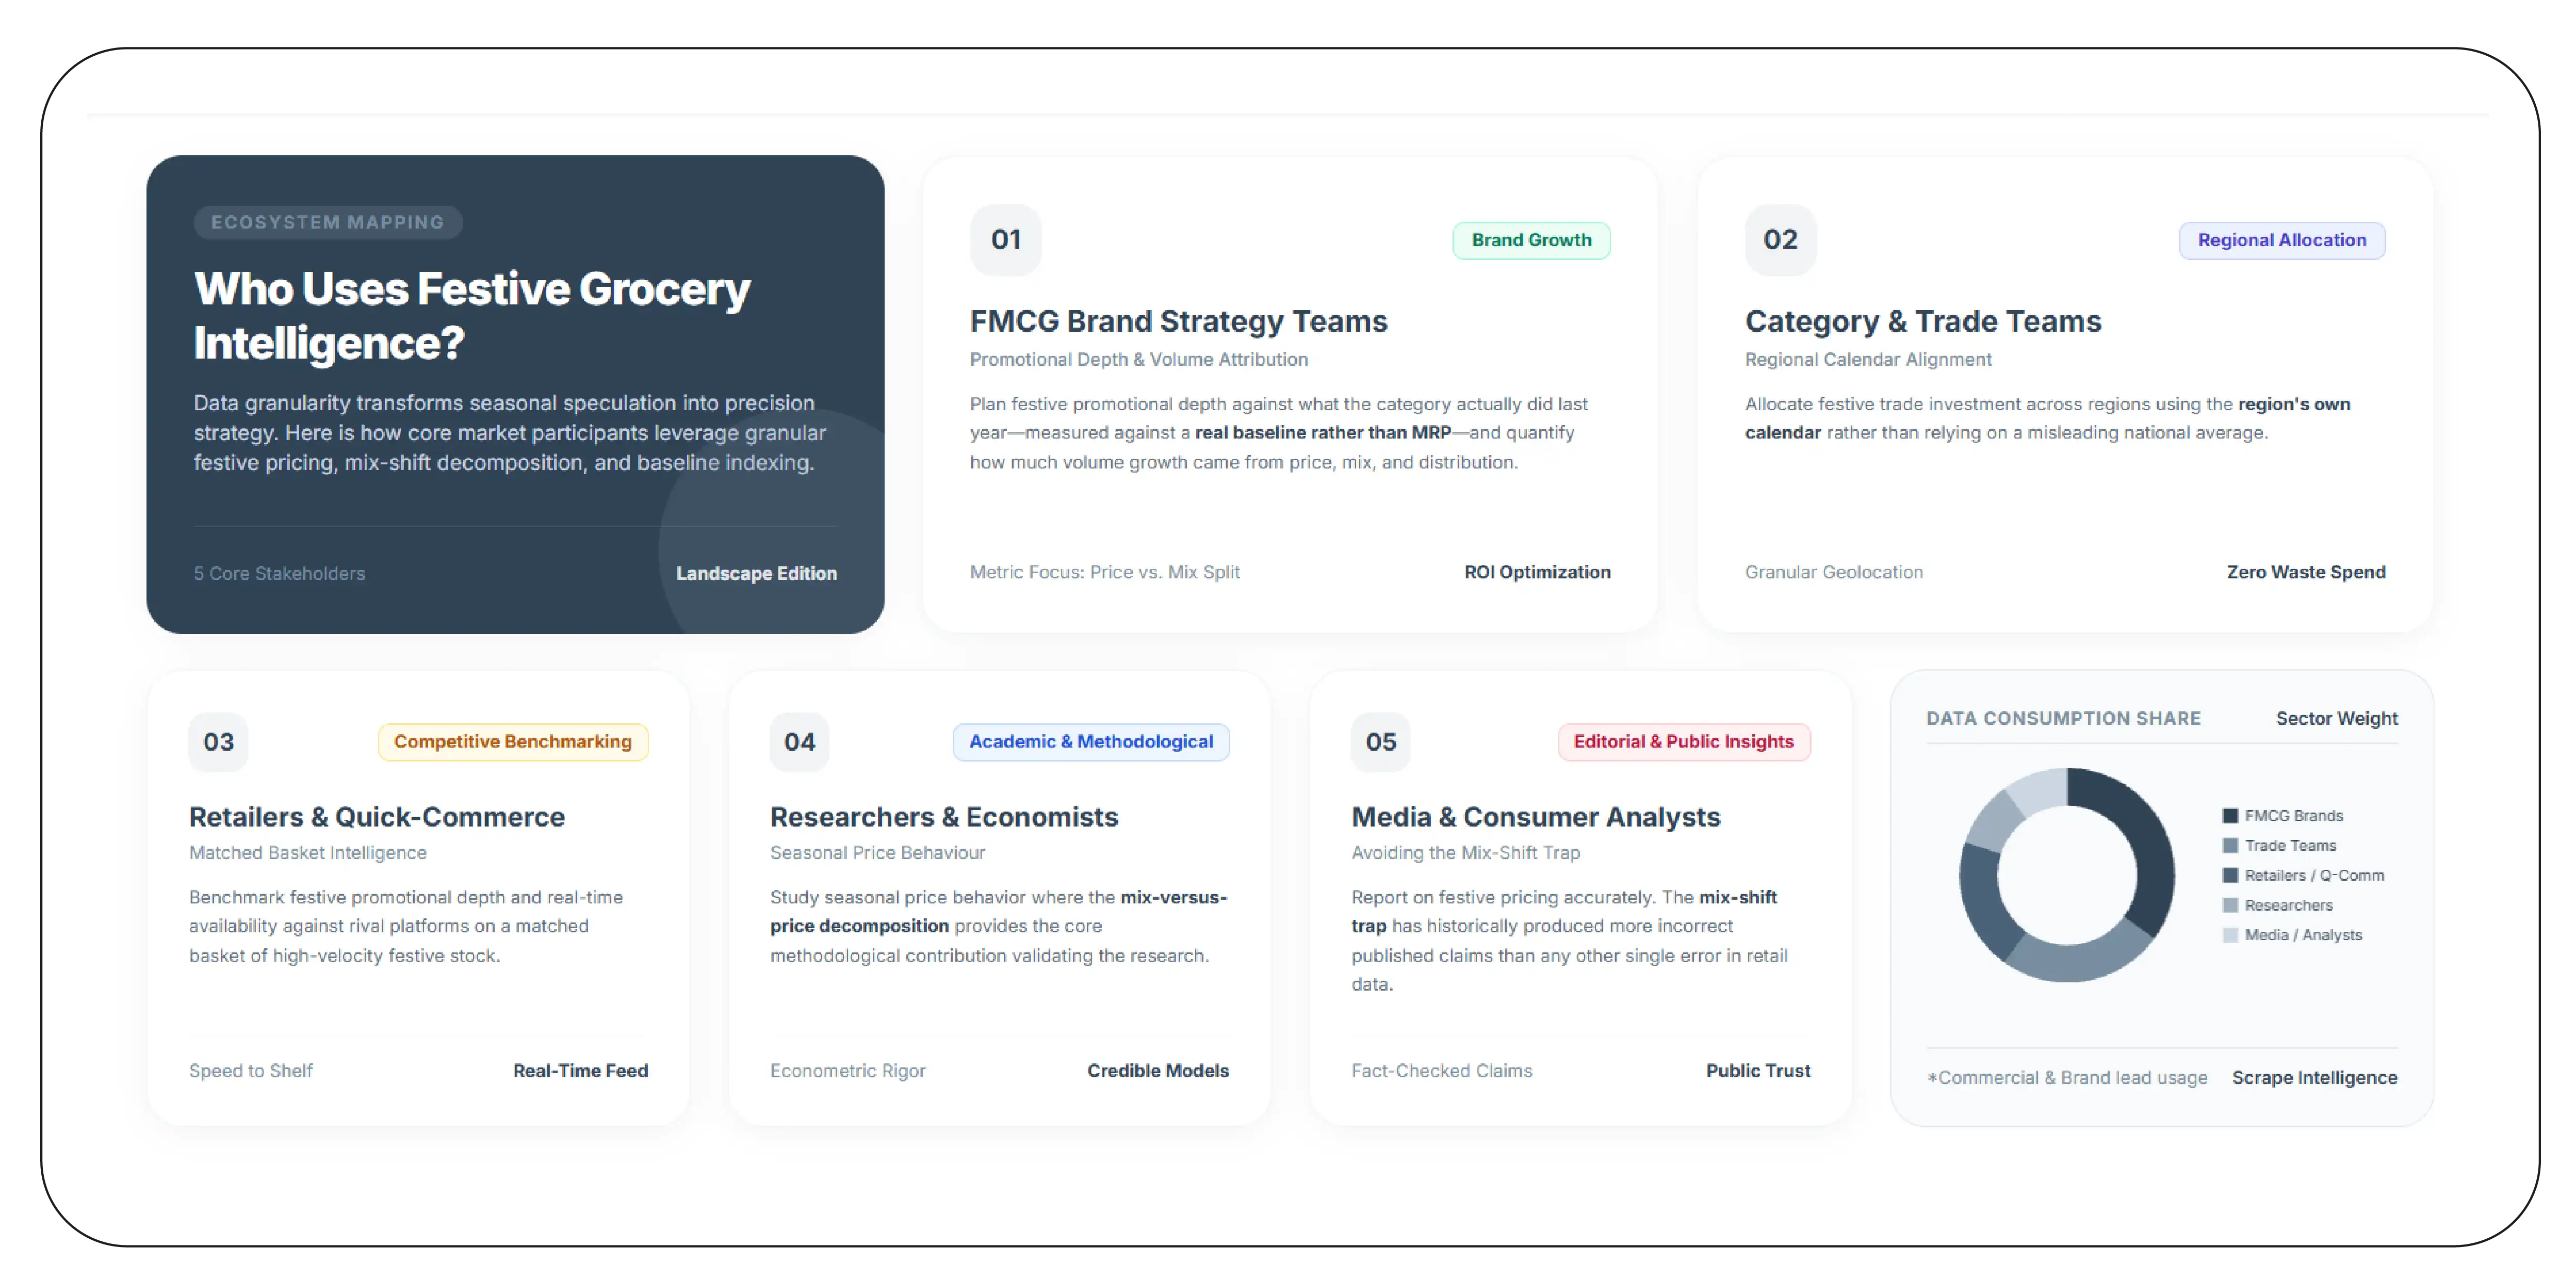
FMCG brands plan festive promotional depth against what the category actually did last year — measured against a real baseline rather than MRP — and quantify how much of their festive volume growth came from price, from mix, and from distribution.
Category and trade teams allocate festive trade investment across regions using the region's own calendar rather than a national average.
Retailers and quick-commerce operators benchmark festive promotional depth and availability against competitors on a matched basket.
Researchers and economists study seasonal price behaviour, where the mix-versus-price decomposition is precisely the methodological contribution that makes the work credible.
Media and consumer analysts report on festive pricing — a use case where the mix-shift trap has produced more incorrect published claims than any other single error in retail data.
Frequently Asked Questions
When should festive capture start?
Sixty days before the festive window, thirty at minimum. The baseline cannot be reconstructed later, which makes it the one component that must be collected in advance.
Can you separate mix shift from price change?
Yes — by tracking identical SKUs and pack formats as separate series rather than averaging a basket. This is the core methodological requirement.
Do you handle the regional festival calendar?
Yes. Analysis is segmented by region against that region's dominant festival, because a national pooled series flattens every peak it is meant to measure.
Does this data show whether prices were raised before a festival?
It shows the price sequence precisely, against a real pre-festive baseline. Interpreting that sequence as intentional requires evidence beyond price data, and we would advise treating any published claim of that kind with corresponding care.
Is availability captured alongside price?
Yes, and in festive analysis it is not optional — a deep discount on an out-of-stock SKU is not a discount anyone received.
Measure the Price, Not the Basket
The reason festive grocery pricing gets reported wrong so consistently is that the wrong measurement produces a more dramatic number. A basket average that rises 41% is a better headline than a same-SKU series that fell 12% on promotion while a premium format appeared alongside it.
The second one is what happened. And it is the version a category manager can plan against, a brand can invest against, and a researcher can publish without it falling apart on review.
Product Data Scrape delivers festive grocery price scraping across Indian grocery retailers, marketplaces, and quick-commerce platforms: pre-festive baseline capture from T-60, daily or faster capture through the window, same-SKU and per-format tracking, unit-price normalisation, base and promotional price separation, regional segmentation against the local festival calendar, and availability state on every record.
Delivered as JSON, CSV, via REST API, or pushed to your warehouse.
The festive window is a few weeks. The baseline that makes it interpretable takes two months, and it cannot be collected afterwards. Talk to our team before the calendar closes in.
Product Data Scrape — turning marketplace complexity into decision-ready data.


 Singapore
 EMAIL
EMAIL
 PHONE
PHONE

















.webp)






