Introduction
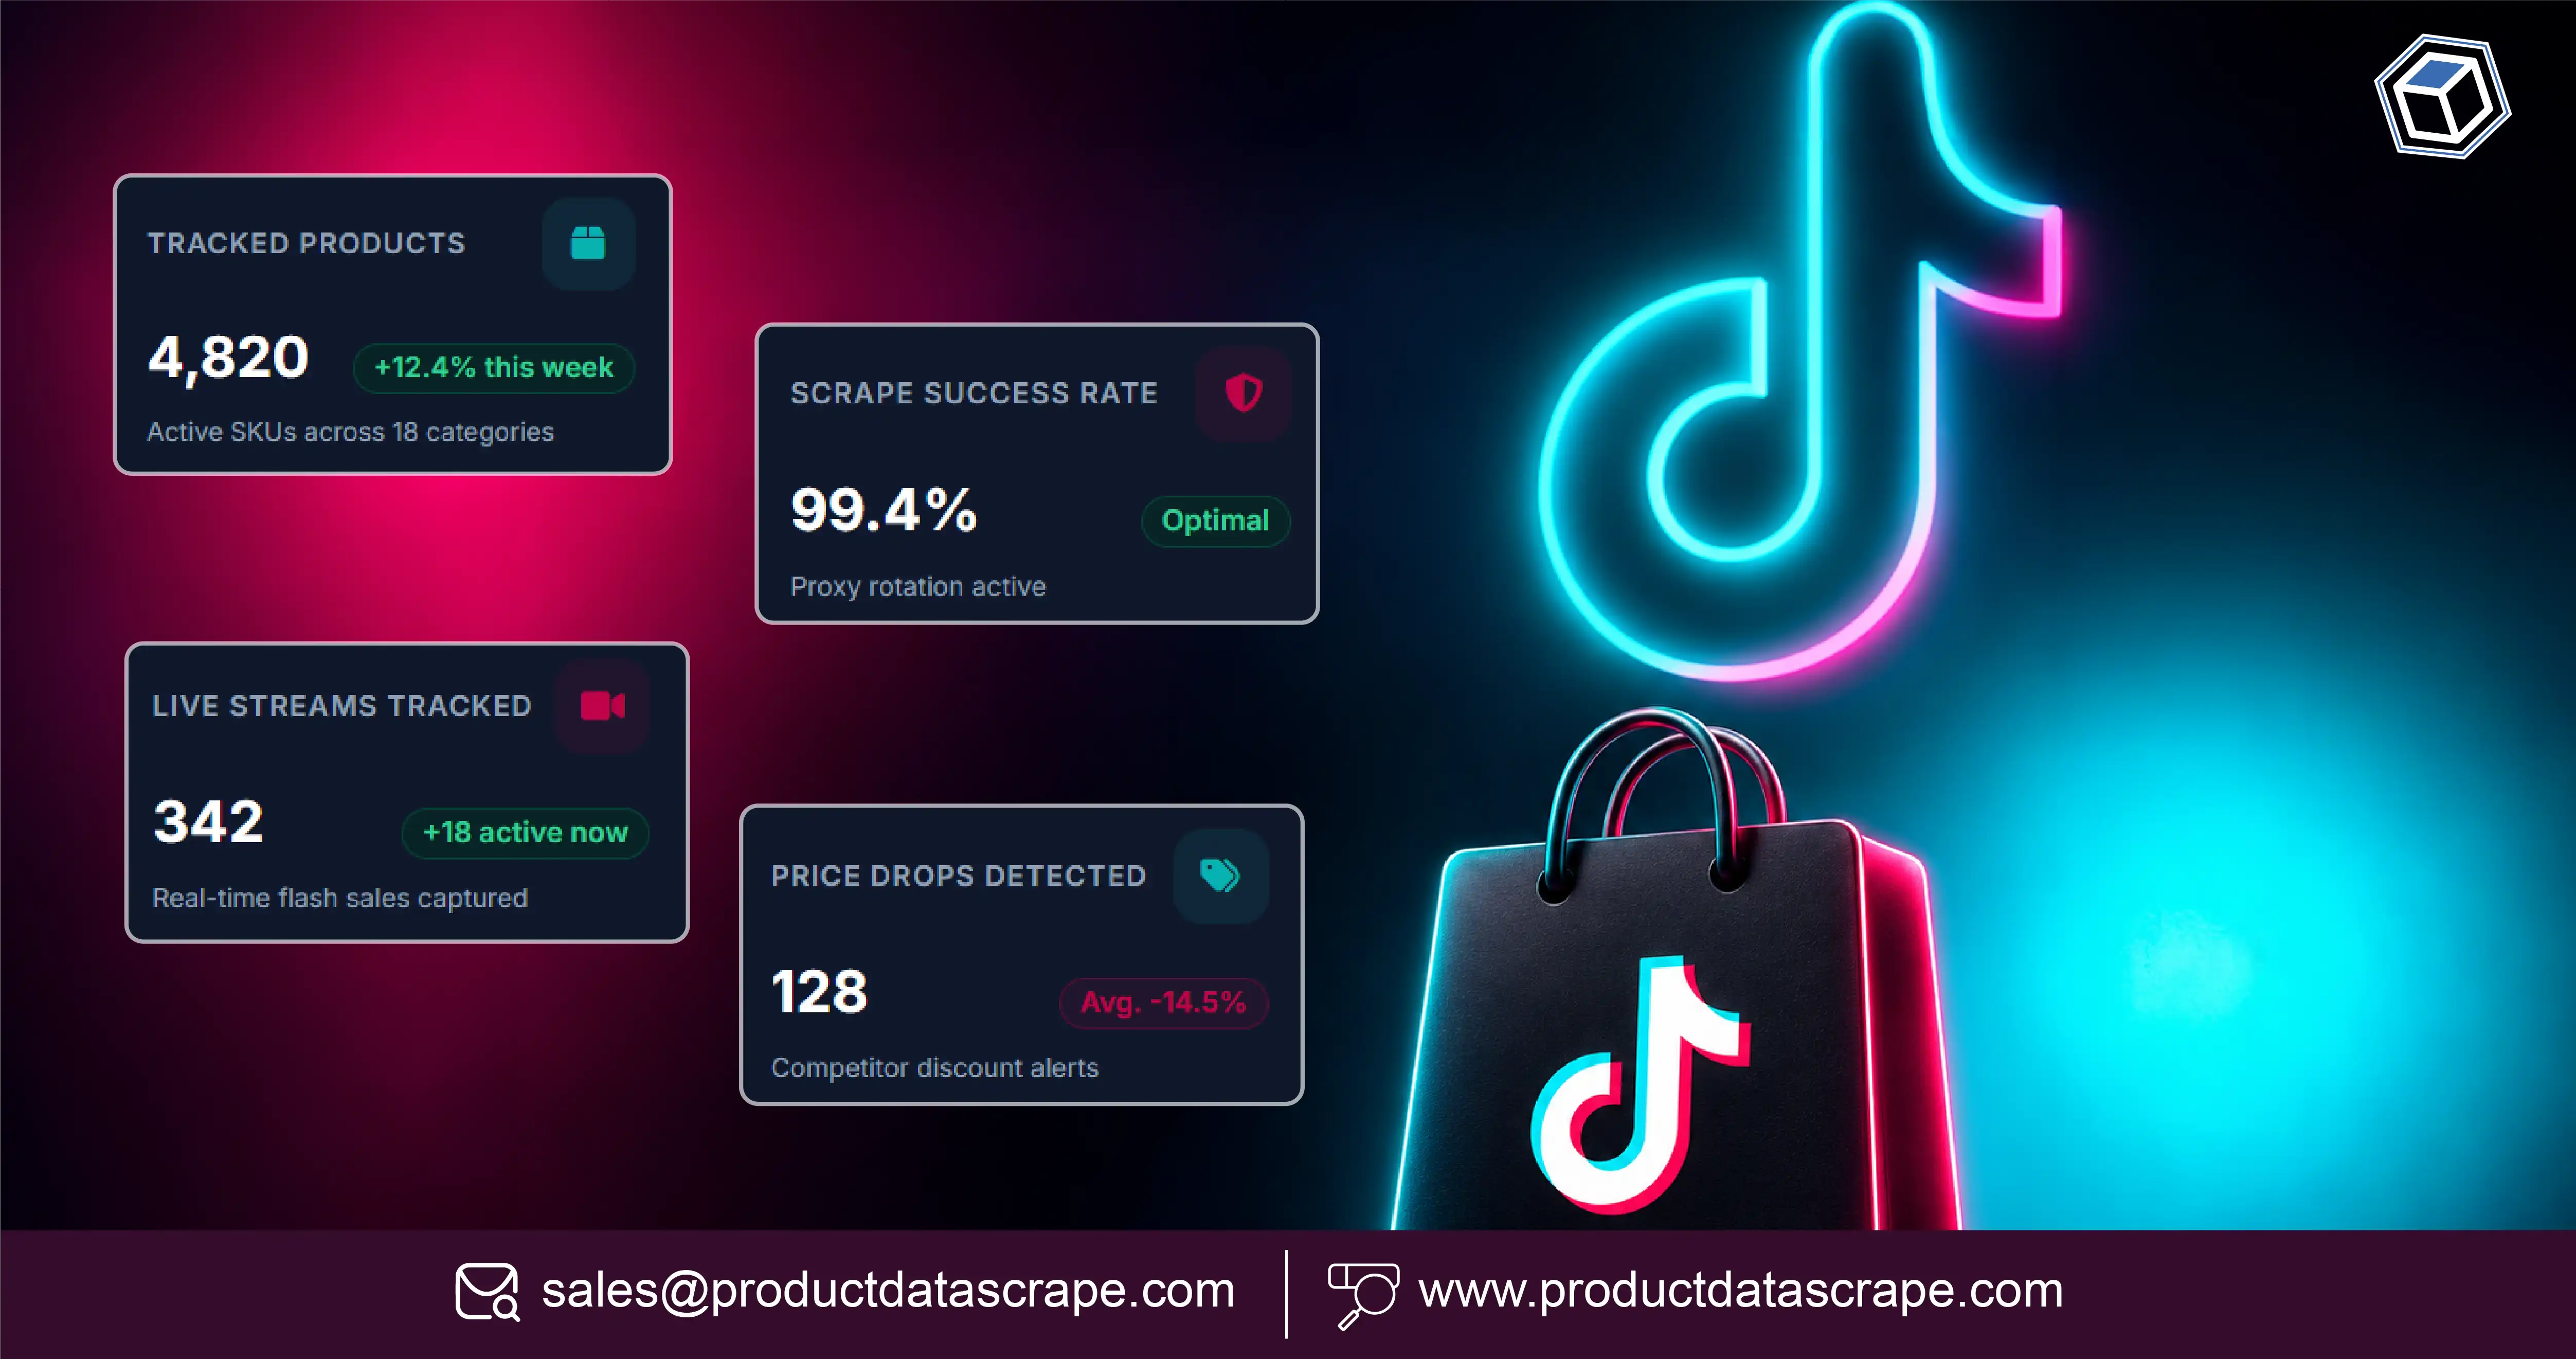
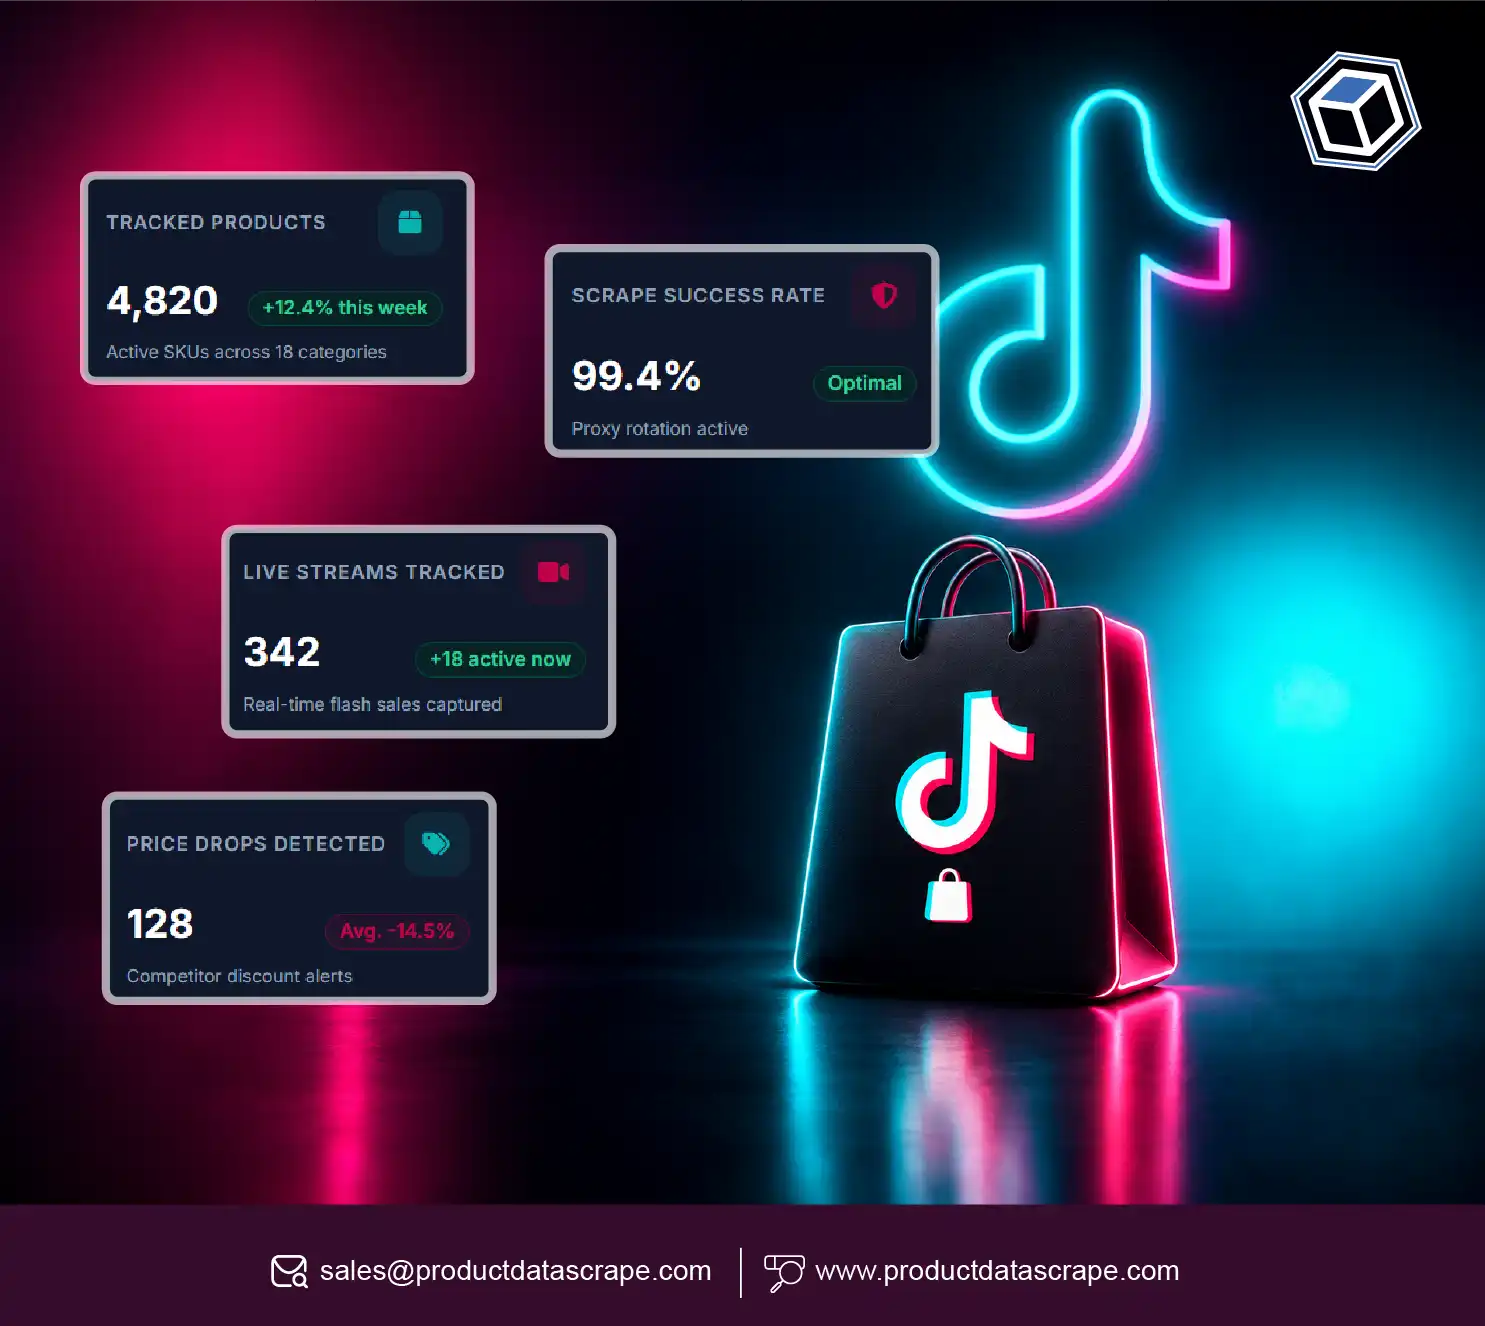
TikTok Shop has created new opportunities for brands, retailers, and online sellers to discover products, monitor competitors, and understand creator-led shopping behavior. TikTok Shop Data Scraping helps businesses organize publicly accessible product listings, prices, seller details, promotional information, and live-stream shopping signals into structured datasets. This enables faster product research, better assortment decisions, and more informed pricing strategies.
For brands struggling to track rapidly changing product trends, manual research can be time-consuming and inconsistent. Automated data collection helps teams monitor relevant product information at scale and identify changes that deserve further investigation. Combined with Competitive pricing data, these insights can support competitor benchmarking, promotional planning, product discovery, and market opportunity analysis.
This guide explains six practical ways businesses can use structured TikTok Shop information, what to monitor from 2020 to 2026, and how to turn collected data into actionable commercial intelligence.
How Can Brands Organize Product and Live-Stream Information?
Brands need a consistent view of product listings and live-stream shopping activity to understand how products are presented, promoted, and positioned in a competitive marketplace. Scraping TikTok Shop & Live-Stream Product Data creates a structured foundation for comparing product attributes across relevant listings and shopping events.
A useful dataset can include product titles, brands, categories, listed prices, discounts, seller information, ratings, review counts, availability, product URLs, and publicly visible live-stream details. Depending on access and platform availability, teams may also record featured products, promotional claims, stream timestamps, and product links associated with shopping content.
For example, a beauty brand researching competitors could compare listings for moisturizers, cleansers, and sunscreen products. A consumer electronics seller could monitor phone accessories, wireless earbuds, and charging devices. These comparisons help analysts identify differences in pricing, product positioning, and assortment.
TikTok Shop Data Scraping can help automate the collection and organization of permitted, publicly accessible information. However, product visibility and live-stream data availability may vary, and not every interaction or sales metric is publicly accessible.
A structured workflow should include data validation, duplicate detection, timestamping, and consistent product identifiers. These measures make it easier to distinguish genuine product changes from inconsistent records.
| Product field |
Business application |
| Product title and category |
Product discovery and assortment analysis |
| Brand and seller |
Competitor identification |
| Listed price and discount |
Price benchmarking |
| Rating and review count |
Customer feedback analysis |
| Availability |
Listing and assortment monitoring |
| Live-stream product references |
Promotion and content research |
The main benefit is operational clarity: teams can spend less time assembling spreadsheets and more time interpreting product and promotional patterns.
How Can Historical Trend Research Reveal Emerging Opportunities?
Product trends change as consumer preferences, creator recommendations, seasonal demand, and promotional strategies evolve. Businesses need a repeatable way to examine which categories are gaining attention and which products are becoming more visible in their competitive landscape. Scrape TikTok Shop Trend Research Data to build comparable snapshots of publicly accessible product information over time.
Historical comparisons are especially valuable when researchers preserve collection dates and apply consistent category definitions. Without these controls, an increase in observed listings might reflect a broader collection scope rather than a genuine market change.
For example, a skincare retailer could compare the appearance of facial serums, sunscreen, and beauty tools across monthly product snapshots. A snack brand might examine the visibility of protein snacks, specialty beverages, and convenient meal products. By analyzing these patterns, businesses can Spot trending products and identify potential market opportunities. These observations can guide further research, but product visibility alone does not prove consumer demand or actual sales.
The following table illustrates how a business could organize a 2020–2026 research timeline. It is a framework for analysis, not a claim about measured TikTok Shop performance in each year.
| Period |
Research focus |
Data to compare |
| 2020–2021 |
Establishing an e-commerce baseline |
Product assortment and listed prices |
| 2022 |
Improving category comparisons |
Brand coverage and listing changes |
| 2023 |
Expanding creator-commerce research |
Featured products and public promotional information |
| 2024 |
Standardizing recurring monitoring |
Price changes and category visibility |
| 2025 |
Improving competitive benchmarking |
Seller assortment and promotional patterns |
| 2026 |
Supporting faster research cycles |
Refresh frequency, data quality, and trend indicators |
Teams should distinguish observed facts from interpretations. A product appearing in more monitored listings may indicate wider availability or stronger seller coverage, but it does not independently establish that the product is trending.
By combining historical snapshots with category-level analysis, researchers can identify patterns worth investigating, prioritize product opportunities, and produce evidence-based recommendations.
How Does Live-Stream Product Monitoring Support Better Decisions?
Live-stream shopping combines product discovery, demonstrations, creator communication, and time-sensitive promotions. For brands, understanding this environment means examining both the product being promoted and the context in which it appears. TikTok Live-Stream Product Data Extraction can organize available product-related information from permitted sources into a research-ready structure.
A practical workflow may capture product names, brand references, visible prices, promotional messages, product links, stream dates, and relevant timestamps where these details are available. Analysts can then compare product presentation across creators, categories, and promotional periods.
For instance, a cosmetics business might review which product types appear in monitored live-shopping sessions and how their displayed prices compare with standard listing prices. A home accessories seller could investigate whether product demonstrations coincide with changes in visible promotions or listing availability.
TikTok Shop Data Scraping helps connect these observations with broader product catalog information. Matching product identifiers, URLs, or normalized names can reduce the risk of treating the same item as multiple products.
The analysis should also recognize important limitations. A featured product is not necessarily a best-selling product, and a visible promotion does not prove that it generated additional conversions. Real-time price tracking can help businesses monitor price changes and promotional patterns, but sales, viewer engagement, and conversion metrics should only be included when they are available through authorized sources.
Brands can use live-stream research to develop questions for campaign planning, such as which product attributes receive attention, which offers are communicated clearly, and which categories merit closer competitor monitoring.
| Monitoring signal |
Possible analytical use |
Important limitation |
| Featured product |
Identify products highlighted in content |
Does not prove sales performance |
| Displayed discount |
Compare promotional messaging |
May not represent final checkout price |
| Stream date and time |
Compare activity across periods |
Requires consistent timestamps |
| Product link |
Connect content to a listing |
Links may change or expire |
| Repeated product appearances |
Identify recurring visibility |
Repetition does not prove demand |
This approach gives marketing and merchandising teams a more structured way to study creator-led commerce without confusing visible activity with verified commercial outcomes.
How Can Competitor Product Analysis Improve Positioning?
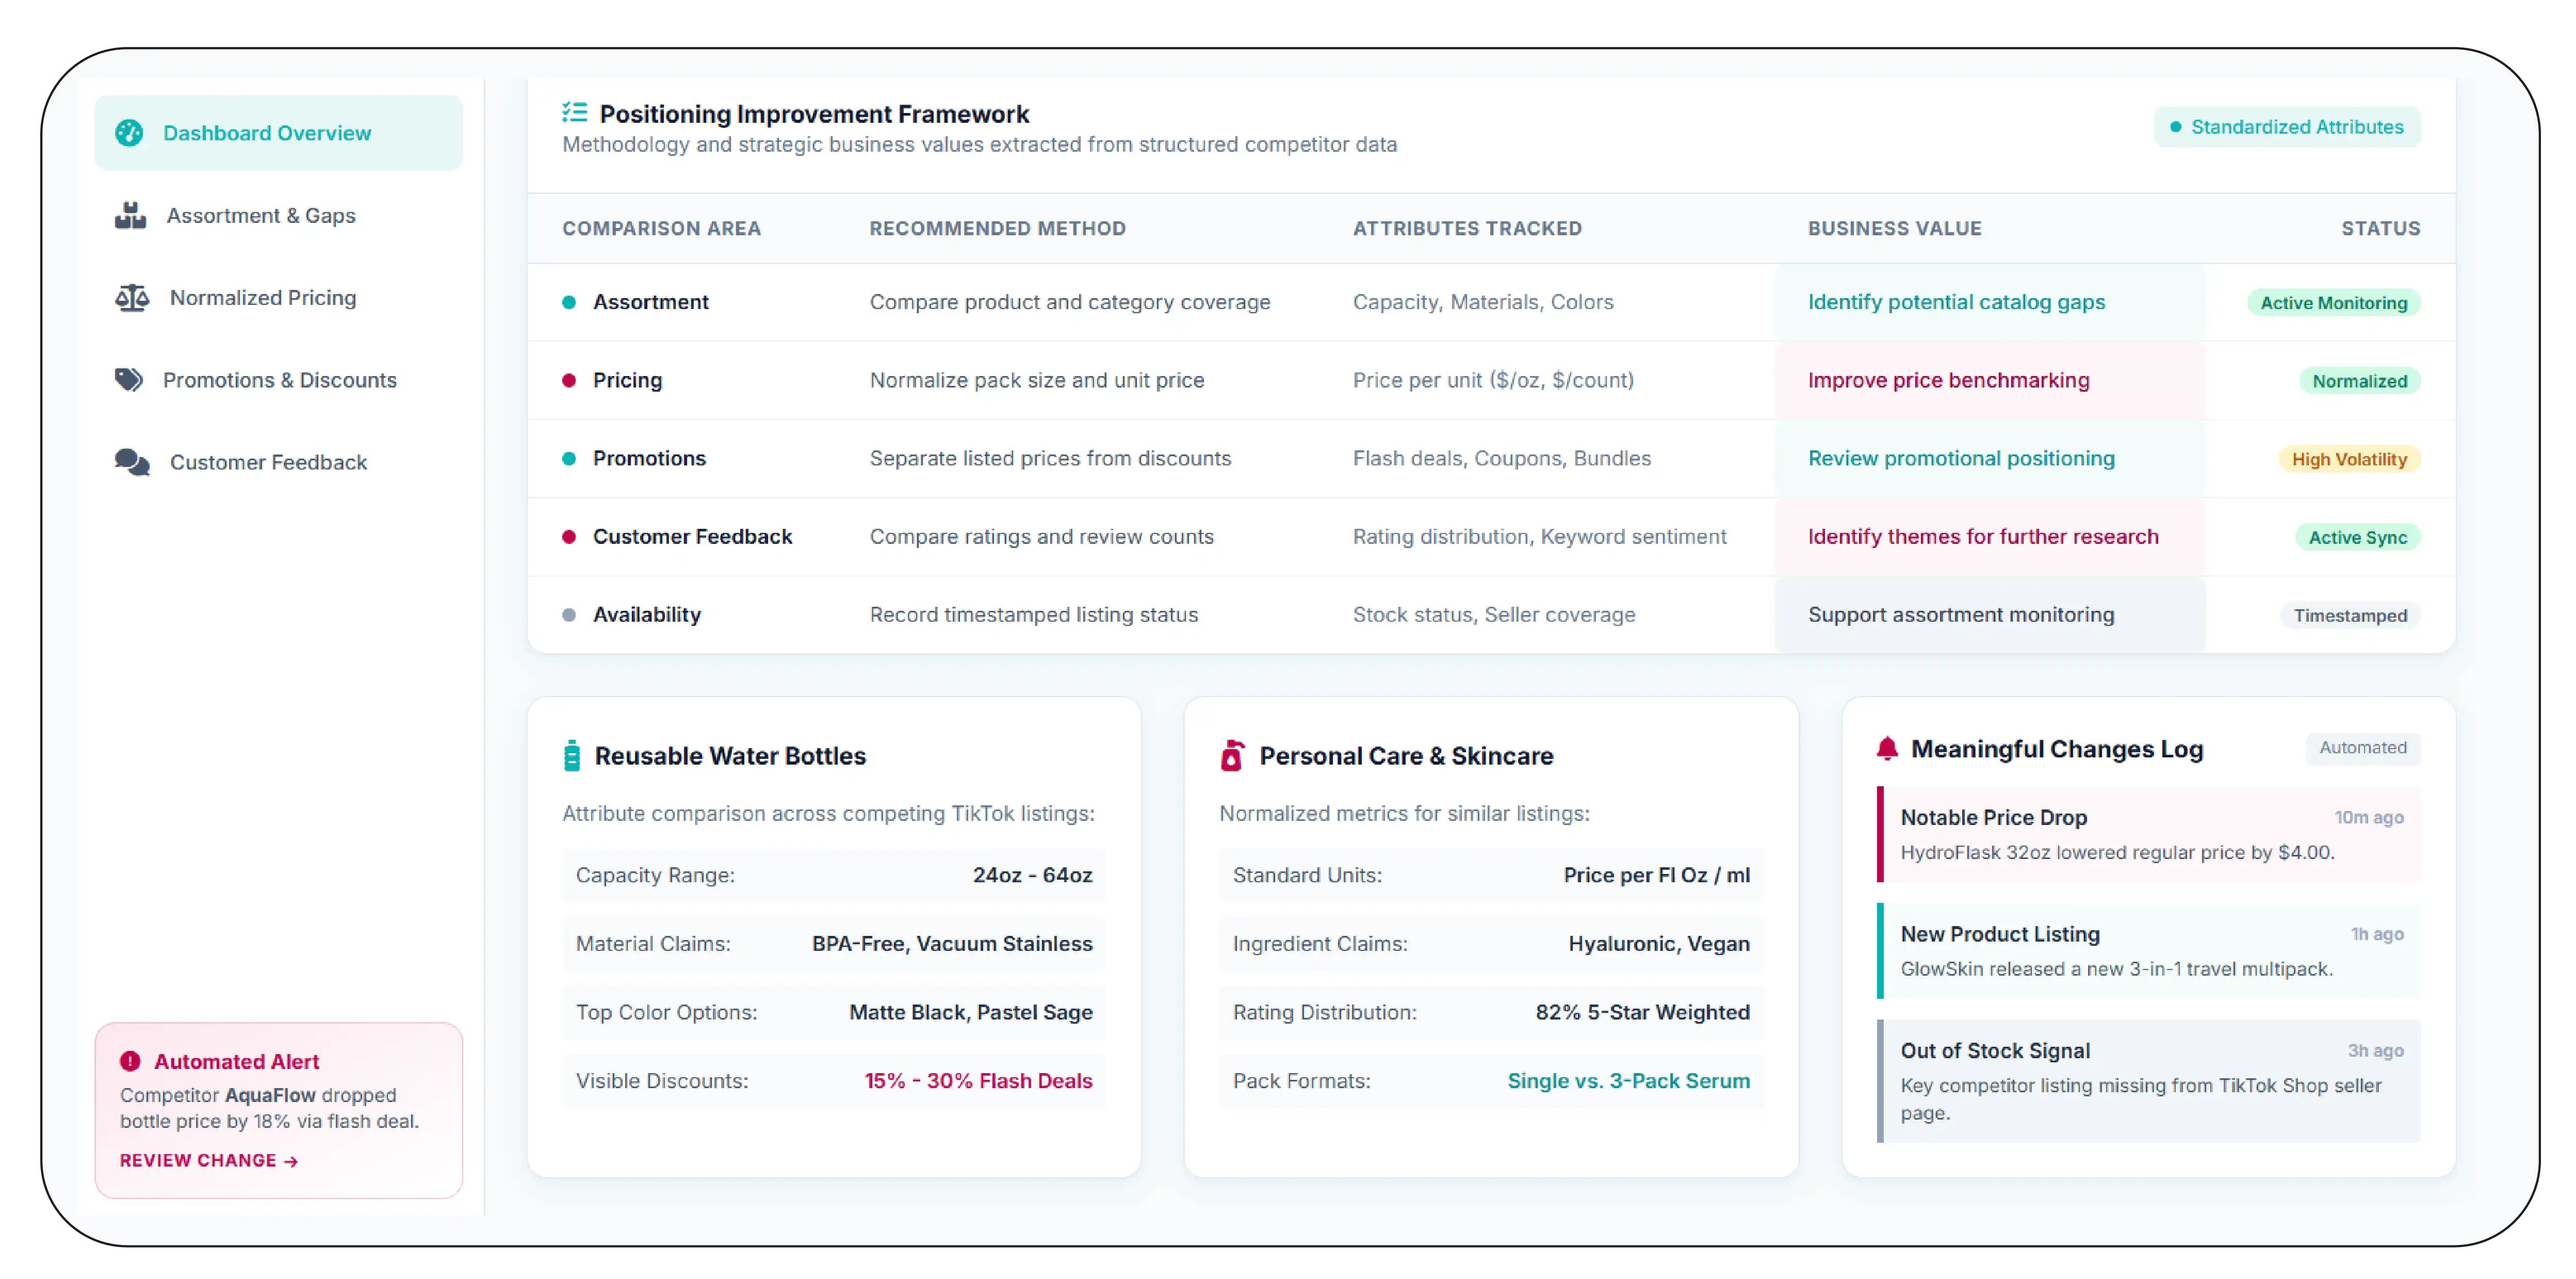
Competitive analysis helps brands understand how their products compare with similar offerings in the marketplace. It is most useful when businesses compare equivalent products, consistent attributes, and clearly defined competitor groups rather than collecting disconnected listings.
TikTok Shop Competitive Product Analysis can bring together product titles, categories, brands, pack sizes, listed prices, discounts, ratings, review counts, and seller information where available. The resulting dataset helps teams examine assortment differences and identify areas that deserve additional research.
Consider a brand selling reusable water bottles. Researchers could compare bottle capacity, material descriptions, available colors, visible discounts, and seller coverage across competing listings. A personal care company could compare product sizes, ingredient claims, price per unit, and rating distributions for similar products.
Price comparisons need particular care. A small package and a multipack should not be treated as directly comparable simply because their titles are similar. Analysts should normalize units, distinguish regular prices from promotional prices, and record when each observation was collected.
A competitor dashboard can also flag changes that warrant investigation. These may include a new product listing, a notable displayed price change, a missing product, or a shift in a seller's assortment. Automated alerts are most valuable when they identify meaningful changes rather than every minor update.
| Comparison area |
Recommended method |
Business value |
| Assortment |
Compare product and category coverage |
Identify potential catalog gaps |
| Pricing |
Normalize pack size and unit price |
Improve price benchmarking |
| Promotions |
Separate listed prices from discounts |
Review promotional positioning |
| Customer feedback |
Compare ratings and review counts |
Identify themes for further research |
| Availability |
Record timestamped listing status |
Support assortment monitoring |
The goal is not to copy competitors blindly. It is to use consistent evidence to understand market positioning, improve product differentiation, and make more informed merchandising decisions.
How Can Trending Product Signals Guide Product Selection?
Finding potential products early can help brands prioritize research, test new ideas, and refine their assortment. However, trend identification should rely on several signals rather than a single popular-looking listing. TikTok Trending Product Data Scraping can support structured monitoring of publicly visible product information across selected categories and sellers.
Useful indicators include changes in listing availability, the number of monitored sellers offering a product, repeated appearances in public shopping content, displayed promotional frequency, rating counts, and changes in category coverage. These signals provide context for further investigation; they should not be treated as verified sales or demand figures.
For example, a retailer researching travel accessories might monitor packing cubes, compact organizers, and portable toiletry containers. If multiple relevant listings appear across a broader set of monitored sellers, the retailer could investigate pricing, product differentiation, supplier availability, and customer feedback before deciding whether to expand its assortment.
The research process should also account for seasonality. A product that receives attention during a holiday period may not maintain the same visibility throughout the year. Comparing weekly or monthly snapshots can help analysts separate temporary promotions from longer-lasting patterns.
The table below provides illustrative monitoring metrics, not verified TikTok Shop market statistics. Businesses can use this structure to measure the quality and efficiency of their own research process.
| Internal KPI |
Example target |
What it measures |
| Product records processed per cycle |
50,000 |
Collection capacity |
| Required-field completeness |
95% or higher |
Data coverage |
| Duplicate-record rate |
Below 2% |
Record consistency |
| Time to prepare a category report |
Under 4 hours |
Research efficiency |
| Price-change review frequency |
Daily for selected products |
Monitoring cadence |
These targets should be adjusted to the project's scope and validated against actual operational results. They are not platform-wide benchmarks.
A disciplined trend workflow combines multiple signals, records uncertainty, and requires human review before major purchasing or marketing decisions. This reduces the risk of investing in products based on temporary visibility or incomplete information.
How Can Ongoing Monitoring Reveal Live-Shopping Changes?
Live-shopping strategies can change as creators, sellers, and brands test different products, messaging, and promotional formats. A one-time dataset provides only a snapshot, while repeated observations can reveal how visible product information changes over time. TikTok Live Shopping Trend Tracking provides a framework for organizing these observations into comparable research periods.
A monitoring workflow should define the products, categories, sellers, and public live-shopping sources relevant to the business. Collection schedules can then be set according to the speed at which the information changes and the project's research requirements.
For example, a brand may collect daily listing snapshots for a small group of priority products and weekly snapshots for broader category research. Publicly visible live-stream details can be recorded when accessible, with timestamps and source references retained for verification.
Analysts should compare like with like. If one week includes ten monitored creators and the next includes thirty, a higher number of featured products may reflect the expanded sample rather than a genuine change in live-shopping behavior. Monitoring dashboards should therefore document source coverage, collection frequency, missing observations, and changes in methodology.
A useful tracking report can contain three layers: observed data, calculated indicators, and business interpretation. Observed data includes the recorded product price or appearance. Calculated indicators summarize changes between collection periods. Business interpretation explains what the findings might mean and what should be investigated next.
| Reporting layer |
Example |
Purpose |
| Observed data |
A displayed price recorded with a timestamp |
Preserve evidence |
| Calculated indicator |
Percentage change between comparable observations |
Quantify movement |
| Business interpretation |
Review whether a promotion changes positioning |
Support decisions |
Businesses should also account for removed listings, inaccessible streams, changing URLs, and incomplete public information. These limitations should be documented instead of silently treated as zero activity.
A consistent monitoring program gives merchandising and marketing teams a stronger evidence base for reviewing promotions, prioritizing competitors, and deciding where deeper research is needed.
Why Choose Product Data Scrape?
Product Data Scrape supports structured e-commerce research by helping businesses turn publicly accessible product information into organized datasets for analysis. Its approach can support category monitoring, product comparison, price benchmarking, and recurring data workflows based on project requirements.
Businesses researching TikTok Shop data need more than a large volume of records. They need consistent product fields, practical validation, useful timestamps, and outputs that fit their reporting or analytics processes.
A well-designed TikTok Shop Data Scraping workflow can reduce repetitive manual research and make comparisons easier to reproduce. Data quality checks, duplicate handling, and clear source documentation also help teams interpret findings responsibly. Collection methods should respect platform terms, applicable laws, privacy requirements, and authorized access restrictions. The result is a more organized foundation for product intelligence and competitive research.
Conclusion
Brands can make better product and pricing decisions when they combine structured listing information, competitor comparisons, and publicly available live-shopping signals. A consistent research workflow helps teams identify meaningful changes, examine product positioning, and prioritize opportunities without mistaking visibility for confirmed sales performance.
From historical category snapshots to recurring product monitoring, the most useful datasets are accurate, timestamped, and organized around clear business questions. Product Data Scrape can help businesses develop data workflows suited to their research objectives and operational needs.
Ready to improve product discovery, competitor monitoring, and live-shopping research? Contact Product Data Scrape to discuss a tailored data collection solution for your business. Start with the categories and product attributes that matter most, then build a scalable process for turning e-commerce information into actionable insights.
Frequently Asked Questions
1. What product information can businesses collect from TikTok Shop?
Depending on availability and authorized access, businesses can organize product titles, brands, categories, displayed prices, discounts, seller details, ratings, review counts, availability, and product URLs.
2. How can brands monitor competitor prices?
Brands can compare timestamped listing prices, normalize pack sizes, distinguish regular prices from discounts, and review comparable products to identify changes in competitive positioning.
3. Can live-stream data prove a product is trending?
No. Repeated product appearances and promotional visibility can indicate research opportunities, but verified demand requires additional evidence, such as authorized sales data or reliable market research.
4. How frequently should product information be updated?
Update frequency depends on the business need. Priority products may require daily checks, while broader category comparisons may work with weekly or monthly snapshots.
5. How can Product Data Scrape support product research?
Product Data Scrape can help businesses structure product information, compare listings, and establish repeatable research workflows, subject to source availability and applicable access requirements.


 Singapore
 EMAIL
 PHONE










.webp)