Introduction
European marketplace sellers can monitor competitor prices affordably by tracking comparable product listings, recording price changes, and using structured data to identify pricing opportunities. Monitoring EU Marketplace Prices on a Budget helps retailers, brands, and distributors compete across Amazon.de, Kaufland, and Allegro without relying on expensive enterprise software or time-consuming manual checks.
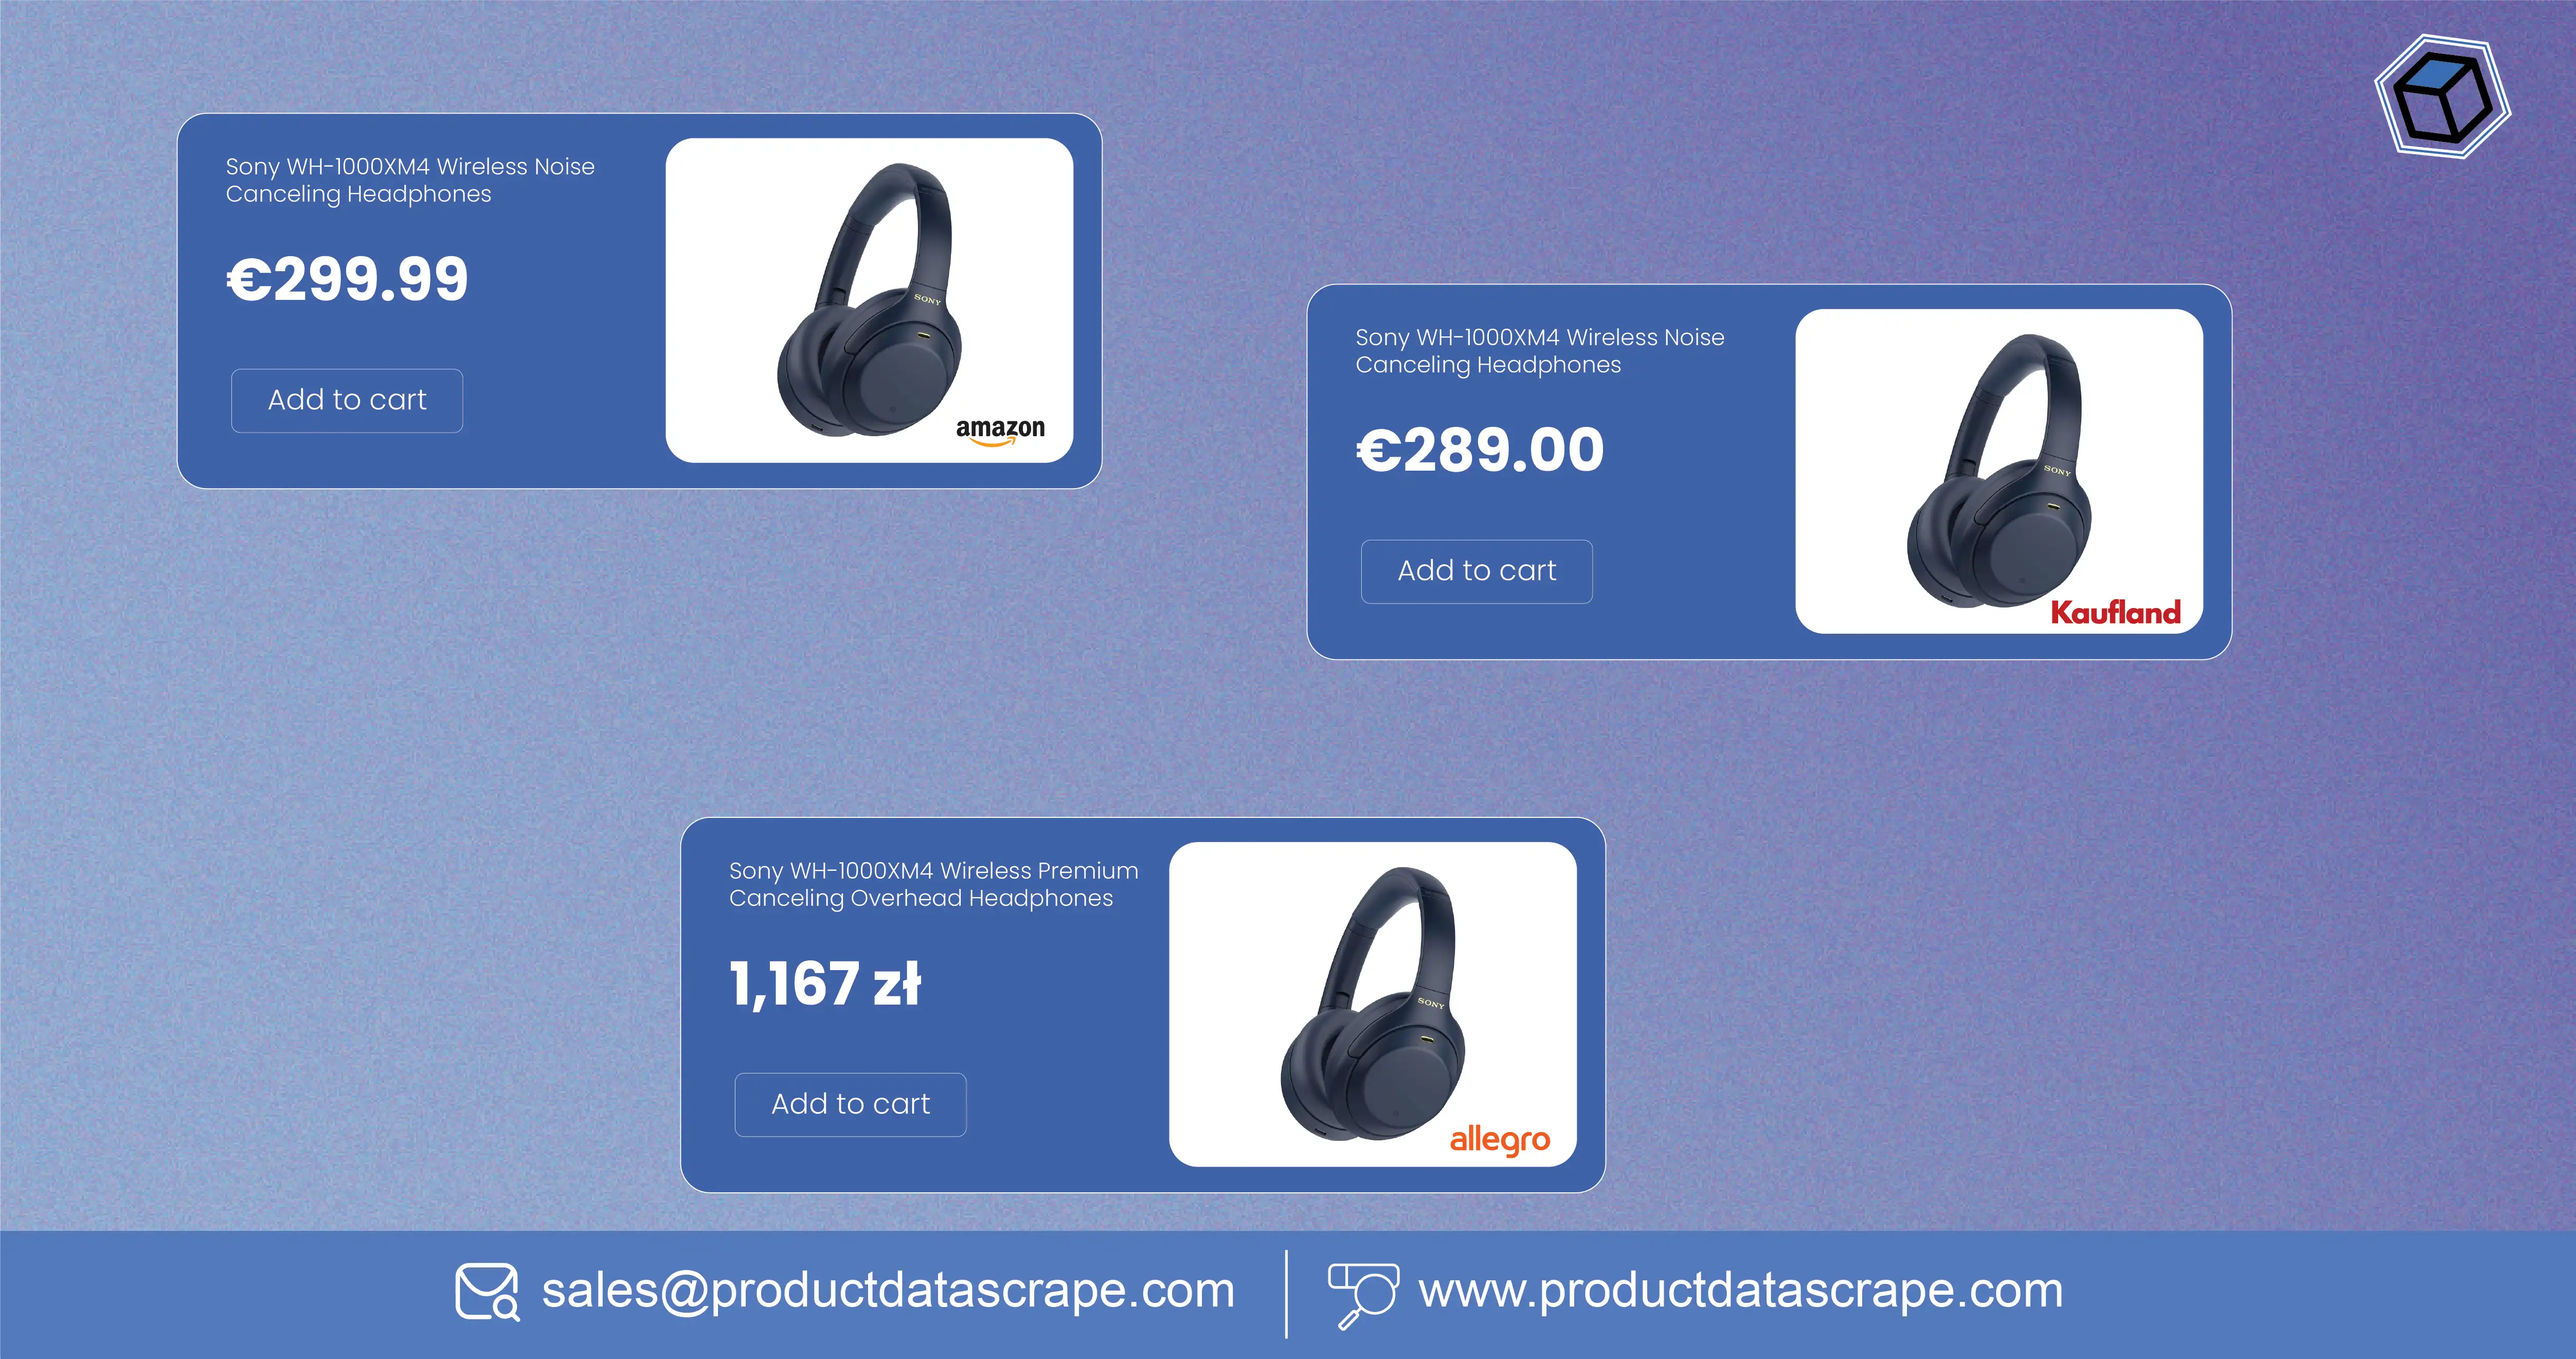
Amazon.de serves shoppers in Germany, Kaufland operates a marketplace for third-party sellers, and Allegro is a major e-commerce platform in Poland. Comparing these marketplaces requires attention to currency, shipping, promotions, product variants, seller availability, and local market conditions.
For grocery retailers, household brands, and consumer goods sellers, Extract European Grocery Product Data can help organize product names, package sizes, prices, discounts, and seller details into comparable records. The same approach can be adapted to electronics, personal care, home products, and other categories.
The objective is not simply to collect the lowest advertised price. It is to understand the competitive context, identify meaningful changes, and make decisions using reliable observations. This guide explains six practical strategies, provides historical monitoring frameworks for 2020–2026, and shows how businesses can build a cost-conscious workflow using spreadsheets, automation, and carefully selected data collection tools.
How Can Sellers Compare Competitors Across Germany and Poland?
Cross-border sellers often face a fragmented pricing landscape. A product may appear under different titles, package sizes, or seller accounts across German and Polish marketplaces. Comparing prices without accounting for these differences can produce misleading conclusions.
Multi-marketplace scraping Germany Poland provides a framework for collecting comparable product information across both countries. Sellers can organize product titles, identifiers, advertised prices, discounts, shipping charges, seller names, and availability into a consistent dataset. Where relevant, currency conversion and local taxes must also be handled consistently.
For example, a fictional household brand, NordHaus, could compare a 1.5-liter electric kettle on Amazon.de with comparable offers on Kaufland and Allegro. Before identifying the cheapest seller, its analysts would verify capacity, model number, included accessories, shipping costs, and the destination country.
Seller-level research matters too. Businesses can Brand Scrape Sellers Information from Allegro to organize available seller details and compare their product ranges, observed prices, and listing activity, subject to platform access conditions.
Which indicators should cross-border sellers track?
| Indicator |
Germany |
Poland |
Why it matters |
| Advertised price |
EUR |
PLN |
Establishes the listed price |
| Shipping |
Destination-specific |
Destination-specific |
Improves delivered-price comparisons |
| Product identifier |
GTIN or model |
GTIN or model |
Helps match equivalent products |
| Seller details |
Available public fields |
Available public fields |
Supports competitor analysis |
| Availability |
Observed listing status |
Observed listing status |
Provides a dated availability signal |
A useful historical workflow organizes observations by year from 2020 through 2026, provided records exist. Analysts can compare annual medians, discount frequency, and seller participation without assuming that every year has complete coverage.
The key is consistency: collect the same fields, match equivalent products, retain timestamps, and flag missing information. This approach helps brands identify genuine pricing differences rather than reacting to unrelated products or incomplete offers.
How Should Sellers Compare Prices on Amazon.de and Kaufland?
A meaningful Amazon.de vs Kaufland price comparison for sellers should evaluate the total cost of a comparable offer rather than its headline price alone. Delivery fees, promotions, package sizes, product condition, and seller-specific terms can all affect the final comparison.
Consider a fictional product, the NordHaus Compact Blender. Suppose its observed listing price is €49.99 on Amazon.de and €46.99 on Kaufland. If shipping costs €0 on the first marketplace and €4.99 on the second, the delivered totals become €49.99 and €51.98, respectively, before considering any applicable differences in taxes or promotions.
These figures are illustrative, not actual marketplace prices.
Example: Comparing delivered prices
| Metric |
Amazon.de |
Kaufland |
| Illustrative listing price |
€49.99 |
€46.99 |
| Illustrative shipping fee |
€0.00 |
€4.99 |
| Delivered total |
€49.99 |
€51.98 |
| Difference from lowest delivered total |
€0.00 |
€1.99 |
The example shows why sellers should not automatically match the lowest displayed price. An offer that appears cheaper may cost more after delivery.
A practical monitoring process should record the product identifier, seller, listing price, shipping charge, discount, stock status, and observation timestamp. Analysts should also distinguish temporary promotions from regular pricing and avoid comparing bundles with single-item offers.
For historical analysis, compare the same products and equivalent price definitions across available snapshots from 2020–2026. A yearly median can reduce the influence of unusually short promotions, while a daily or weekly series can highlight faster changes when observations are frequent enough.
For small sellers, a spreadsheet can support initial comparisons. As the number of products and competitors grows, automated collection and validation can reduce repetitive work. Decisions should still account for margins, marketplace fees, fulfillment costs, and business strategy rather than price alone.
Which Metrics Reveal Marketplace and Seller Performance?
European Ecommerce Price Monitoring becomes more useful when price data is connected with product availability, seller participation, ratings, and assortment changes. Tracking only the lowest price may overlook why a competitor performs differently or whether a price change represents a meaningful opportunity.
A structured Marketplace & Seller Intelligence workflow connects these signals to business questions. For example, a brand may want to know whether a competitor's price reduction coincides with more active sellers, whether a product has disappeared from several listings, or whether a category is becoming more crowded.
Recommended monitoring metrics for 2020–2026
| Year |
Suggested analytical focus |
Metrics to review |
| 2020 |
Historical baseline, where available |
Median price, observed sellers |
| 2021 |
Price movement |
Price change, discount frequency |
| 2022 |
Assortment changes |
Active listings, product coverage |
| 2023 |
Competitive participation |
Sellers per matched product |
| 2024 |
Promotion patterns |
Promotional price, regular price |
| 2025 |
Recent historical behavior |
Price volatility, availability |
| 2026 |
Current year-to-date monitoring |
Latest price, recent change |
This table proposes a monitoring framework. It does not establish actual year-by-year marketplace performance.
A business can use these metrics to build category dashboards and identify products that warrant further investigation. For example, a persistent price gap may justify a margin review, while a sudden drop in observed listings may require checking availability and data quality before drawing conclusions.
Reliable analysis depends on product matching. GTINs, manufacturer part numbers, model numbers, and package sizes can help distinguish equivalent offers. Where identifiers are unavailable, title similarity can assist matching, but uncertain matches should be flagged for review.
Businesses should also retain the source and timestamp for each observation. This makes it easier to distinguish real market movements from missing records, listing changes, and collection errors.
What Explains Price Differences Between Germany and Poland?
An Amazon Germany vs Allegro Poland price gap can reflect more than a seller's pricing decision. Differences in local competition, shipping, currency, taxes, promotions, product availability, and marketplace fees can influence the final price that customers see.
For cross-border brands, the first step is to identify the same product in both markets. A coffee machine with a similar product title may have a different model suffix, plug type, accessory bundle, or warranty arrangement. Such offers should not be treated as identical without verification.
How can a price gap be calculated?
A basic comparison uses:
Price gap (%) = Poland price converted to EUR - Germany price / Germany price X 100
For example, assume a fictional appliance costs €100 in Germany and PLN 450 in Poland. Using an illustrative exchange rate of PLN 4.50 per euro, the Polish listing converts to €100. The calculated gap is 0%.
This is a hypothetical calculation, not a statement about actual exchange rates or marketplace prices. A live analysis should use a dated exchange rate and document whether shipping and taxes are included.
| Comparison factor |
Why it matters |
| Currency conversion |
Makes prices comparable across EUR and PLN |
| Shipping and delivery |
Changes the total amount paid |
| Product specifications |
Prevents mismatched comparisons |
| Promotions |
May explain temporary differences |
| Local competition |
Influences sellers' pricing choices |
| Tax treatment |
Helps ensure equivalent price definitions |
For historical comparisons, analysts should preserve original prices alongside converted values. This makes the analysis auditable if exchange rates change or a calculation needs to be revisited.
A sustained gap across multiple observations may indicate a market-specific pricing strategy or a difference in operating costs. A one-day gap, however, could reflect a temporary promotion or an incomplete listing. Validate repeated observations before changing prices across countries.
How Can Automated Pricing Data Support Better Decisions?
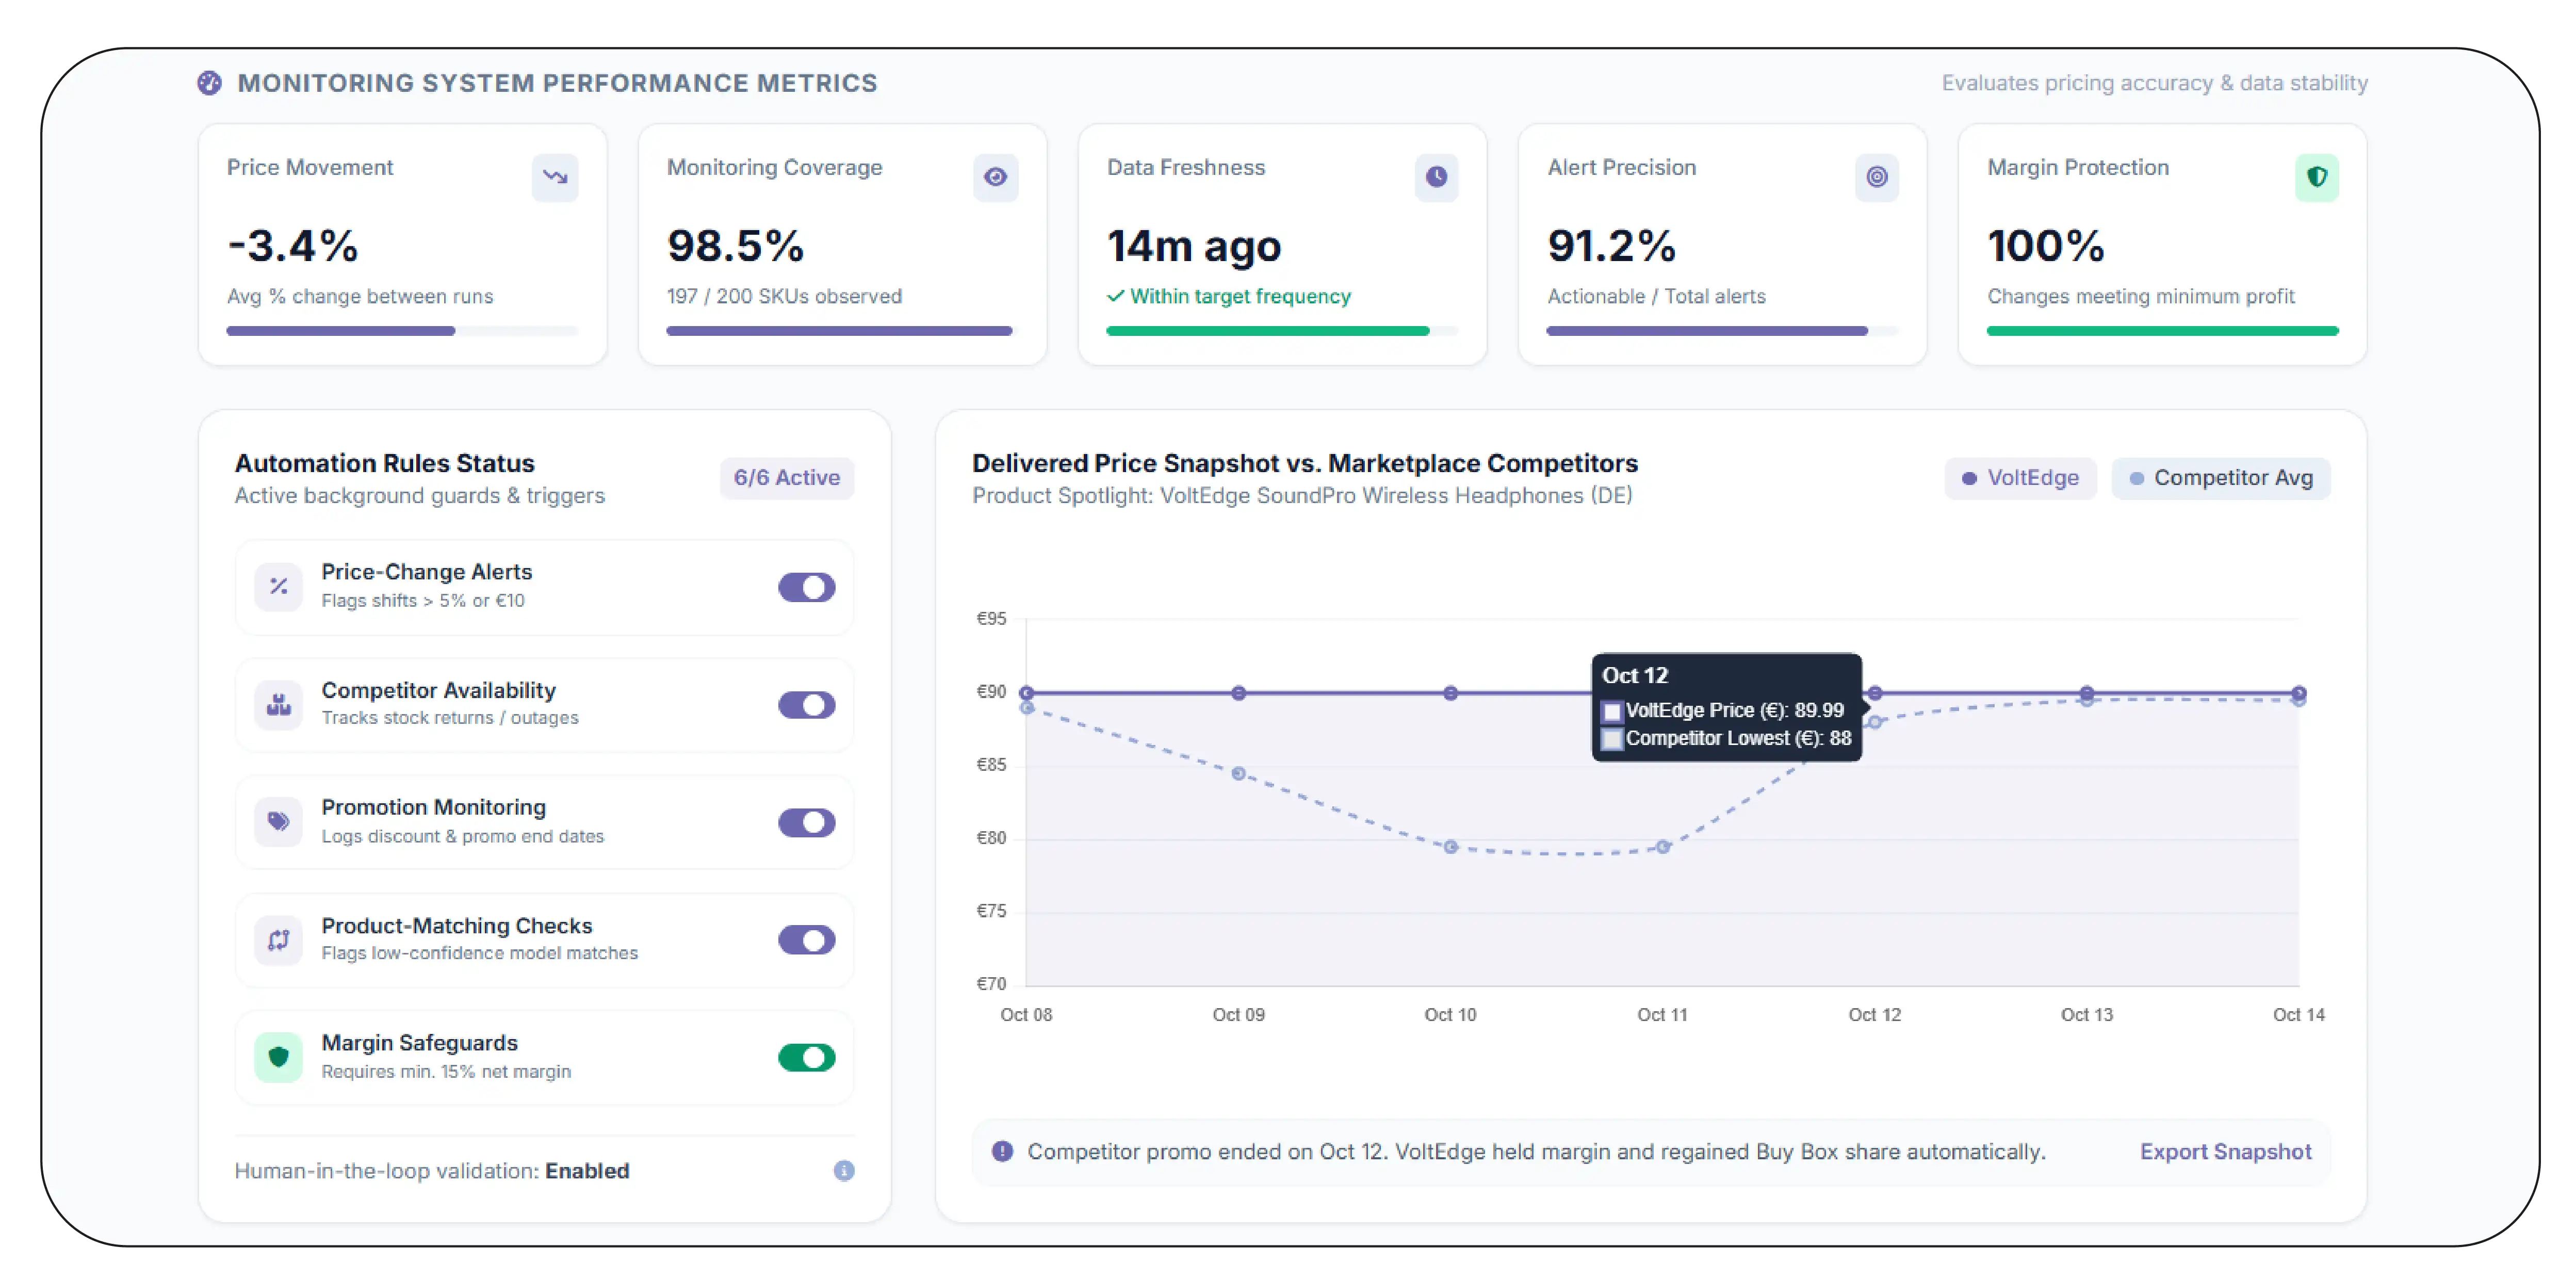
Dynamic pricing data for EU marketplace sellers helps businesses understand how competing offers change over time and whether their current pricing remains appropriate. The goal is not to change prices whenever a competitor moves. It is to identify meaningful changes and evaluate them against margins, demand, and commercial priorities.
A practical system collects comparable product observations at a defined frequency, validates each record, and stores historical snapshots. It can then flag changes such as a sudden discount, a competitor's return to stock, or a widening price difference between marketplaces.
For example, a fictional consumer electronics seller, VoltEdge, could monitor 200 products across Amazon.de, Kaufland, and Allegro. The system might highlight products where competitors repeatedly undercut its delivered price or where a promotion has ended. The team could investigate these alerts before changing its own prices.
Which automation rules are useful?
- Price-change alerts: Flag changes exceeding a defined percentage or currency amount.
- Competitor availability alerts: Identify listings that appear unavailable or return after a period of absence.
- Promotion monitoring: Record observed discounts and compare them with previous prices where historical records exist.
- Product-matching checks: Flag uncertain model or package matches before comparing offers.
- Margin safeguards: Require a minimum margin calculation before a price adjustment is approved.
- Data-quality alerts: Flag missing prices, duplicate observations, and unusually large changes that may be collection errors.
What should sellers measure over time?
| Metric |
Example measurement |
| Price movement |
Percentage change between observations |
| Monitoring coverage |
Percentage of target products successfully observed |
| Data freshness |
Time since the latest successful observation |
| Alert precision |
Share of alerts confirmed as meaningful |
| Margin protection |
Share of proposed changes meeting margin rules |
These metrics evaluate the monitoring process rather than claim unverified marketplace results.
Smaller businesses can begin with scheduled spreadsheet updates and simple comparison rules. More complex operations may benefit from automated pipelines, dashboards, and integrations with inventory or pricing systems. In either case, human review remains important when product matches are uncertain or marketplace information changes unexpectedly.
How Can Businesses Start With Low-Cost Monitoring Tools?
Businesses do not always need a large software budget to begin competitor research. A small catalog can often be monitored with a spreadsheet, a clear product list, and a repeatable process for checking relevant offers. The most important requirement is consistent, comparable information.
To monitor prices on Kaufland and Amazon.de for free, sellers can begin with manual checks of publicly accessible listings and record the results in a spreadsheet. They should confirm the applicable website terms and use only permitted collection methods. Free options may involve limitations in coverage, refresh frequency, or automation.
A practical low-cost setup
| Tool or method |
Best use |
Main limitation |
| Spreadsheet |
Recording prices and calculating differences |
Manual maintenance |
| Marketplace search |
Finding comparable listings |
Search results may vary |
| Saved product list |
Keeping monitoring targets organized |
Does not guarantee price history |
| Spreadsheet formulas |
Calculating gaps and percentage changes |
Depends on accurate inputs |
| Permitted scheduled collection |
Repeating data capture |
Requires setup and quality checks |
| Basic dashboard |
Reviewing trends and alerts |
Depends on dataset completeness |
A seller with 30 products might start by recording weekly observations for three competitors per product. The spreadsheet could include product ID, marketplace, seller, price, shipping, availability, URL, and collection date. Conditional formatting could highlight large changes for review.
This example describes a workflow, not a claim that every marketplace offers free automated access.
For a larger catalog, manual checks can become difficult to maintain. A business may then evaluate permitted automated collection or a specialist data service, comparing the cost of implementation with the time saved and the value of better coverage.
Regardless of budget, sellers should avoid filling missing historical prices with guesses. Keep actual observations separate from estimates, record the collection date, and identify products whose matches are uncertain.
A staged approach helps control complexity: begin with the highest-priority products, verify data quality, establish a baseline, and expand only when the monitoring process produces useful decisions.
Why Choose Product Data Scrape?
Choosing the right data partner means prioritizing consistency, transparency, and actionable reporting. An Amazon.de Product Data Scraper workflow can help businesses organize product attributes, prices, seller details, and historical observations into structured datasets. Product Data Scrape focuses on configurable collection, product matching, validation, and reporting aligned with specific business goals. Whether a seller monitors a small group of products or a broader catalog, the approach should account for source availability, collection frequency, data quality, and permitted access. This helps businesses evaluate competitor offers, investigate price changes, and make informed decisions without confusing estimated trends with verified market performance.
Conclusion
Affordable competitor monitoring begins with clear priorities, comparable product records, and consistent observations. By comparing delivered prices, monitoring seller activity, and retaining historical snapshots, businesses can identify pricing opportunities without investing in unnecessary complexity.
A structured approach to Extract Kaufland listing information alongside relevant Amazon.de and Allegro observations can support cross-market comparisons, provided the data is collected through permitted methods and validated before use.
Monitoring EU Marketplace Prices on a Budget is about making better decisions with reliable information, not simply collecting more data.
Ready to improve your cross-market pricing intelligence? Contact Product Data Scrape to discuss a tailored marketplace data solution for your products, competitors, and reporting needs!
Frequently Asked Questions
1. Which marketplaces should sellers monitor?
Amazon.de, Kaufland, and Allegro are useful starting points for sellers targeting Germany and Poland, depending on product category, customer demand, and competitive relevance.
2. How often should prices be checked?
Daily or weekly checks may suit different products. Choose a frequency based on market volatility, business priorities, technical feasibility, and permitted access.
3. Can spreadsheets support competitor price monitoring?
Yes. Spreadsheets can record prices, calculate differences, track timestamps, and flag changes. Larger catalogs may require automated collection and more robust validation.
4. Are cross-border price comparisons reliable?
They can be, provided products match and currency, shipping, taxes, promotions, and availability are handled consistently. Incomplete data can distort comparisons.
5. How can businesses begin with Product Data Scrape?
Product Data Scrape can help businesses define target products, assess collection requirements, structure marketplace data, and develop a monitoring workflow aligned with their goals.


 Singapore
 EMAIL
EMAIL
 PHONE
PHONE

















.webp)






