Introduction
E-commerce businesses can solve competitor pricing and seller performance challenges by collecting and analyzing marketplace data, including product listings, prices, seller details, ratings, and estimated sales. Scrape Mercado Libre Mexico Products to transform scattered marketplace information into structured insights that help sellers identify pricing gaps, evaluate competitors, and make informed product decisions.
Mercado Libre is a major e-commerce marketplace in Latin America, making its Mexican marketplace relevant to brands, retailers, distributors, and marketplace sellers targeting local consumers. However, manually monitoring hundreds of listings is time-consuming, and changes in prices, availability, promotions, and seller activity can quickly make spreadsheets outdated.
A structured Mercado Libre E-commerce Product Dataset helps businesses consolidate these details into a consistent format for analysis. When combined with historical snapshots and clearly labeled sales estimates, this information supports better pricing decisions, product assortment planning, and competitive research.
This guide explains six practical ways marketplace data collection can address common e-commerce challenges, how to interpret marketplace trends from 2020 to 2026, and which metrics businesses should track to improve decision-making through Mercado Libre Listings data extraction.
How Can Historical Listing Data Reveal Competitor Pricing Gaps?
Marketplace pricing changes frequently because sellers respond to promotions, inventory availability, competition, and shifts in consumer demand. Businesses that rely on occasional manual checks may miss important price movements or misunderstand how competitors position their products.
A systematic approach to Mercado Libre Listings enables businesses to capture product titles, prices, discounts, seller identities, ratings, availability, and listing URLs. Through consistent data extraction, these attributes can be organized into historical snapshots that reveal how competitors adjust their offers over time.
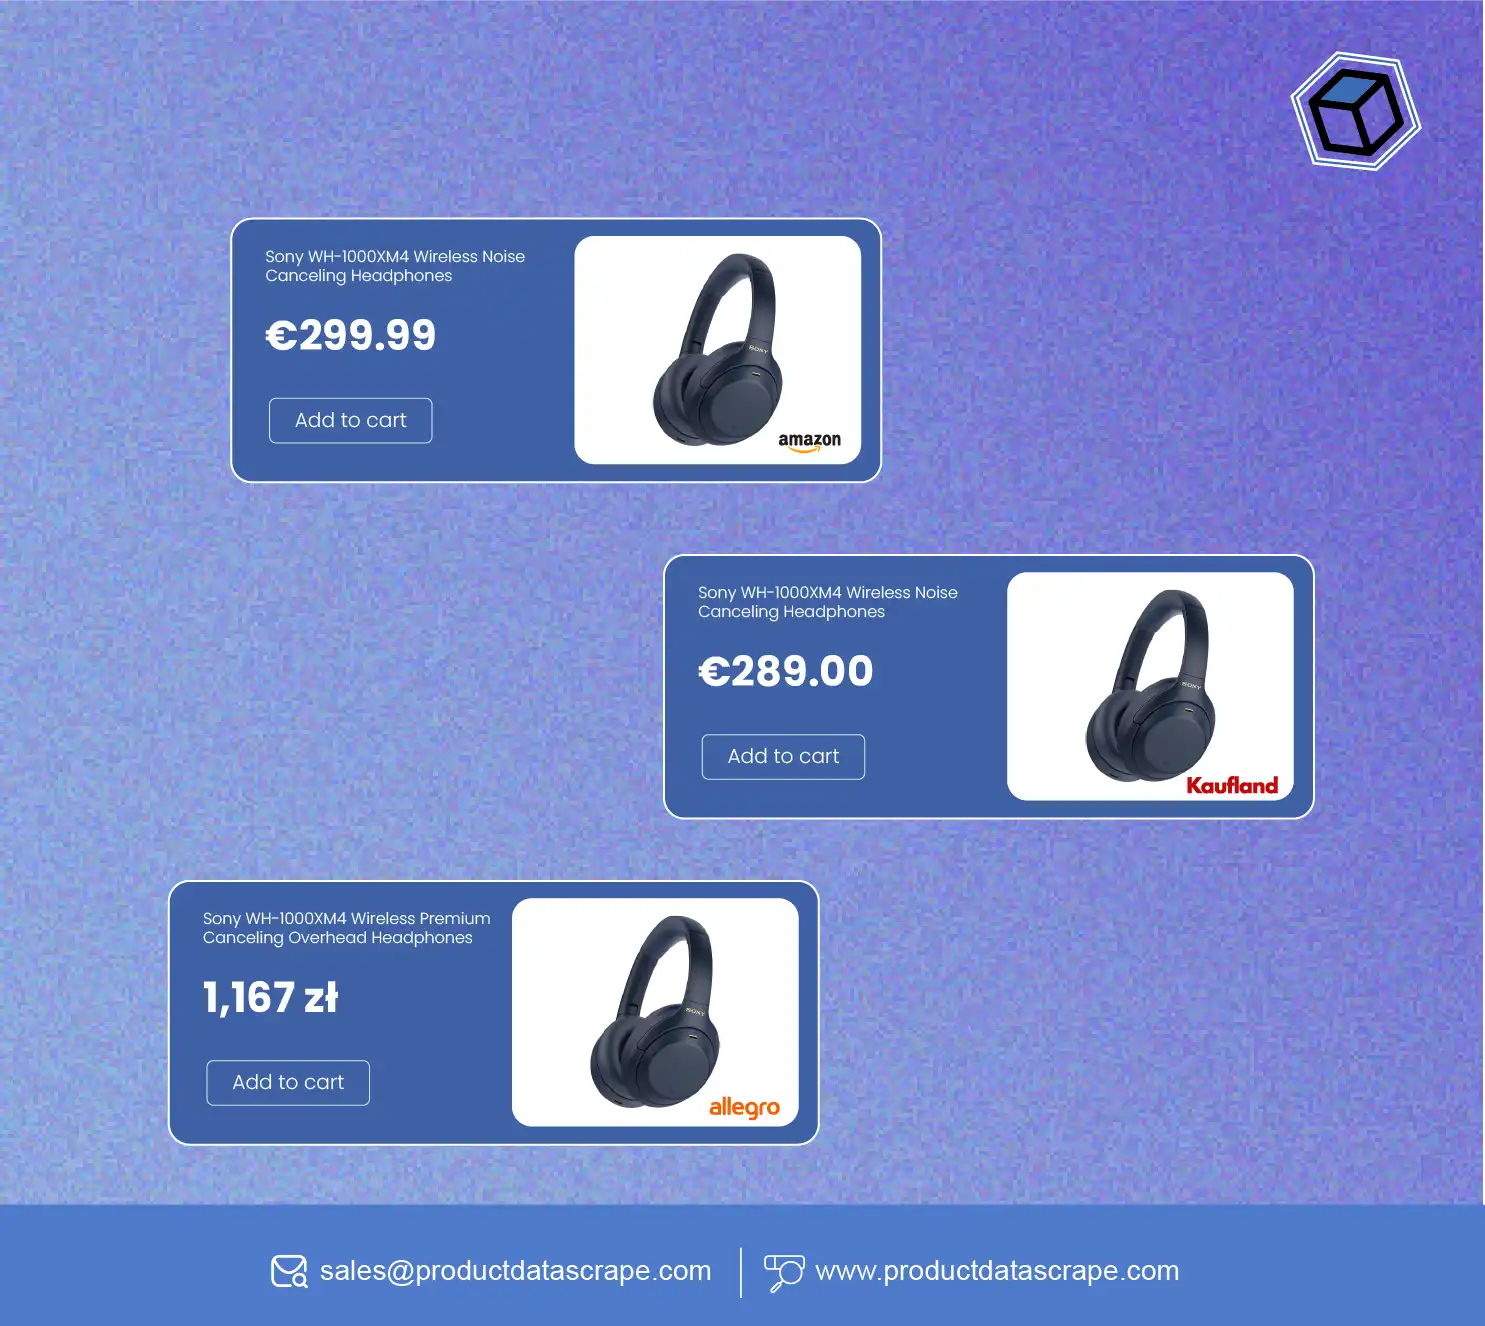
For example, an electronics retailer selling wireless headphones may discover that competing sellers repeatedly reduce prices during promotional periods. By comparing regular prices with observed discounts, the retailer can evaluate whether its current pricing remains competitive without automatically matching every price reduction.
This information supports Commerce Intelligence by connecting marketplace observations with business decisions. Teams can identify unusually priced products, compare similar product variants, and distinguish temporary promotions from longer-term pricing patterns.
Which historical indicators should businesses monitor?
| Year |
Recommended analytical focus |
Useful measurement |
| 2020 |
Establish historical baselines where records exist |
Median observed price |
| 2021 |
Compare available historical snapshots |
Price variation |
| 2022 |
Examine changes in product assortment |
Active listing count |
| 2023 |
Evaluate seller competition |
Sellers per product |
| 2024 |
Review promotional patterns |
Discount frequency |
| 2025 |
Compare recent pricing behavior |
Price volatility |
| 2026 |
Monitor current observations and available year-to-date trends |
Latest price and change from baseline |
These are recommended analytical priorities, not verified historical marketplace statistics. Historical conclusions require actual archived records.
Practical implementation starts with matching comparable products, normalizing currencies and product variants, and recording timestamps. Businesses should compare like-for-like offers rather than treating different models or bundles as equivalent. Regular snapshots then make it easier to identify pricing opportunities and support evidence-based repricing decisions.
How Can Estimated Sales Help Businesses Measure Market Demand?
Sales estimates can help marketplace sellers understand which products deserve further research, inventory planning, or promotional investment. However, estimated sales are not the same as confirmed transactions, and businesses should clearly distinguish observed information from modeled values.
Mercado Libre Mexico Estimated Sales data scraping combines available listing information with historical observations and suitable estimation methods to assess potential product demand. Depending on the data available, analysts may consider review growth, listing availability changes, seller activity, displayed sales indicators, and repeated observations over time.
For example, a home appliance retailer might compare several air fryer listings. One listing may have a high rating but limited evidence of recent demand, while another may show stronger review growth and sustained availability. These signals can guide further investigation, but they cannot independently establish exact units sold.
Which signals help estimate demand?
| Signal |
Analytical purpose |
Important limitation |
| Displayed sales indicators |
Provide a marketplace-reported demand signal when available |
Definitions and coverage may vary |
| Review-count changes |
Help identify changes in customer feedback volume |
Not every buyer submits a review |
| Listing availability |
Helps track whether offers remain accessible |
Unavailability does not prove a sale |
| Seller count |
Indicates competitive participation |
More sellers do not necessarily mean greater demand |
| Historical price changes |
Helps explain potential changes in buying conditions |
Correlation does not establish causation |
Businesses can build a historical monitoring framework spanning 2020–2026 when reliable archived data exists. For years without archived observations, they should report the data gap rather than reconstruct unsupported figures.
A practical estimation model should document its assumptions, observation window, confidence level, and known limitations. Teams can then compare estimates across similar products and validate the methodology against any reliable sales information available to them.
This approach supports assortment decisions, category research, and demand prioritization while reducing the risk of treating modeled sales as verified marketplace transactions.
How Can Seller-Level Research Improve Competitive Analysis?
Product performance depends on more than price. Seller reputation, product availability, catalog breadth, ratings, and fulfillment-related information can influence how competing offers are positioned. Understanding these factors helps brands evaluate the competitive environment more comprehensively.
When businesses Scrape Mercado Libre seller data, they can organize available seller names or identifiers, associated listings, product categories, ratings, and other accessible attributes. Connecting seller records with product observations makes it easier to compare competitors across multiple listings rather than analyzing every product independently.
For example, a fictional Mexican electronics retailer, ElectroNova MX, could compare three competing sellers offering similar Bluetooth speakers. The analysis might examine their observed prices, number of relevant listings, available ratings, and changes in product availability. These comparisons could help ElectroNova identify whether its competitive challenge comes from pricing, product assortment, or a more established competitor presence.
A carefully designed Scrape Mercado Libre Mexico Products workflow can connect listing-level records to seller-level summaries using stable identifiers wherever available. This reduces duplicate counting and supports more consistent comparisons.
What should a seller performance dashboard include?
- Assortment breadth: Number of distinct products or relevant categories offered by each seller.
- Pricing position: Median price and price range for comparable products.
- Customer feedback: Available ratings, review counts, and changes over time.
- Listing activity: Changes in observed listings and product availability.
- Competitive overlap: Products or categories offered by multiple sellers.
- Data quality: Missing attributes, uncertain matches, and duplicate records.
For 2020–2026 comparisons, analysts should distinguish historical snapshots from present-day seller profiles. A seller visible today may not have operated in the same category throughout the entire period.
Seller identity resolution also matters. Similar business names may refer to different accounts, while one business may use multiple storefronts. Analysts should document matching rules and avoid assuming that separate seller accounts necessarily represent separate businesses.
These practices help brands prioritize meaningful competitors, identify assortment gaps, and build more reliable marketplace performance reports.
How Can Businesses Identify Products Worth Monitoring?
Finding products with strong demand signals can help sellers focus research and inventory planning on relevant opportunities. However, the products receiving the most attention are not always the most profitable, and visible marketplace indicators should be evaluated alongside price, competition, and business requirements.
Tracking top selling products on Mercado Libre involves collecting repeated observations for relevant product categories and comparing indicators that may signal customer interest. These can include available sales labels, review growth, listing persistence, seller competition, price movements, and product availability.
Consider a fictional sports retailer comparing yoga mats, resistance bands, and adjustable dumbbells. A product with numerous competing listings might indicate an established category, but it could also present intense price competition. A less crowded category with consistent demand indicators may deserve further investigation.
How should products be prioritized?
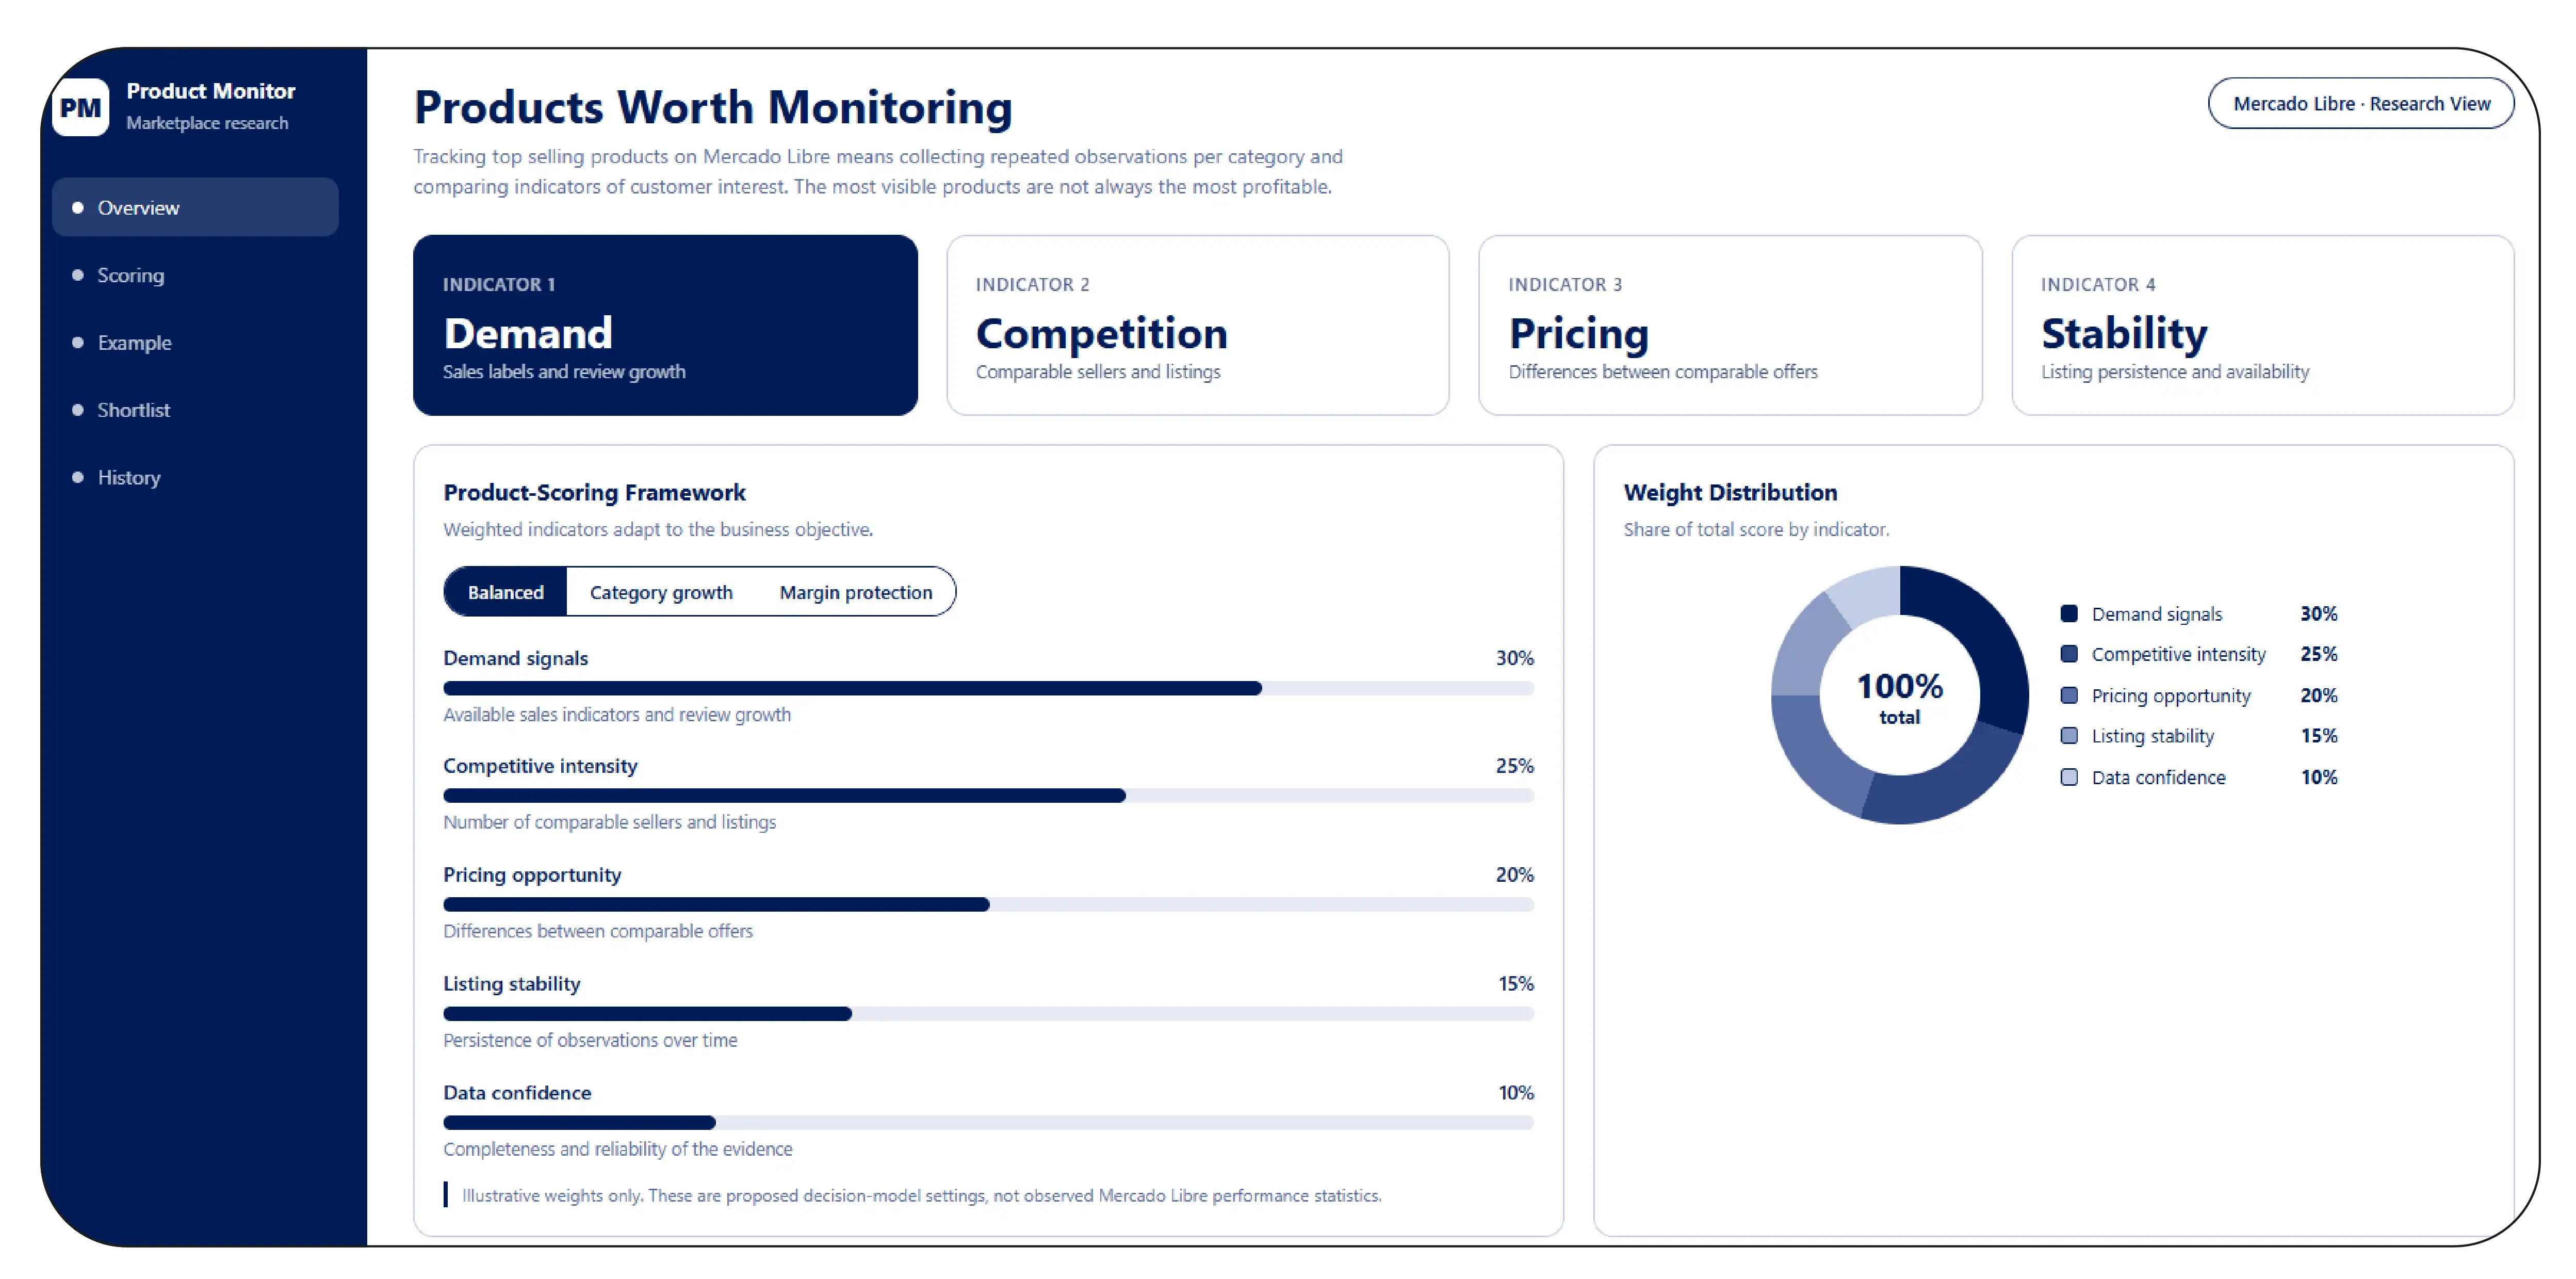
A practical product-scoring framework can use weighted indicators:
| Indicator |
Example weight |
What it measures |
| Demand signals |
30% |
Available sales indicators and review growth |
| Competitive intensity |
25% |
Number of comparable sellers and listings |
| Pricing opportunity |
20% |
Differences between comparable offers |
| Listing stability |
15% |
Persistence of observations over time |
| Data confidence |
10% |
Completeness and reliability of the evidence |
Illustrative weights only. These are proposed decision-model settings, not observed Mercado Libre performance statistics.
The scoring system should be adapted to the business objective. A brand seeking category growth may prioritize demand signals, while a seller protecting margins may place more weight on pricing opportunities and competitive intensity.
Historical analysis can compare the availability of records across 2020–2026, but a current ranking must not be presented as a historical ranking without dated evidence. Missing records and changing product identifiers can also distort comparisons.
A useful output is a prioritized shortlist showing the product, observation date, relevant metrics, competing offers, and confidence level. Sales teams can then investigate the strongest candidates instead of relying on unsupported bestseller claims.
How Can Structured Exports Make Marketplace Analysis Easier?
Collecting information is only the first step. Businesses also need consistent data structures that make product comparisons, reporting, dashboard creation, and downstream analysis easier to maintain.
A standardized Mercado Libre listing, seller and sales data in CSV format can bring product attributes, seller details, observed prices, and demand indicators into a reusable analytical dataset. CSV files can be imported into spreadsheet applications, databases, business intelligence tools, and compatible data pipelines.
For example, a marketplace analyst could prepare one file containing product-level observations and another containing seller summaries. Each product record would include its collection timestamp, listing URL, product identifier where available, observed price, and relevant attributes. Seller summaries could include the seller identifier, number of matched listings, and aggregate pricing measures.
What should a well-designed dataset contain?
| Field |
Example |
Purpose |
| Observation date |
2026-10-05 |
Identifies when the record was collected |
| Product ID |
MX-P1001 |
Supports product matching |
| Product title |
Wireless Headphones |
Describes the listing |
| Seller ID |
SELLER-028 |
Connects products to sellers |
| Price |
MXN 899 |
Supports pricing comparisons |
| Rating |
4.6 |
Records the observed rating when available |
| Review count |
245 |
Provides feedback-volume context |
| Sales indicator |
Not available |
Distinguishes missing data from zero |
| Source URL |
Product listing URL |
Supports verification |
| Data quality flag |
Verified fields |
Records validation status |
The examples above are fictional and demonstrate a schema rather than actual marketplace observations.
For historical reporting, each collection should retain its timestamp and relevant source context. Analysts should avoid overwriting older records when they need to measure changes over time. Currency formats, product variants, missing values, and duplicate records should also be standardized before analysis.
These practices support more reliable dashboards and repeatable reporting. They also help separate directly observed attributes from derived metrics, which is particularly important when estimates are used for business decisions.
How Can an Automated Workflow Turn Raw Data Into Actionable Insights?
A reliable marketplace intelligence process connects collection, validation, historical storage, analysis, and reporting. Automating only the collection step is insufficient if the resulting information contains duplicates, mismatched products, or unsupported assumptions.
Businesses looking to Extract Mercado Libre Data should begin by defining their target categories, required fields, collection frequency, and permitted access methods. The workflow can then be designed around the decisions the business needs to make, such as competitor price monitoring, seller comparisons, or demand estimation.
A structured Scrape Mercado Libre Mexico Products workflow can follow five practical stages:
- Define the scope. Select relevant product categories, competitor listings, and required attributes.
- Collect available information. Gather permitted listing and seller data while recording observation timestamps.
- Validate the records. Standardize formats, identify duplicates, flag missing values, and verify product matches.
- Analyze changes. Compare prices, assortment, seller participation, and available demand signals across collection periods.
- Deliver actionable reports. Present key changes, data limitations, and recommended follow-up actions in dashboards or structured exports.
How should monitoring evolve from 2020 to 2026?
Historical coverage depends on the availability of reliable archived observations. A business with complete snapshots can compare annual trends, while a project beginning in 2026 should establish a consistent baseline and build a historical series prospectively.
| Period |
Recommended action |
Output |
| 2020–2021 |
Use only verifiable archived observations |
Historical baseline |
| 2022–2023 |
Compare available product and seller snapshots |
Competitive changes |
| 2024–2025 |
Evaluate observed pricing and assortment patterns |
Recent historical context |
| 2026 |
Track dated observations and label partial-year coverage |
Current monitoring dashboard |
The table describes a research methodology, not verified annual market growth or sales figures.
Automated alerts can flag unusually large price changes, disappearing listings, or changes in available seller indicators. Analysts should review these alerts before taking action, as changes may result from product variants, temporary availability issues, or data collection errors.
Finally, businesses should respect applicable platform terms, technical access restrictions, privacy obligations, and data retention requirements. This creates a more dependable foundation for repeatable marketplace analysis.
Why Choose Product Data Scrape?
Product Data Scrape focuses on helping e-commerce businesses convert marketplace information into structured, decision-ready datasets. Its approach combines configurable collection workflows, data validation, historical comparisons, and reporting tailored to business objectives.
A well-planned Scrape Mercado Libre Mexico Product data project can support competitor pricing analysis, seller monitoring, catalog research, and demand estimation without confusing modeled indicators with verified sales. Data schemas and quality checks also make it easier to integrate outputs into existing analytical workflows.
The process begins with clear requirements, followed by source assessment, field mapping, validation, and reporting. Collection frequency and coverage are defined according to technical feasibility and permitted access.
For brands and marketplace sellers, the goal is practical: improve visibility into competitive conditions, reduce repetitive research, and make decisions using documented evidence rather than assumptions.
Conclusion
Competitor pricing, seller performance, and estimated demand become easier to evaluate when businesses maintain consistent marketplace observations and validate their analytical methods. Historical snapshots can reveal patterns, while structured datasets help teams compare products, monitor competitors, and prioritize research opportunities.
A carefully implemented data workflow also makes limitations visible, ensuring that estimates are not mistaken for confirmed sales and historical gaps are not filled with invented statistics.
Businesses can use these insights to Estimate your sales performance more systematically, improve product research, and refine their competitive strategies.
Ready to strengthen your marketplace intelligence? Contact Product Data Scrape to discuss a tailored data collection solution for Mercado Libre Mexico, including listing analysis, seller monitoring, and structured reporting!
Frequently Asked Questions
1. What information can marketplace data collection provide?
It can capture accessible product titles, prices, listing URLs, seller details, ratings, review counts, and other available attributes, depending on source access and project requirements.
2. Can exact product sales be determined from listings?
Not always. Sales estimates require suitable evidence and a documented methodology. Displayed indicators, review changes, and availability are signals, not guaranteed transaction counts.
3. How can businesses monitor competitor pricing?
They can collect timestamped prices for comparable products, normalize variants, compare historical snapshots, and flag significant changes for manual verification before adjusting pricing.
4. Can historical marketplace trends be analyzed from 2020?
Yes, if reliable dated records exist. Without archived observations, analysts should disclose gaps and avoid presenting reconstructed values as verified historical data.
5. Who can benefit from marketplace intelligence?
Brands, retailers, distributors, and marketplace sellers can use structured marketplace data to evaluate competition, investigate demand, monitor assortment changes, and prioritize product research.


 Singapore
 EMAIL
EMAIL
 PHONE
PHONE
















.webp)






