Introduction
Retailers can optimize Tier-2 quick-commerce performance by combining city-level pricing, assortment, availability, dark-store coverage, and competitor data into one decision framework. Tier-2 City Q-Commerce Intelligence 2026 is increasingly important because quick commerce is expanding beyond India's largest metros, while local demand, store economics, and competitive intensity vary significantly by city. In 2026, quick commerce has reached 477 Indian cities, while non-metro markets have recorded a 328% year-on-year increase in daily orders. (The Economic Times)
For retailers and FMCG brands, this creates a practical question: How can businesses know which products to stock, what prices to charge, and where to expand? The answer lies in structured Q-Commerce data scraping that captures product prices, discounts, availability, assortment, delivery signals, competitor presence, and dark-store footprints at city and pincode level.
This article explains how businesses can turn those signals into actionable intelligence for cities such as Indore, Jaipur, Surat, Lucknow, Ahmedabad, Nagpur, Chandigarh, and other emerging markets.
How Can Retailers Understand Dark-Store Coverage in Emerging Cities?
Dark stores determine how quickly a quick-commerce platform can serve a local demand pocket. In Tier-2 markets, retailers need to know not only whether Blinkit, Zepto, Swiggy Instamart, BigBasket, or Flipkart Minutes operates in a city, but also where their fulfillment points are positioned and what areas they appear to serve.
Dark Store Tracking Across Tier-2 Indian Cities can help retailers map competitor footprints, identify service gaps, compare pincode coverage, and evaluate whether a city is sufficiently dense for expansion.
India's quick-commerce network has moved well beyond its early metro concentration. By August 2026, dark stores were reported across 477 cities. In 2025, about one-third of India's dark stores were already located in Tier-2 cities and smaller towns. (The Economic Times)
| Year |
Market signal |
Business implication |
| 2020 |
Quick commerce remained an emerging fulfillment model |
Limited city-level coverage |
| 2021 |
Quick-commerce adoption accelerated |
Demand pockets became measurable |
| 2022 |
India quick-commerce GMV reached about $1.6B |
Dark-store economics gained importance |
| 2023 |
GMV increased to about $2.8B |
Competitive footprints expanded |
| 2024 |
Blinkit alone reported 526+ dark stores |
Network mapping became more important |
| 2025 |
Around one-third of dark stores were in Tier-2/smaller towns |
Smaller-city expansion became mainstream |
| 2026 |
Quick commerce expanded to 477 cities |
City-level intelligence became strategic |
The 2022 and 2023 GMV figures come from RedSeer/Inc42 reporting, while the 2024 Blinkit figure is from Inc42 and the 2025–26 footprint figures are from Economic Times and CLSA reporting. (Inc42)
From 2020 to 2026, the important change is not simply the number of stores. It is the transition from a metro convenience model to a geographically distributed retail infrastructure. Retailers can use dark-store location data to identify underserved neighborhoods, overlapping competitor coverage, and areas where a new fulfillment point could potentially improve service levels.
For FMCG brands, the same intelligence can reveal where products are being offered and whether a competitor has stronger digital distribution. For example, a brand selling Coca-Cola, Pepsi, Amul, Nestlé, Maggi, Britannia, or Lay's can compare availability across different city clusters instead of relying on national averages.
How Can Brands Measure Competitive Presence by City?
Quick-commerce competition is no longer uniform across India. Blinkit, Zepto, Swiggy Instamart, BigBasket, Flipkart Minutes, and Amazon Now have different expansion strategies, assortment strengths, and dark-store footprints.
Quick Commerce Brand Monitoring in Tier-2 Cities allows businesses to compare competitors using a common framework: city presence, pincode coverage, product availability, assortment depth, pricing, promotions, and delivery visibility.
For example, a retailer entering Jaipur may face a very different competitive structure from one entering Indore or Surat. A national market-share assumption may therefore produce poor local decisions.
| Year |
Indicative development |
What retailers should monitor |
| 2020 |
Convenience delivery gained visibility |
Platform emergence |
| 2021 |
Q-commerce funding and adoption accelerated |
New entrants |
| 2022 |
GMV reached about $1.6B |
Platform assortment |
| 2023 |
GMV rose to about $2.8B |
Competitive expansion |
| 2024 |
Major players expanded dark-store networks |
City and pincode coverage |
| 2025 |
Platforms increasingly targeted Tier-2/3 markets |
Local demand and assortment |
| 2026 |
477-city footprint reported |
Competitive maturity by city |
India's quick-commerce GMV grew 77% from $1.6 billion in 2022 to $2.8 billion in 2023. By 2025, industry estimates placed the segment at roughly $7–8 billion in FY25, while RedSeer reported approximately $13–14 billion for FY26. Differences reflect methodology and measurement periods, so businesses should use a consistent definition when benchmarking their own datasets. (Inc42)
The 2025 expansion also demonstrated why city-level monitoring matters. Flipkart Minutes, for instance, had expanded to cities including Ahmedabad, Jaipur, Guwahati, Kanpur, Patna, and Thane, while Zepto reported traction in Tier-2 cities such as Nashik, Jaipur, and Chandigarh. (The Economic Times)
The 2026 environment is even more competitive. Across India's top 10 quick-commerce cities, CLSA counted 3,536 dark stores, including 969 for Blinkit, 828 for Zepto, 627 for Flipkart Minutes, 615 for Swiggy Instamart, and 497 for BigBasket. (The Economic Times)
For retailers, the actionable insight is straightforward: monitor competitors at city and pincode level rather than assuming national positioning applies everywhere.
How Can Businesses Benchmark Quick-Commerce Performance Across Cities?
A city comparison becomes useful when businesses measure the same variables across every market. Quick Commerce Market Benchmarking Across Cities should combine pricing, assortment, availability, store density, promotions, and serviceability rather than relying on one metric.
For example, suppose a retailer compares Jaipur, Indore, Surat, and Lucknow. Jaipur might show strong assortment but aggressive price competition. Indore could show fewer competitors but lower order density. Surat might have strong demand for packaged foods and personal-care categories. Such differences influence expansion and assortment decisions.
| Year |
Key market indicator |
Interpretation |
| 2020 |
Q-commerce was still an emerging model |
Pilot-stage intelligence |
| 2021 |
Monthly Q-commerce usage began scaling |
Early demand measurement |
| 2022 |
8.5M monthly transacting users |
Rapid consumer adoption |
| 2023 |
13.2M monthly transacting users |
Habit formation |
| 2024 |
23M monthly transacting users |
Mainstream acceleration |
| 2025 |
51M monthly transacting users |
Large-scale adoption |
| 2026 |
~₹11,000 crore January GMV |
Continued scale |
RedSeer's 2026 research reports monthly transacting users rising from 2.2 million in 2021 to 51 million in 2025. It also reported approximately ₹11,000 crore of quick-commerce GMV in January 2026 and around 95% year-on-year order growth. (Redseer Strategy Consultants)
This progression shows why historical benchmarking matters. A retailer evaluating a Tier-2 city in 2026 should not compare it only against today's metro performance. It should understand the city's maturity curve.
From 2020 to 2026, quick commerce evolved from a niche convenience proposition into a high-frequency retail channel. Grocery remains central, but platforms have expanded into beauty, electronics, home products, toys, lifestyle products, and other categories. (ETRetail.com)
For brands such as Nestlé, Coca-Cola, Pepsi, Amul, Maggi, Britannia, Lay's, Dove, and Surf Excel, benchmarking can answer practical questions:
- Is the brand's assortment consistent across cities?
- Are competitors offering more pack sizes?
- Which city has the strongest promotional intensity?
- Where are products repeatedly unavailable?
- Which platform has the broadest assortment?
- Where should additional distribution effort be prioritized?
This makes city benchmarking useful for both strategic expansion and day-to-day category management.
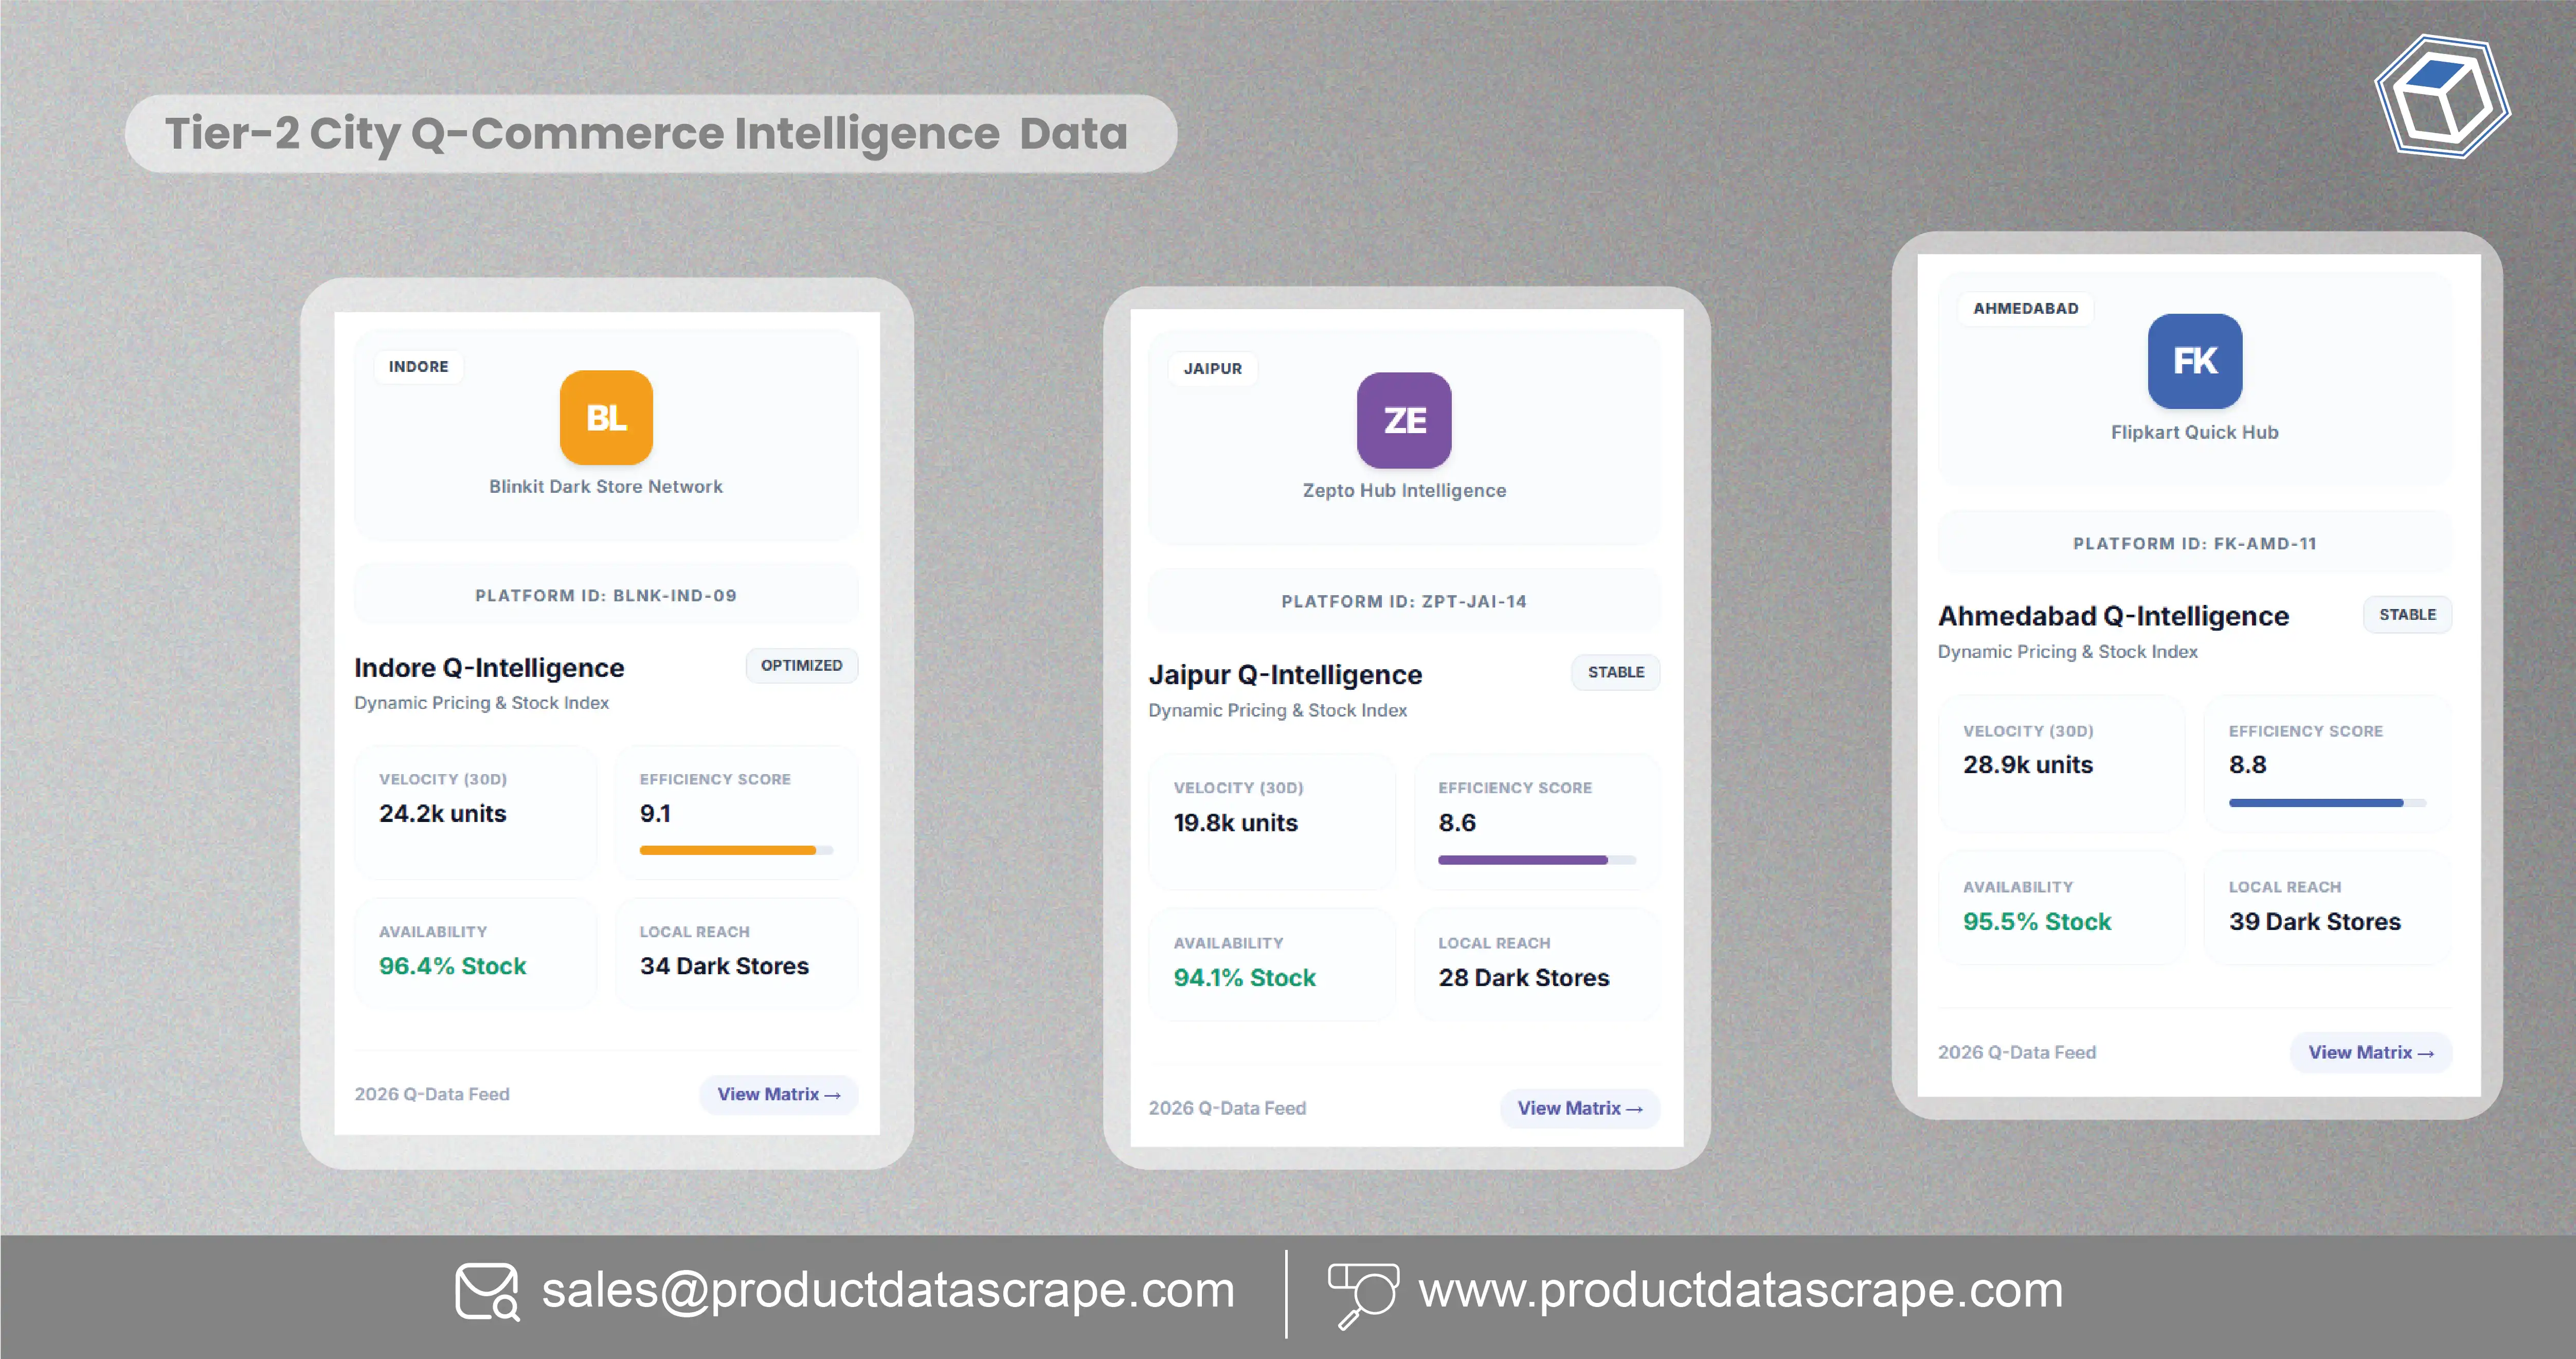
What Can Retailers Learn by Comparing Indore, Jaipur, and Surat?
Tier-2 cities should not be treated as a single homogeneous market. Consumer preferences, population density, purchasing power, local competition, and fulfillment economics can vary substantially.
Dark Store Comparison Across Indore Jaipur Surat can therefore help businesses assess whether three apparently similar growth markets actually offer the same quick-commerce opportunity.
| City |
Intelligence priority |
What to compare |
| Indore |
Demand and service coverage |
Assortment, pincodes, availability |
| Jaipur |
Competitive density |
Stores, pricing, promotions |
| Surat |
Category opportunity |
FMCG assortment, pricing, availability |
The comparison should be based on observed data rather than assumptions. Businesses can create a standardized city score using metrics such as active dark stores, estimated serviceable pincodes, number of listed SKUs, average category availability, competitor overlap, promotional frequency, and price index.
The broader market supports this city-level approach. In 2025, quick-commerce platforms were increasingly moving into Tier-2 and smaller markets. Flipkart Minutes operated in cities including Jaipur, while Zepto reported positive traction in Jaipur and Chandigarh. (The Economic Times)
At the same time, RedSeer reported that non-metro representatives of 90+ cities accounted for just over 20% of quick-commerce GMV in the first five months of 2025, despite the much larger role these cities play in the overall retail market. (Redseer Strategy Consultants)
That gap is important. It indicates both opportunity and risk.
From 2020 to 2026, retailers have gained access to increasingly granular digital signals. Early analysis focused mainly on whether quick commerce existed. Current analysis can examine which neighborhoods are covered, which brands are visible, what products are stocked, and how pricing differs.
For example, a beverage company could compare Coca-Cola, Pepsi, and regional beverages across the three cities. A personal-care brand could compare Dove, Nivea, and competing products. A packaged-food business could examine Maggi, Britannia, Lay's, and other high-frequency products.
The objective is not simply to identify the "best" city. It is to understand why each city behaves differently and align assortment, pricing, and distribution with local conditions.
How Should Retailers Plan Dark-Store Expansion in 2026?
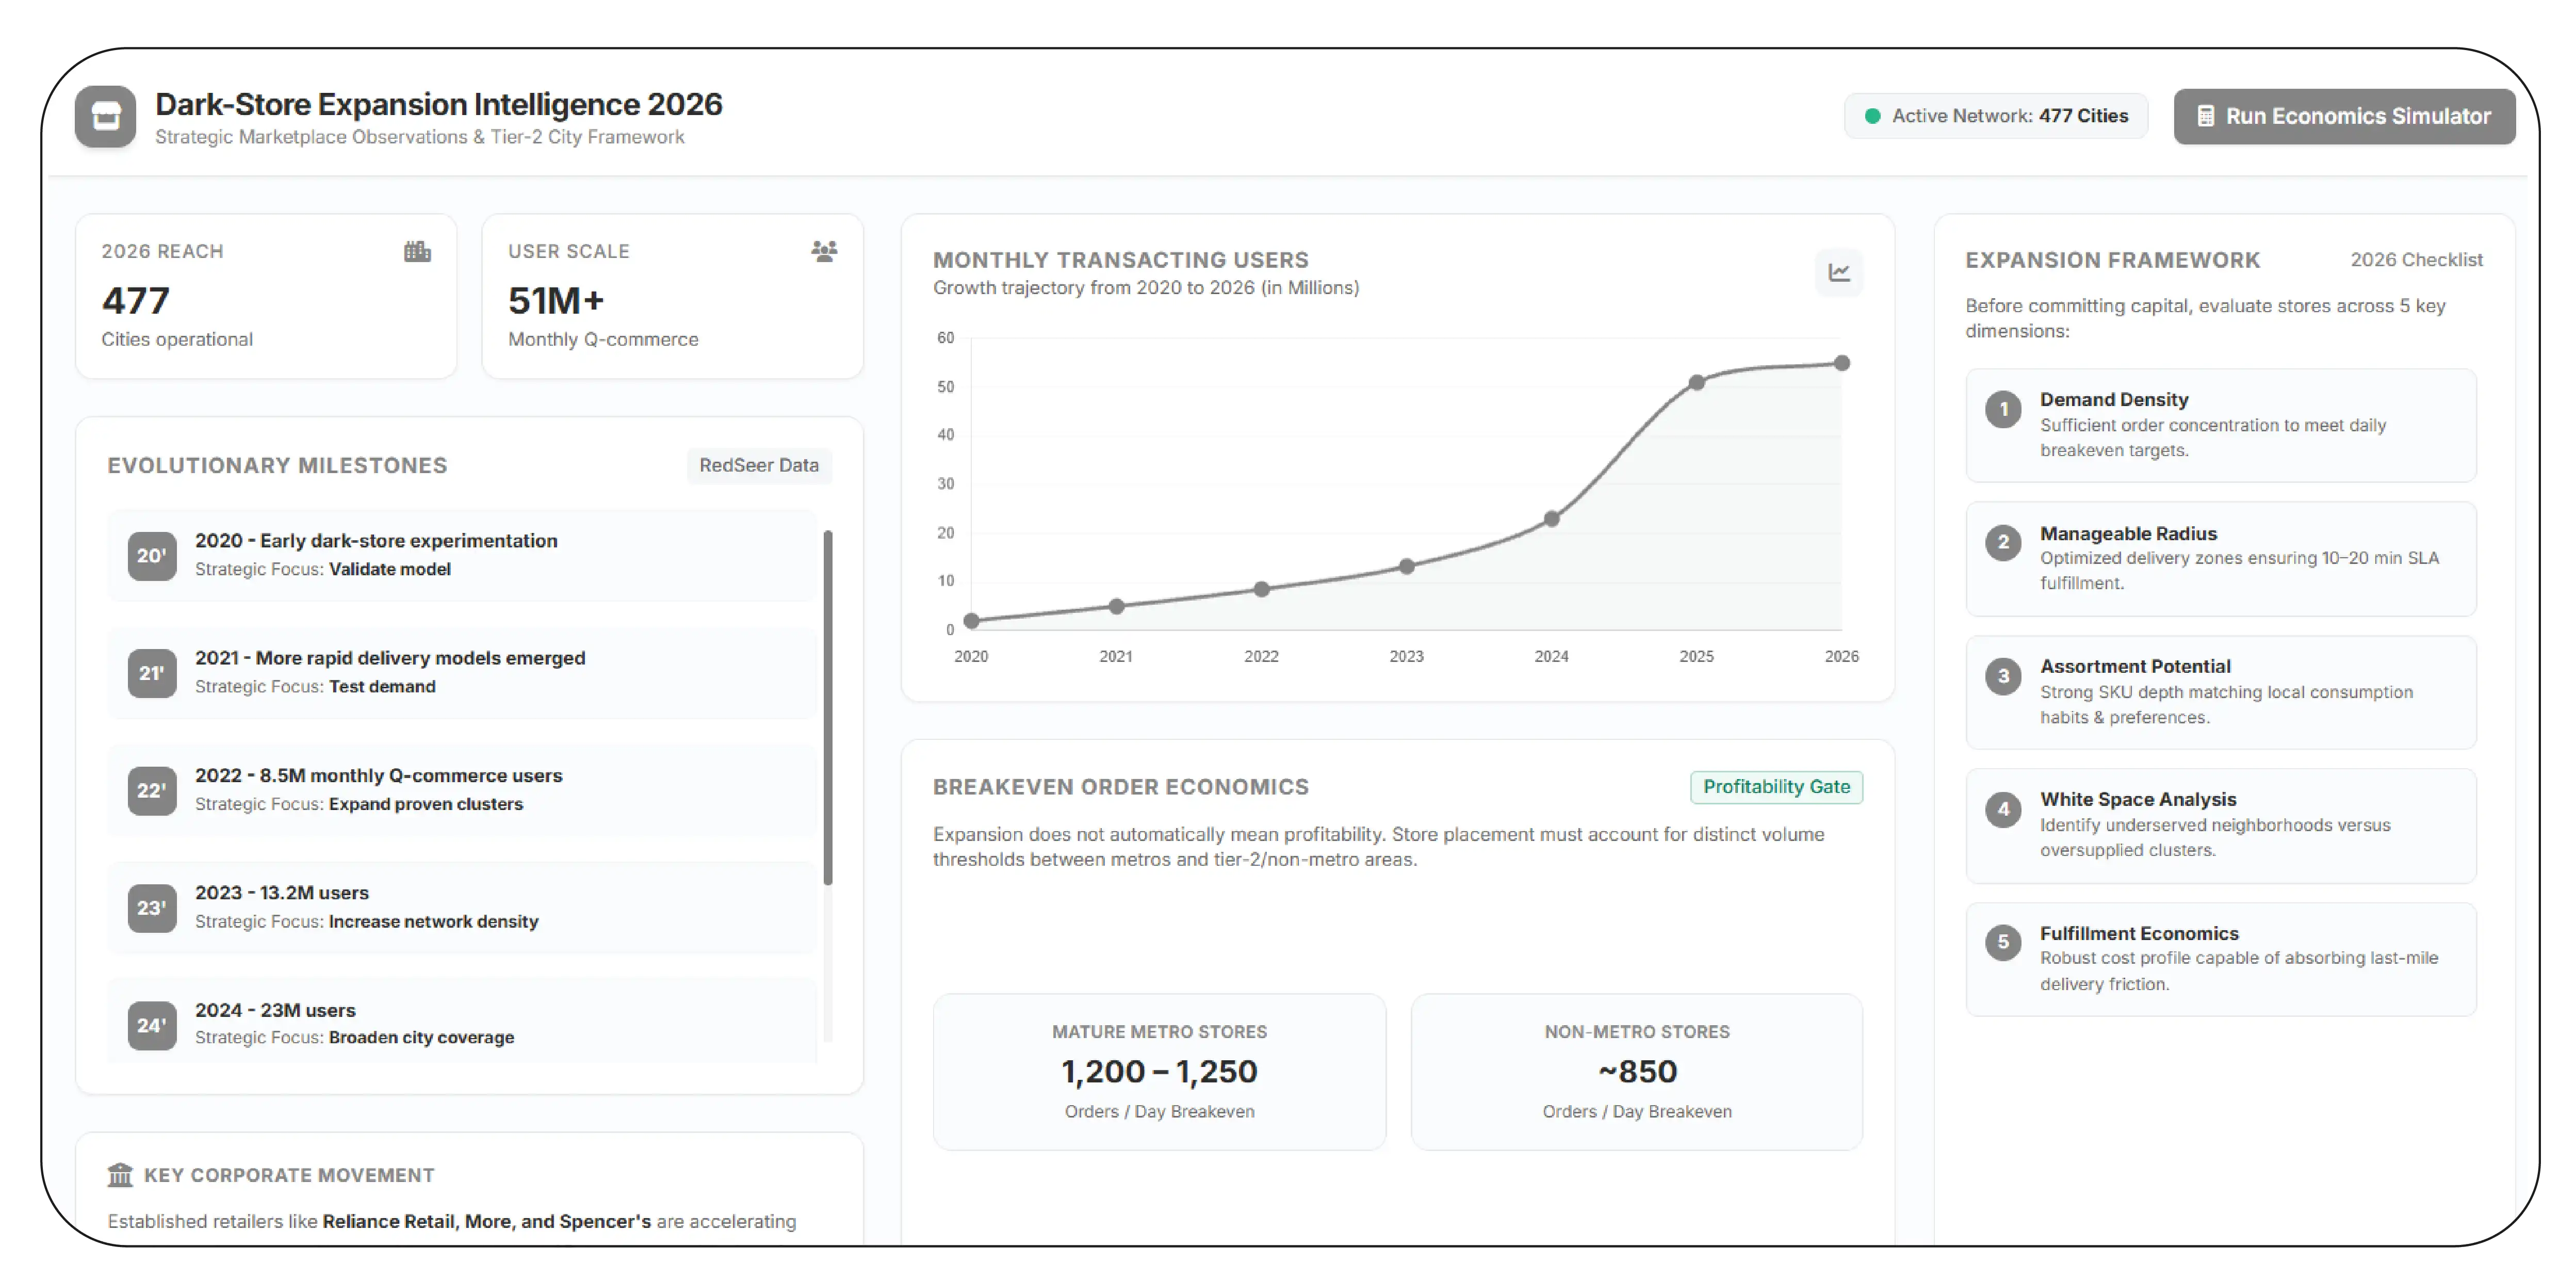
Expansion decisions require more than population or income data. A successful dark store needs sufficient demand density, manageable delivery radius, strong assortment potential, and an economics profile capable of supporting fulfillment costs.
Dark Store Expansion in Tier-2 Cities 2026 should therefore be evaluated using a combination of marketplace observations and location intelligence.
| Year |
Expansion signal |
Strategic focus |
| 2020 |
Early dark-store experimentation |
Validate model |
| 2021 |
More rapid delivery models emerged |
Test demand |
| 2022 |
8.5M monthly Q-commerce users |
Expand proven clusters |
| 2023 |
13.2M users |
Increase network density |
| 2024 |
23M users |
Broaden city coverage |
| 2025 |
51M users |
Accelerate beyond metros |
| 2026 |
477 cities reported |
Optimize network economics |
RedSeer's user data shows the dramatic increase in monthly transacting users, while 2026 reporting indicates that quick commerce has expanded to 477 cities. (Redseer Strategy Consultants)
However, expansion does not automatically mean profitability. RedSeer's 2026 analysis found that mature metro dark stores can operate around a 1,200–1,250 order-per-day breakeven range, while non-metro stores were averaging closer to 850 orders per day. (Redseer Strategy Consultants)
This distinction is critical for retailers.
A city may demonstrate rapid order growth but still require careful store placement and assortment planning. Businesses should therefore analyze competitor store density, estimated service radius, product assortment, availability patterns, and local demand signals before committing to expansion.
Dark-store data can also reveal white spaces. If several competitors operate around one cluster but another high-demand neighborhood has limited coverage, that area could become a potential opportunity. Conversely, an oversupplied neighborhood may create intense competition and higher customer-acquisition pressure.
The 2025 experience also shows that established companies are becoming more comfortable with the model. Reliance Retail, More, and Spencer's were reported to be adding standalone dark stores, while More had already established 45 and planned another 100. (The Economic Times)
The practical lesson for 2026 is clear: store expansion should be data-led, not simply footprint-led.
How Does India Compare With the Global Quick-Commerce Evolution?
India's quick-commerce development is part of a wider global shift toward hyperlocal, rapid fulfillment. Global quick commerce data helps retailers understand which operating models are transferable and which depend on local market conditions.
| Year |
Global quick-commerce development |
Relevance for India |
| 2020 |
COVID accelerated online grocery adoption |
Rapid digital behavior change |
| 2021 |
Gopuff, Gorillas and similar models gained attention |
Delivery expectations changed |
| 2022 |
Dark-store models expanded across markets |
Local fulfillment became strategic |
| 2023 |
Platforms diversified beyond groceries |
Category expansion accelerated |
| 2024 |
Operators focused increasingly on efficiency |
Unit economics became critical |
| 2025 |
Global models emphasized density and convenience |
Indian players expanded beyond metros |
| 2026 |
India reached 477-city quick-commerce coverage |
Local intelligence became essential |
McKinsey noted that global quick-commerce models were using dark stores or satellite stores positioned close to concentrated demand, with delivery windows sometimes as short as 15–20 minutes. (McKinsey & Company)
India has developed a particularly large and fast-growing version of this model. RedSeer estimates that quick commerce closed FY26 at approximately $13–14 billion, representing around 17% of online retail GMV. (Redseer Strategy Consultants)
The evolution from 2020 to 2026 shows three major shifts.
First, speed became an expectation. Consumers increasingly use quick commerce for routine top-ups rather than only emergencies.
Second, assortment expanded. Platforms increasingly moved beyond groceries into electronics, beauty, home improvement, toys, lifestyle, and other categories. (ETRetail.com)
Third, geographic coverage broadened. India moved from a metro-heavy model toward hundreds of cities, creating a new layer of local competition.
For global brands, this means a national strategy is insufficient. The same SKU can have different visibility, availability, pricing, and competitive intensity across cities.
Retailers can learn from global markets by tracking delivery radii, dark-store formats, SKU density, fulfillment economics, and category expansion. But the final decision must reflect India's local conditions, including fragmented retail, regional preferences, pincode-level demand, and varying city economics.
Why Should Retailers Choose a Data-Led Intelligence Approach?
Retailers need more than raw marketplace listings. They need structured, repeatable intelligence that connects product, price, availability, location, and competitor signals.
Dark-store inventory tracking helps businesses understand which products are visible and potentially serviceable in specific markets. Scraping Map Every Dark Store Coordinates can further support geographic analysis by organizing location signals into a usable map layer for competitive coverage, service-radius assessment, and expansion planning.
A robust workflow can monitor Blinkit, Zepto, Swiggy Instamart, BigBasket, Flipkart Minutes, and other relevant platforms while standardizing product and location attributes.
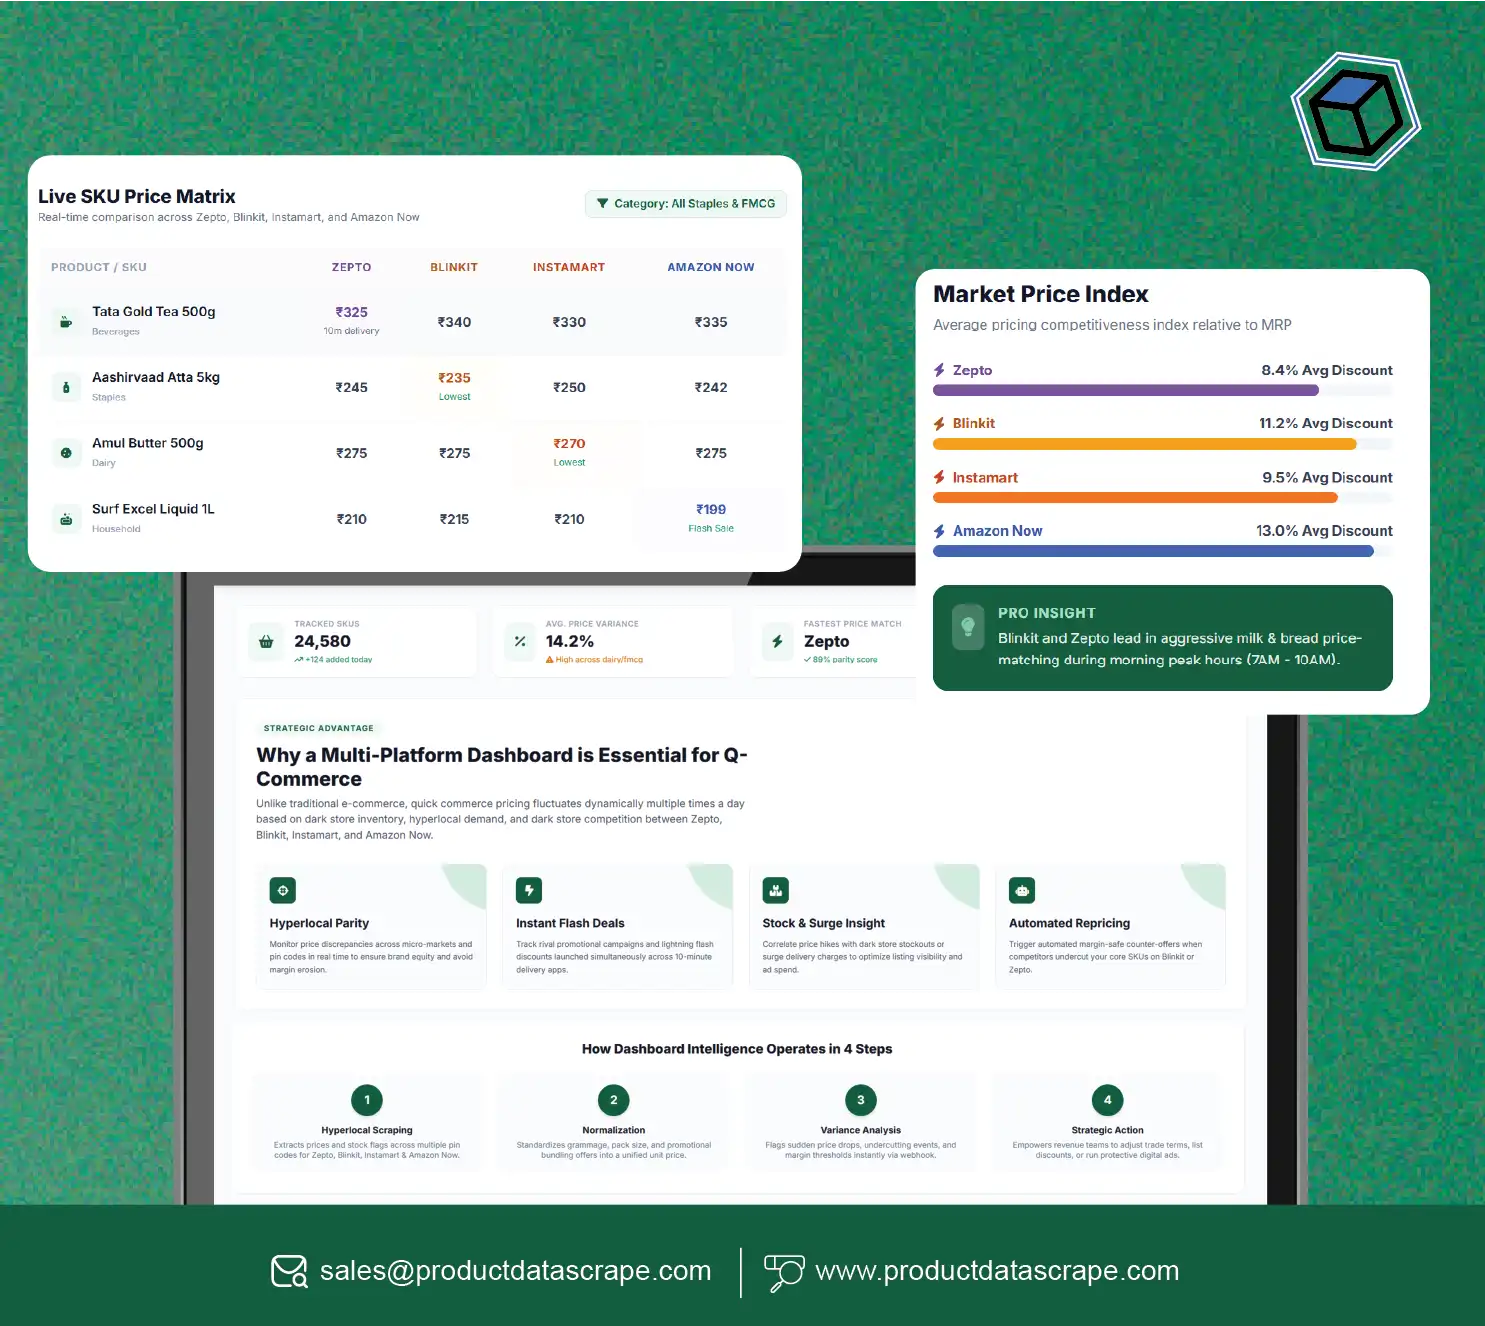
The benefit is a single intelligence framework that supports category managers, pricing teams, supply-chain leaders, and expansion teams. Instead of asking only where competitors operate, businesses can ask what they stock, what they charge, which products are unavailable, and where competitive gaps exist.
Conclusion
Quick commerce is entering a more localized phase. India's expansion to 477 cities, rising non-metro orders, and increasing dark-store investment show that the next growth opportunity will depend heavily on city-level execution. (The Economic Times)
Dark Store Data Scraping for Quick Commerce gives retailers a practical way to monitor store footprints, assortment, pricing, availability, and competitive coverage. Combined with Assortment analytics, these signals can support better decisions about local pricing, inventory, product selection, and expansion.
For retailers entering cities such as Indore, Jaipur, Surat, Lucknow, Nagpur, and Ahmedabad, granular data can reveal opportunities that national averages cannot.
Product Data Scrape helps businesses convert marketplace signals into structured intelligence for smarter quick-commerce decisions.
Ready to identify local pricing, assortment, availability, and dark-store opportunities? Partner with Product Data Scrape to build a scalable quick-commerce intelligence framework for your target cities!
FAQs
1. What is Tier-2 quick-commerce intelligence?
It combines city-level pricing, availability, assortment, competitor, and dark-store data to help retailers understand emerging-market opportunities and improve local decisions.
2. Why monitor dark stores?
Dark-store monitoring reveals competitor coverage, service areas, expansion patterns, and potential geographic gaps that can influence assortment and fulfillment strategy.
3. Which cities can businesses monitor?
Retailers can monitor markets such as Jaipur, Indore, Surat, Lucknow, Ahmedabad, Nagpur, Chandigarh, and other cities where quick-commerce platforms operate.
4. How does Product Data Scrape support quick-commerce analysis?
It can structure marketplace data into datasets covering products, prices, availability, competitors, locations, and other relevant retail intelligence signals.
5. Can this intelligence support expansion decisions?
Yes. Businesses can compare city maturity, competitor density, assortment depth, availability, and dark-store coverage before prioritizing new markets.


 Singapore
 EMAIL
EMAIL
 PHONE
PHONE















.webp)






