Introduction
Dark Store Data Scraping for Quick Commerce helps brands, retailers, and quick-commerce operators monitor SKU availability, prices, assortment, store coverage, delivery promises, and competitor activity across hyperlocal fulfillment networks. By connecting these signals, businesses can identify stockout risks, discover coverage gaps, compare delivery performance, and improve inventory decisions before shoppers encounter unavailable products.
India's quick-commerce sector has expanded rapidly since 2020. RedSeer estimated the Indian quick-commerce market at approximately $0.3 billion in 2021 and projected it could reach $5 billion by 2025. More recent research estimates India's quick-commerce market reached $5.48 billion in 2024 and projects continued growth through 2029.
The operating model depends on dense networks of dark stores positioned close to customers. Swiggy's corporate filing notes that Indian quick-commerce delivery times had already reached approximately 10–20 minutes by 2023, compared with roughly 30 minutes for many leading global players.
That speed creates a data problem. A SKU can be available in one neighborhood and unavailable in another. A competitor can offer a lower price from a nearby store. A delivery promise can change according to location, inventory, distance, traffic, or demand.
For category managers, marketplace teams, FMCG brands, and quick-commerce operators, monitoring these variables at store and location level creates a clearer picture of where revenue and customer experience are being lost.
Why do dark-store data and stock availability matter for quick commerce?
Quick commerce operates differently from conventional e-commerce because inventory is distributed across many small fulfillment locations rather than concentrated in a few large warehouses. This means a product's availability is inherently local.
A customer in one neighborhood may see a 10-minute delivery promise while another customer several kilometers away sees the same SKU as unavailable or receives a longer delivery estimate. Therefore, national or city-level inventory averages can conceal important local differences.
The commercial consequences are straightforward:
- An unavailable SKU cannot be purchased.
- A missing variant can push shoppers toward competitors.
- A higher delivery fee can reduce order attractiveness.
- A longer ETA can weaken the convenience proposition.
- A competitor's nearby store can capture demand.
- A local assortment gap can create an opportunity for expansion.
Current mapping data illustrates the scale. A July 2026 mapping of five major Indian quick-commerce platforms identified 5,625 dark stores across 408 cities and 26 states, covering 2,843 neighborhoods.
| Year |
Key quick-commerce development |
Data implication |
| 2020 |
Quick-commerce addressable market estimated at $50B |
Strong opportunity for hyperlocal models |
| 2021 |
Market estimated at about $0.3B |
Rapid adoption begins accelerating |
| 2022 |
$5.5B 2025 market projection |
Store-network expansion becomes strategic |
| 2023 |
Typical delivery times reach 10–20 minutes |
Location-level monitoring becomes critical |
| 2024 |
Market estimated at $5.48B |
Inventory and assortment scale increases |
| 2025 |
Market forecast at $6.78B |
Greater competitive intensity |
| 2026 |
5,625 mapped stores across 408 cities |
Store-level intelligence becomes increasingly valuable |
Sources: RedSeer/Moneycontrol, Swiggy corporate filing, ResearchAndMarkets/PayNXT360, QuickCommerceMap. Historical estimates use the cited sources' methodologies and should not be treated as directly comparable measurements.
How can brands identify SKU-level availability problems?
Dark Store SKU Availability Tracking enables teams to determine whether specific products are actually available to shoppers across different dark stores and service areas. Instead of assuming that a SKU listed on an app is universally available, brands can examine its availability at individual locations and timestamps.
Scraping Map Every Dark Store creates the geographic foundation required for this analysis. A store-level dataset can include store coordinates, city, neighborhood, platform, serviceability area, product availability, price, seller information, and collection timestamp.
This matters because dark-store networks are highly granular. QuickCommerceMap's 2026 dataset identifies 5,625 stores across 408 cities, while its August dataset contains 6,621 stores before applying the public-map display criteria.
For brands, the key question is not simply "How many stores carry this product?" It is "Which high-demand customer areas cannot currently purchase this product?"
| SKU condition |
Location-level observation |
Potential consequence |
| In stock everywhere |
Strong distribution |
Healthy availability |
| OOS in selected stores |
Localized inventory gap |
Lost local sales |
| OOS across multiple stores |
Network-level issue |
Replenishment problem |
| Available only in distant stores |
Weak proximity |
Longer delivery promise |
| Missing from competitor stores |
Assortment opportunity |
Potential distribution expansion |
| New SKU absent |
Slow rollout |
Missed launch demand |
The same approach can be used for FMCG, personal care, beverages, snacks, household products, electronics accessories, and other quick-commerce categories.
A useful workflow is to assign every SKU an availability score based on store coverage, stock status, demand potential, and competitor availability. High-demand products with repeated local stockouts should receive priority over low-volume products with occasional gaps.
The outcome is a more precise inventory conversation. Instead of saying "availability is low," teams can identify exactly which products, stores, neighborhoods, and time periods require action.
How can businesses measure quick-commerce coverage across markets?
Dark Store Coverage Data for Q-Commerce helps operators understand how deeply each platform penetrates a city or neighborhood. Coverage analysis combines store locations with service areas, population clusters, competitor presence, and assortment availability.
This is especially useful when evaluating expansion. A city may contain hundreds of stores, yet specific neighborhoods can remain underserved. Current mapping shows that India's quick-commerce footprint is concentrated unevenly: 5,625 mapped stores span 408 cities, while the top five states account for 56% of stores.
Coverage analysis can therefore answer questions such as:
- Which neighborhoods have only one major quick-commerce platform?
- Where do competitors have overlapping dark stores?
- Which high-density areas have limited coverage?
- Which cities have room for new fulfillment locations?
- Where is a brand's assortment underrepresented?
- Which stores compete for the same customer base?
| Coverage metric |
What it reveals |
Business use |
| Stores per city |
Market depth |
Expansion planning |
| Stores per neighborhood |
Local density |
Network optimization |
| Platform overlap |
Competitive intensity |
Competitive strategy |
| Service radius |
Reach from each store |
Delivery planning |
| SKU coverage |
Assortment strength |
Brand distribution |
| Coverage gaps |
Underserved areas |
Expansion opportunities |
Historical growth makes this increasingly important. Swiggy reported that quick commerce's share of online retail rose from approximately 0.14% in 2018 to 4.8% in 2023, with substantial growth expected thereafter.
By 2026, the network had expanded to hundreds of cities. That means a city-by-city strategy alone is no longer enough. Brands need neighborhood-level visibility.
For a brand entering a new market, coverage data can also help prioritize distribution discussions. If competitors have strong store coverage but the brand's products appear in only a small percentage of those locations, the problem may be distribution rather than consumer demand.
How can analytics connect store-level data with commercial decisions?
Quick Commerce Dark Store Data Analytics transforms raw observations into patterns that category managers and operations teams can act upon.
A single scrape can tell a team whether a product is available. A historical dataset can reveal whether the product repeatedly becomes unavailable at particular stores, whether competitor prices move before stockouts, or whether certain locations consistently carry more variants.
The analytical layer should connect five dimensions: product, location, competitor, time, and commercial signal.
For example, if a beverage SKU goes out of stock every Friday evening at several high-volume stores, the pattern may indicate predictable weekend demand rather than random replenishment failure. A brand could then recommend additional inventory allocation before the demand spike.
| Analytical question |
Data required |
Possible action |
| Which SKUs stock out most often? |
SKU + availability history |
Prioritize replenishment |
| Where are competitors stronger? |
Store + competitor assortment |
Improve distribution |
| Which areas have price gaps? |
Location + price history |
Review local pricing |
| Where are delivery promises weaker? |
Store + ETA history |
Investigate capacity |
| Which products gain visibility? |
Search/ranking + SKU |
Improve merchandising |
| Which stores need more assortment? |
SKU-store matrix |
Adjust allocation |
Market growth increases the value of this analysis. PayNXT360 estimates that India's quick-commerce market grew at a 71.2% CAGR during 2020–2024 and forecasts a 17.6% CAGR from 2025 to 2029.
As networks expand, manual spreadsheet analysis becomes harder to maintain. Structured historical datasets allow teams to identify recurring patterns rather than treating every stockout as an isolated incident.
Analytics can also support demand planning. When availability, price, promotion, and competitor activity are analyzed together, teams can distinguish between supply problems and competitive problems.
That distinction matters. If every competitor is also out of stock, supply constraints may explain the issue. If competitors remain available while one brand repeatedly disappears, the problem may be allocation, replenishment, or assortment execution.
How can brands detect availability changes before they become sales problems?
Real-Time Dark Store Availability Monitoring provides a faster way to detect product-level changes across distributed fulfillment networks.
The phrase "real-time" should be defined operationally. Public web data may not always update instantly, and scraping frequency depends on platform behavior, technical accessibility, and collection architecture. A practical system can instead establish frequent monitoring intervals and alert teams when meaningful changes occur.
The objective is not to collect every possible observation. It is to detect commercially important changes quickly.
For example, an alert can be generated when:
- A high-priority SKU changes from available to unavailable.
- Availability falls across multiple nearby stores.
- A competitor remains available while the brand is unavailable.
- A key product disappears from a retailer's assortment.
- Delivery time increases beyond an agreed threshold.
- Delivery fees change materially.
- A promotion remains active but inventory becomes unavailable.
India's rapid delivery model makes timing especially important. Swiggy's filing reported typical quick-commerce delivery times of 10–20 minutes in 2023.
| Alert type |
Trigger example |
Team responsible |
| Stockout |
Hero SKU becomes unavailable |
Supply/operations |
| Coverage loss |
Store disappears from service area |
Network team |
| Competitor availability |
Rival SKU remains available |
Category team |
| ETA deterioration |
Delivery promise increases |
Operations |
| Fee increase |
Delivery charge rises |
Commercial team |
| Assortment loss |
SKU disappears |
Account/category team |
The advantage of frequent monitoring is historical context. If an SKU becomes unavailable once, it may be a normal operational event. If the same SKU becomes unavailable every evening for two weeks, it represents a recurring problem.
A strong monitoring system therefore stores every observation with a timestamp. This makes it possible to calculate stockout frequency, duration, store-level availability rates, and competitor availability ratios.
The resulting insight is more useful than a simple "in stock/out of stock" label because it identifies the severity and persistence of the issue.
How can location data improve dark-store expansion decisions?
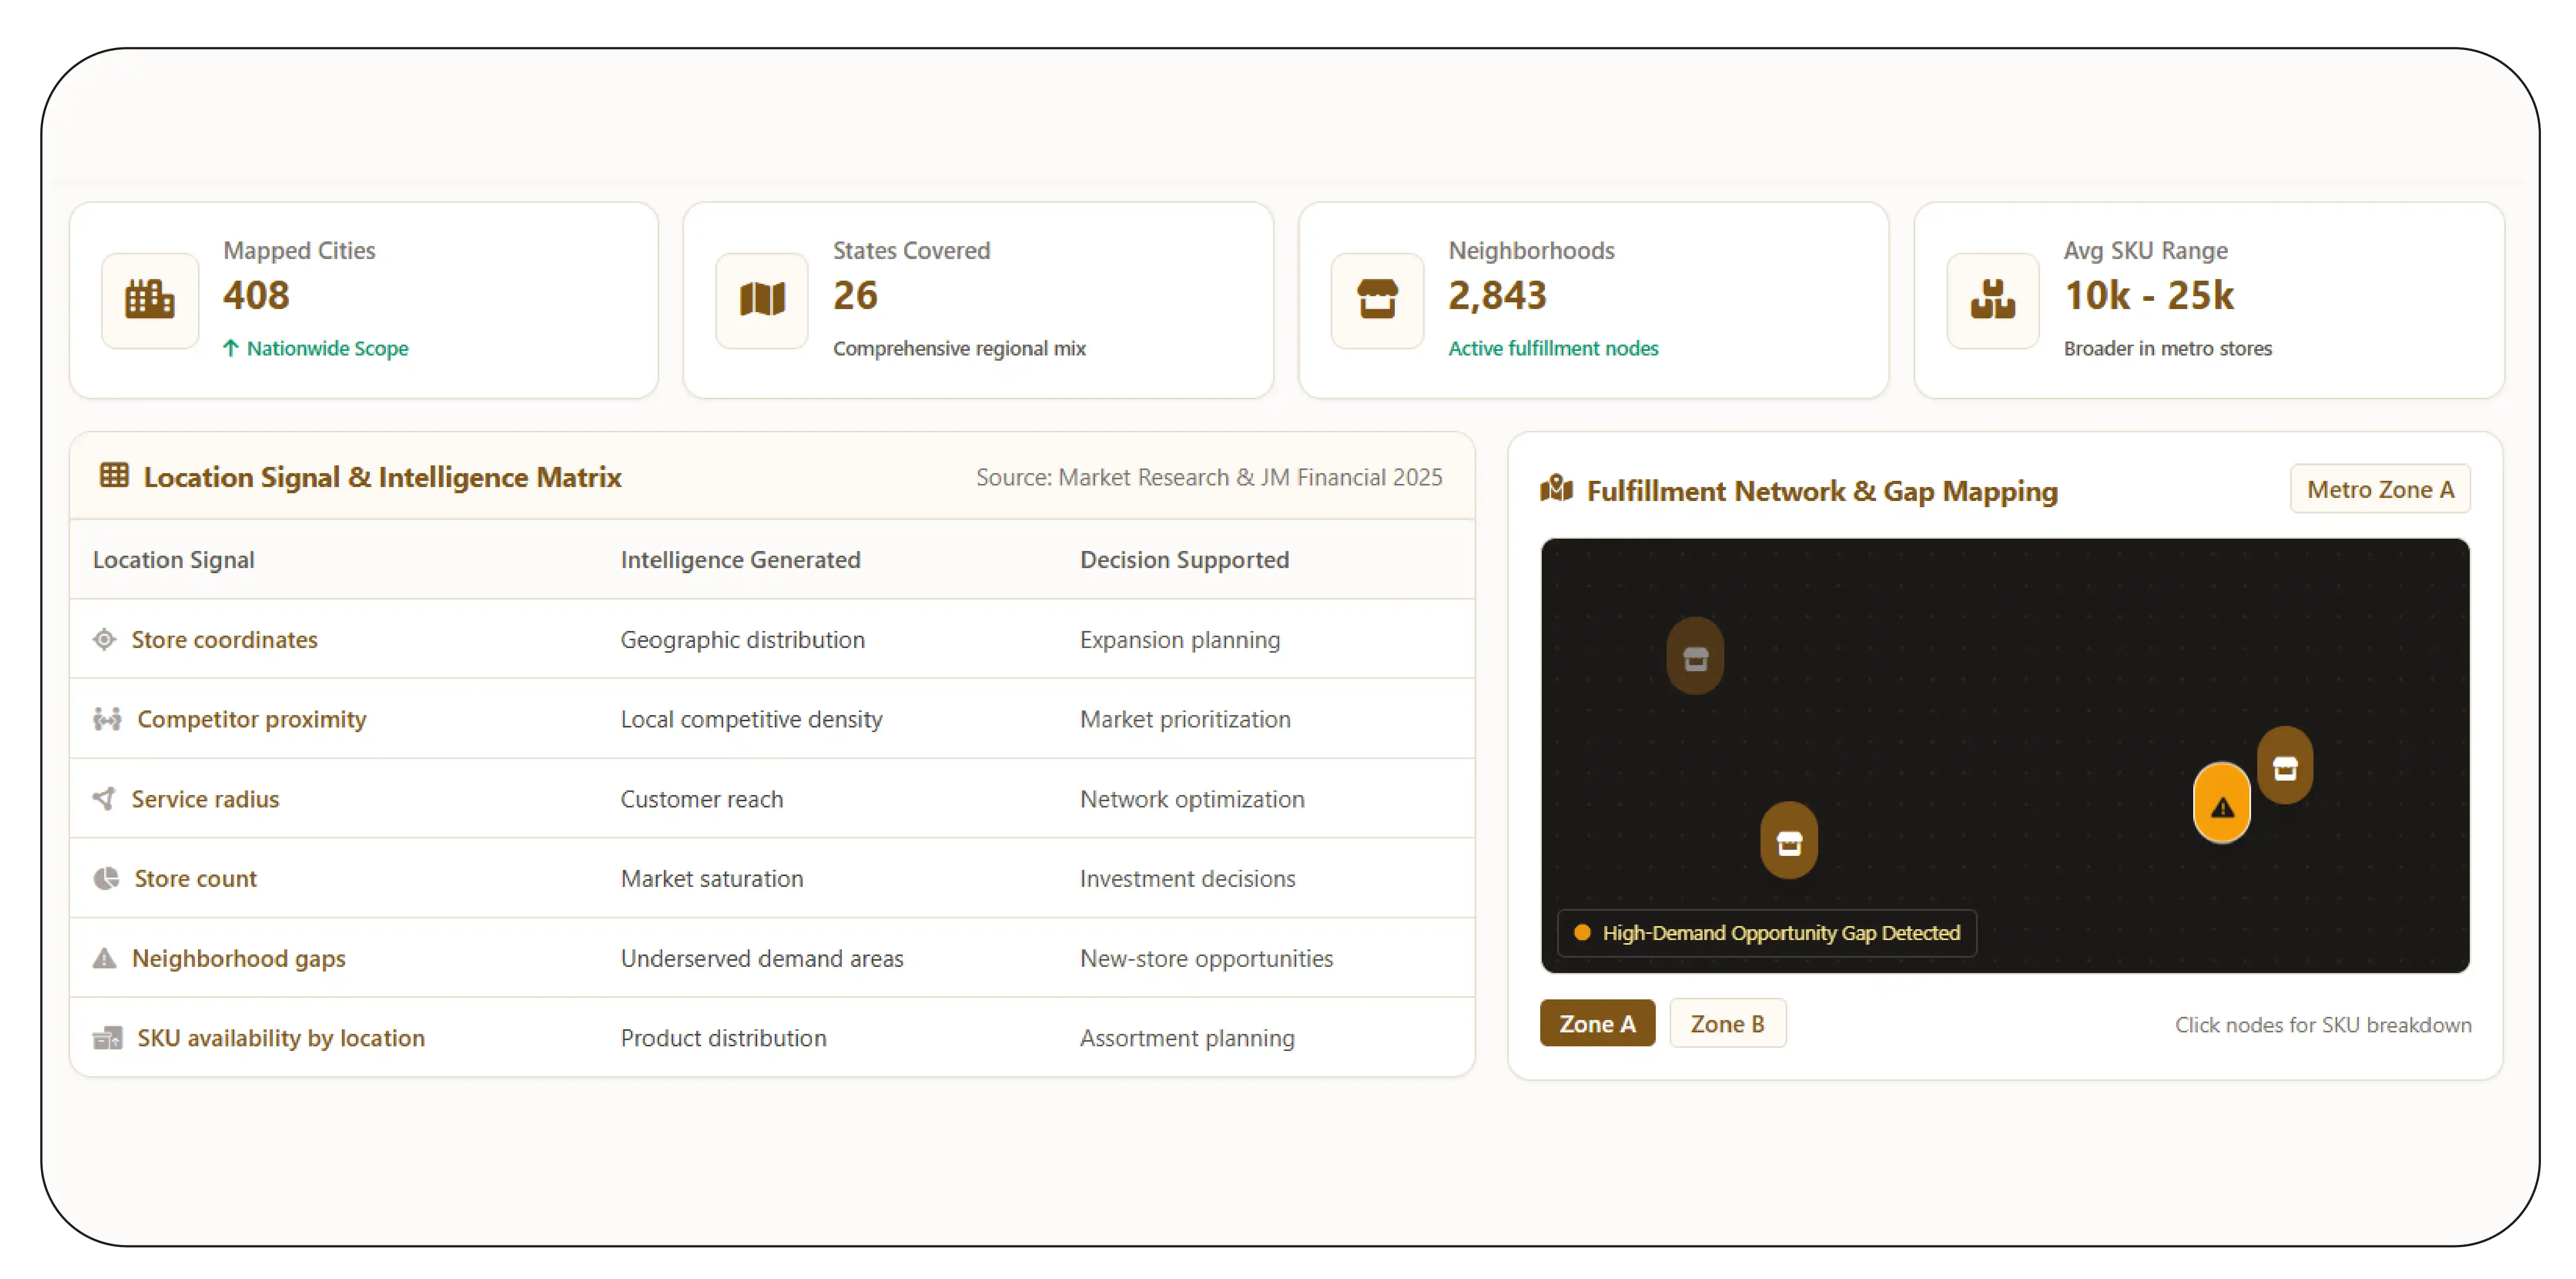
Dark Store Location Intelligence API can provide structured geographic information for mapping fulfillment networks, analyzing competitor proximity, and evaluating underserved neighborhoods.
Location intelligence becomes valuable when store coordinates are combined with product and market data. A map alone shows where stores exist. A combined dataset can reveal which stores serve overlapping neighborhoods, which areas lack competitive coverage, and where a product's availability is weakest.
Current public mapping provides a useful illustration of the scale. In July 2026, five major platforms were mapped across 408 cities and 26 states, with 2,843 distinct neighborhoods represented.
| Location signal |
Intelligence generated |
Decision supported |
| Store coordinates |
Geographic distribution |
Expansion planning |
| Competitor proximity |
Local competitive density |
Market prioritization |
| Service radius |
Customer reach |
Network optimization |
| Store count |
Market saturation |
Investment decisions |
| Neighborhood gaps |
Underserved demand areas |
New-store opportunities |
| SKU availability by location |
Product distribution |
Assortment planning |
JM Financial's 2025 field research found that dark stores commonly carried approximately 10,000–25,000 SKUs, with metro stores generally carrying broader assortments. Its research also showed that delivery radii varied by store and platform.
This demonstrates why location intelligence should not be treated as a simple address database.
For brands, geographic analysis can reveal where products have weak distribution despite strong category demand. For operators, it can identify areas where a new dark store could improve serviceability.
A location intelligence layer can also support competitive benchmarking. If two platforms have stores within a small radius but one consistently offers a broader assortment or faster delivery promise, the difference may reveal operational advantages worth investigating.
The most useful model combines store coordinates, service areas, SKU availability, prices, delivery fees, delivery times, and competitor presence into one geographic dataset.
How can inventory tracking reduce recurring stockouts?
Dark-store inventory tracking helps brands and operators identify where product availability is repeatedly failing and where inventory allocation needs adjustment.
The challenge is that dark-store inventory is dynamic. Product availability can change throughout the day because of customer orders, replenishment, substitutions, operational constraints, or demand spikes. A periodic snapshot may therefore miss the pattern.
Dark Store Data Scraping for Quick Commerce can create a historical layer by collecting observable product and availability signals repeatedly. The resulting dataset can show when a SKU appeared, disappeared, returned, changed price, or became unavailable across individual stores.
The approach is particularly valuable for high-velocity SKUs. If a product repeatedly disappears during predictable demand periods, teams can investigate whether replenishment cycles, safety-stock policies, or store-level allocation need adjustment.
| Inventory signal |
Pattern |
Recommended response |
| Frequent short stockouts |
Repeated daily gaps |
Increase replenishment frequency |
| Long stockout |
Extended unavailability |
Investigate supply constraint |
| Store-specific stockout |
Isolated locations |
Rebalance allocation |
| Competitor-only availability |
Rival consistently in stock |
Benchmark supply execution |
| Peak-hour stockout |
Demand-linked gap |
Increase peak inventory |
| Wide network stockout |
Multiple stores affected |
Review upstream supply |
The 2020–2026 growth trajectory reinforces the need for this level of visibility. Research estimates India's quick-commerce market grew strongly from 2020 through 2024, while current 2026 mapping shows thousands of dark stores operating across hundreds of cities.
The commercial goal should not be maximum inventory everywhere. Excess inventory creates its own costs, particularly for perishables and low-turnover products. The objective is better allocation.
That means combining availability observations with demand signals, order history, product velocity, store capacity, competitor availability, and delivery performance.
When these datasets are connected, operators can prioritize stores where a stockout has the greatest potential effect on customer experience and revenue.
Why should businesses use Product Data Scrape?
Product Data Scrape provides structured product intelligence that can support quick-commerce monitoring across pricing, availability, assortment, product attributes, and competitor activity.
For brands and retailers, the value comes from turning fragmented online observations into repeatable datasets. Instead of manually checking multiple platforms, teams can organize product records by SKU, retailer, dark store, location, timestamp, price, availability, and delivery information.
This supports several workflows: stockout analysis, assortment benchmarking, competitive price tracking, store coverage research, and historical performance analysis.
It can also help commercial teams move from reactive investigation to proactive monitoring. Historical observations make recurring issues easier to identify, while structured data supports dashboards and automated alerts.
For organizations operating across multiple cities, the ability to compare stores and markets consistently can improve decision-making around inventory, pricing, assortment, and distribution.
What should brands monitor to improve quick-commerce execution?
Hyperlocal pricing intelligence should be combined with inventory, assortment, coverage, and delivery signals rather than analyzed independently. A lower price has limited value if the product is unavailable. Likewise, strong inventory has limited value if the product is poorly positioned or carries an unattractive delivery promise.
Dark Store Data Scraping for Quick Commerce can support a unified monitoring framework in which every observation is tied to a product and location.
The most useful metrics include:
- SKU availability rate
- Stockout frequency
- Stockout duration
- Store coverage
- Competitor availability
- Product price
- Discount percentage
- Delivery fee
- Delivery ETA
- Assortment depth
- Store density
- Local competitor overlap
For decision-makers, these metrics should be prioritized according to business impact. Hero SKUs, high-volume stores, important cities, and strategically significant competitors should receive the highest monitoring frequency.
This creates an exception-driven operating model. Teams do not need to inspect every product manually. They need to know which changes require action and why.
Conclusion
Quick commerce succeeds when products are available close to customers, competitively priced, and delivered within the promised timeframe. Scrape Real-Time Quick Commerce Data to understand how those conditions change across stores, products, neighborhoods, and competitors.
Dark Store Data Scraping for Quick Commerce gives brands and operators a way to build historical visibility into SKU availability, assortment, pricing, store coverage, delivery fees, and delivery promises. That visibility can expose recurring stockouts, weak distribution, competitor advantages, and local expansion opportunities.
The strongest strategy connects data collection with clear business actions: detect the problem, identify the affected store and SKU, prioritize commercial impact, assign responsibility, and measure the outcome.
Use Product Data Scrape to build a structured quick-commerce intelligence workflow and start monitoring dark-store availability, pricing, assortment, and delivery signals at scale!
FAQs
1. What is dark-store data scraping?
It is the structured collection of publicly observable product, price, availability, assortment, location, and delivery information from quick-commerce platforms to support market and operational analysis.
2. How can scraping reduce stockouts?
Historical availability data reveals recurring SKU-level and store-level stockout patterns, helping teams identify demand periods, weak locations, competitor gaps, and replenishment problems requiring intervention.
3. Why monitor dark-store locations?
Location monitoring reveals coverage density, competitor proximity, underserved neighborhoods, overlapping service areas, and potential expansion opportunities for quick-commerce operators and brands.
4. What delivery information should businesses track?
Teams can monitor displayed delivery fees, estimated delivery times, serviceability, changes by location, and differences between competitors to understand the customer-facing convenience proposition.
5. Can Product Data Scrape support quick-commerce intelligence?
Yes. Product Data Scrape can help organize product, pricing, availability, assortment, and competitive observations into structured datasets suitable for monitoring and analysis.
Source note: The historical figures above are from the cited industry, corporate, and mapping sources. Where sources use different definitions or fiscal/calendar periods, the figures are presented as reported rather than combined into a single modeled series.


 Singapore
 EMAIL
EMAIL
 PHONE
PHONE

















.webp)






