Introduction
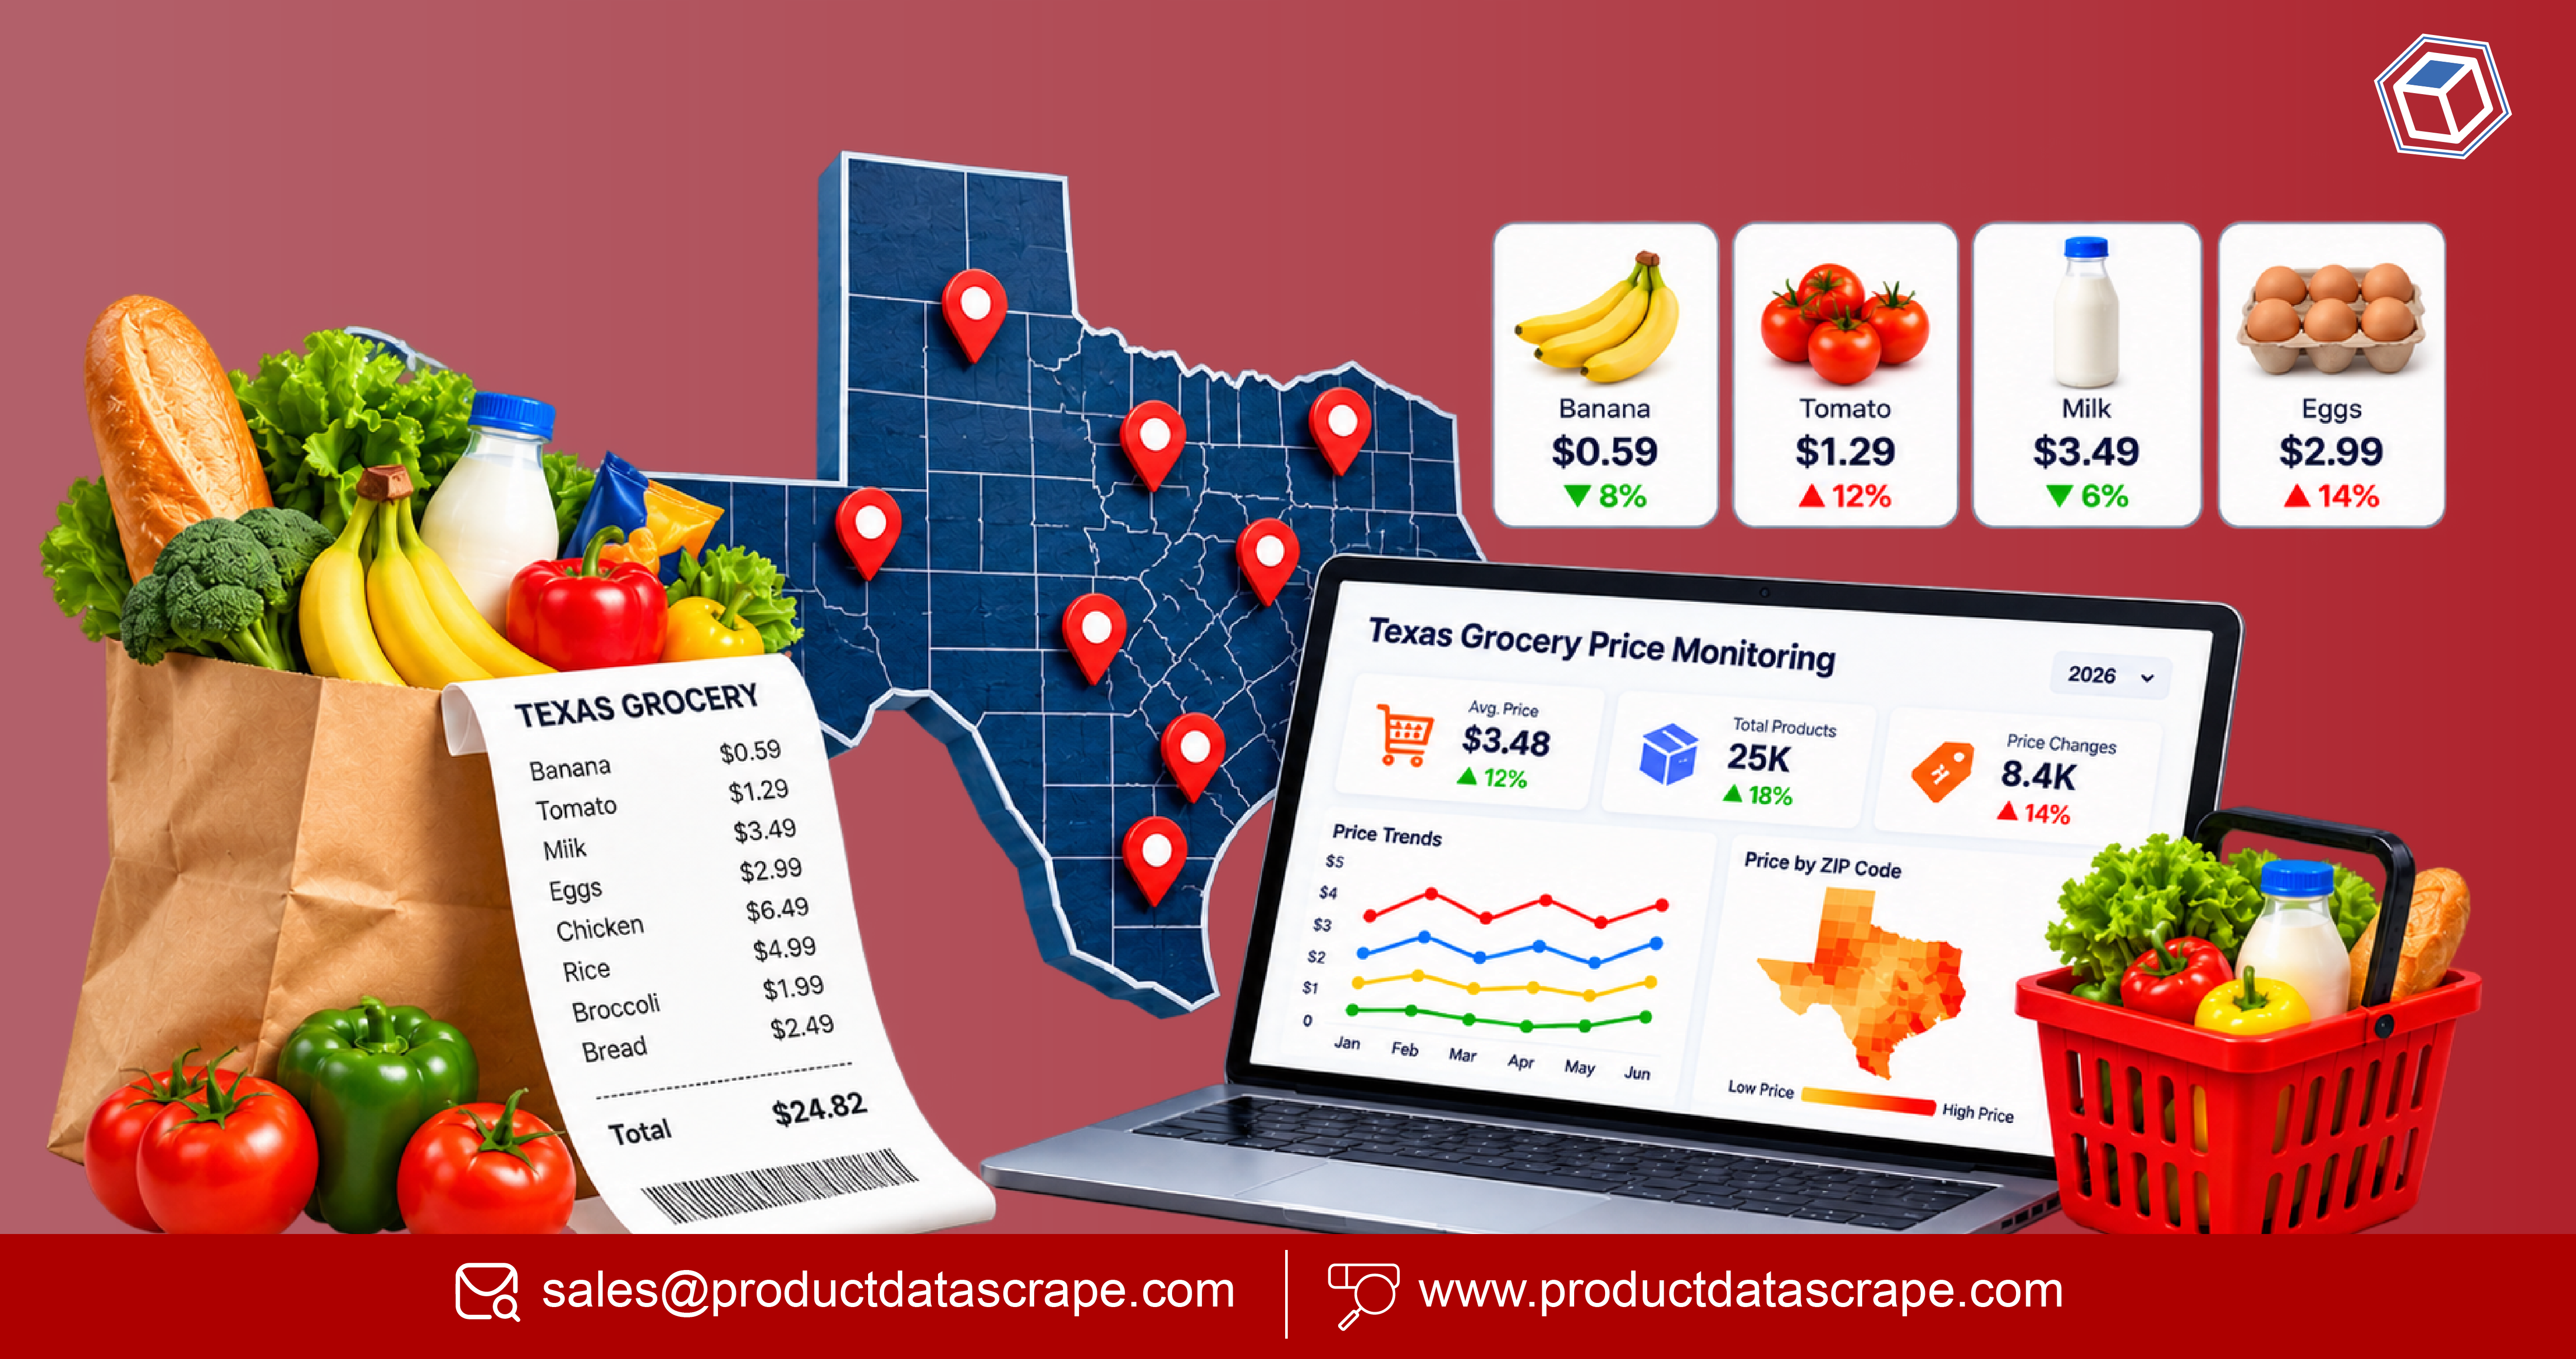
Retailers can use Texas grocery price Monitoring data zip level 2026 to compare local grocery prices, identify neighborhood-level pricing gaps, monitor competitors, and understand how inflation affects individual markets. ZIP-level monitoring adds geographic detail that statewide or national averages cannot provide.
Grocery pricing has experienced major shifts since 2020. USDA data shows that U.S. food-at-home prices increased 3.5% in both 2020 and 2021, surged 11.4% in 2022, increased 5.0% in 2023, 1.2% in 2024, and 2.3% in 2025. For 2026, USDA's August forecast projects food-at-home prices to increase 2.5%. (Bureau of Labor Statistics)
For Texas retailers, brands, grocery chains, CPG companies, and pricing teams, the challenge is no longer simply knowing whether grocery prices are rising. The more important question is: where are prices changing, which products are driving the change, and how do competitors respond at the local level?
ZIP-level data helps answer these questions by connecting products, prices, retailers, promotions, availability, and locations into a structured analytical framework.
How Can Retailers Understand Local Grocery Market Movements?
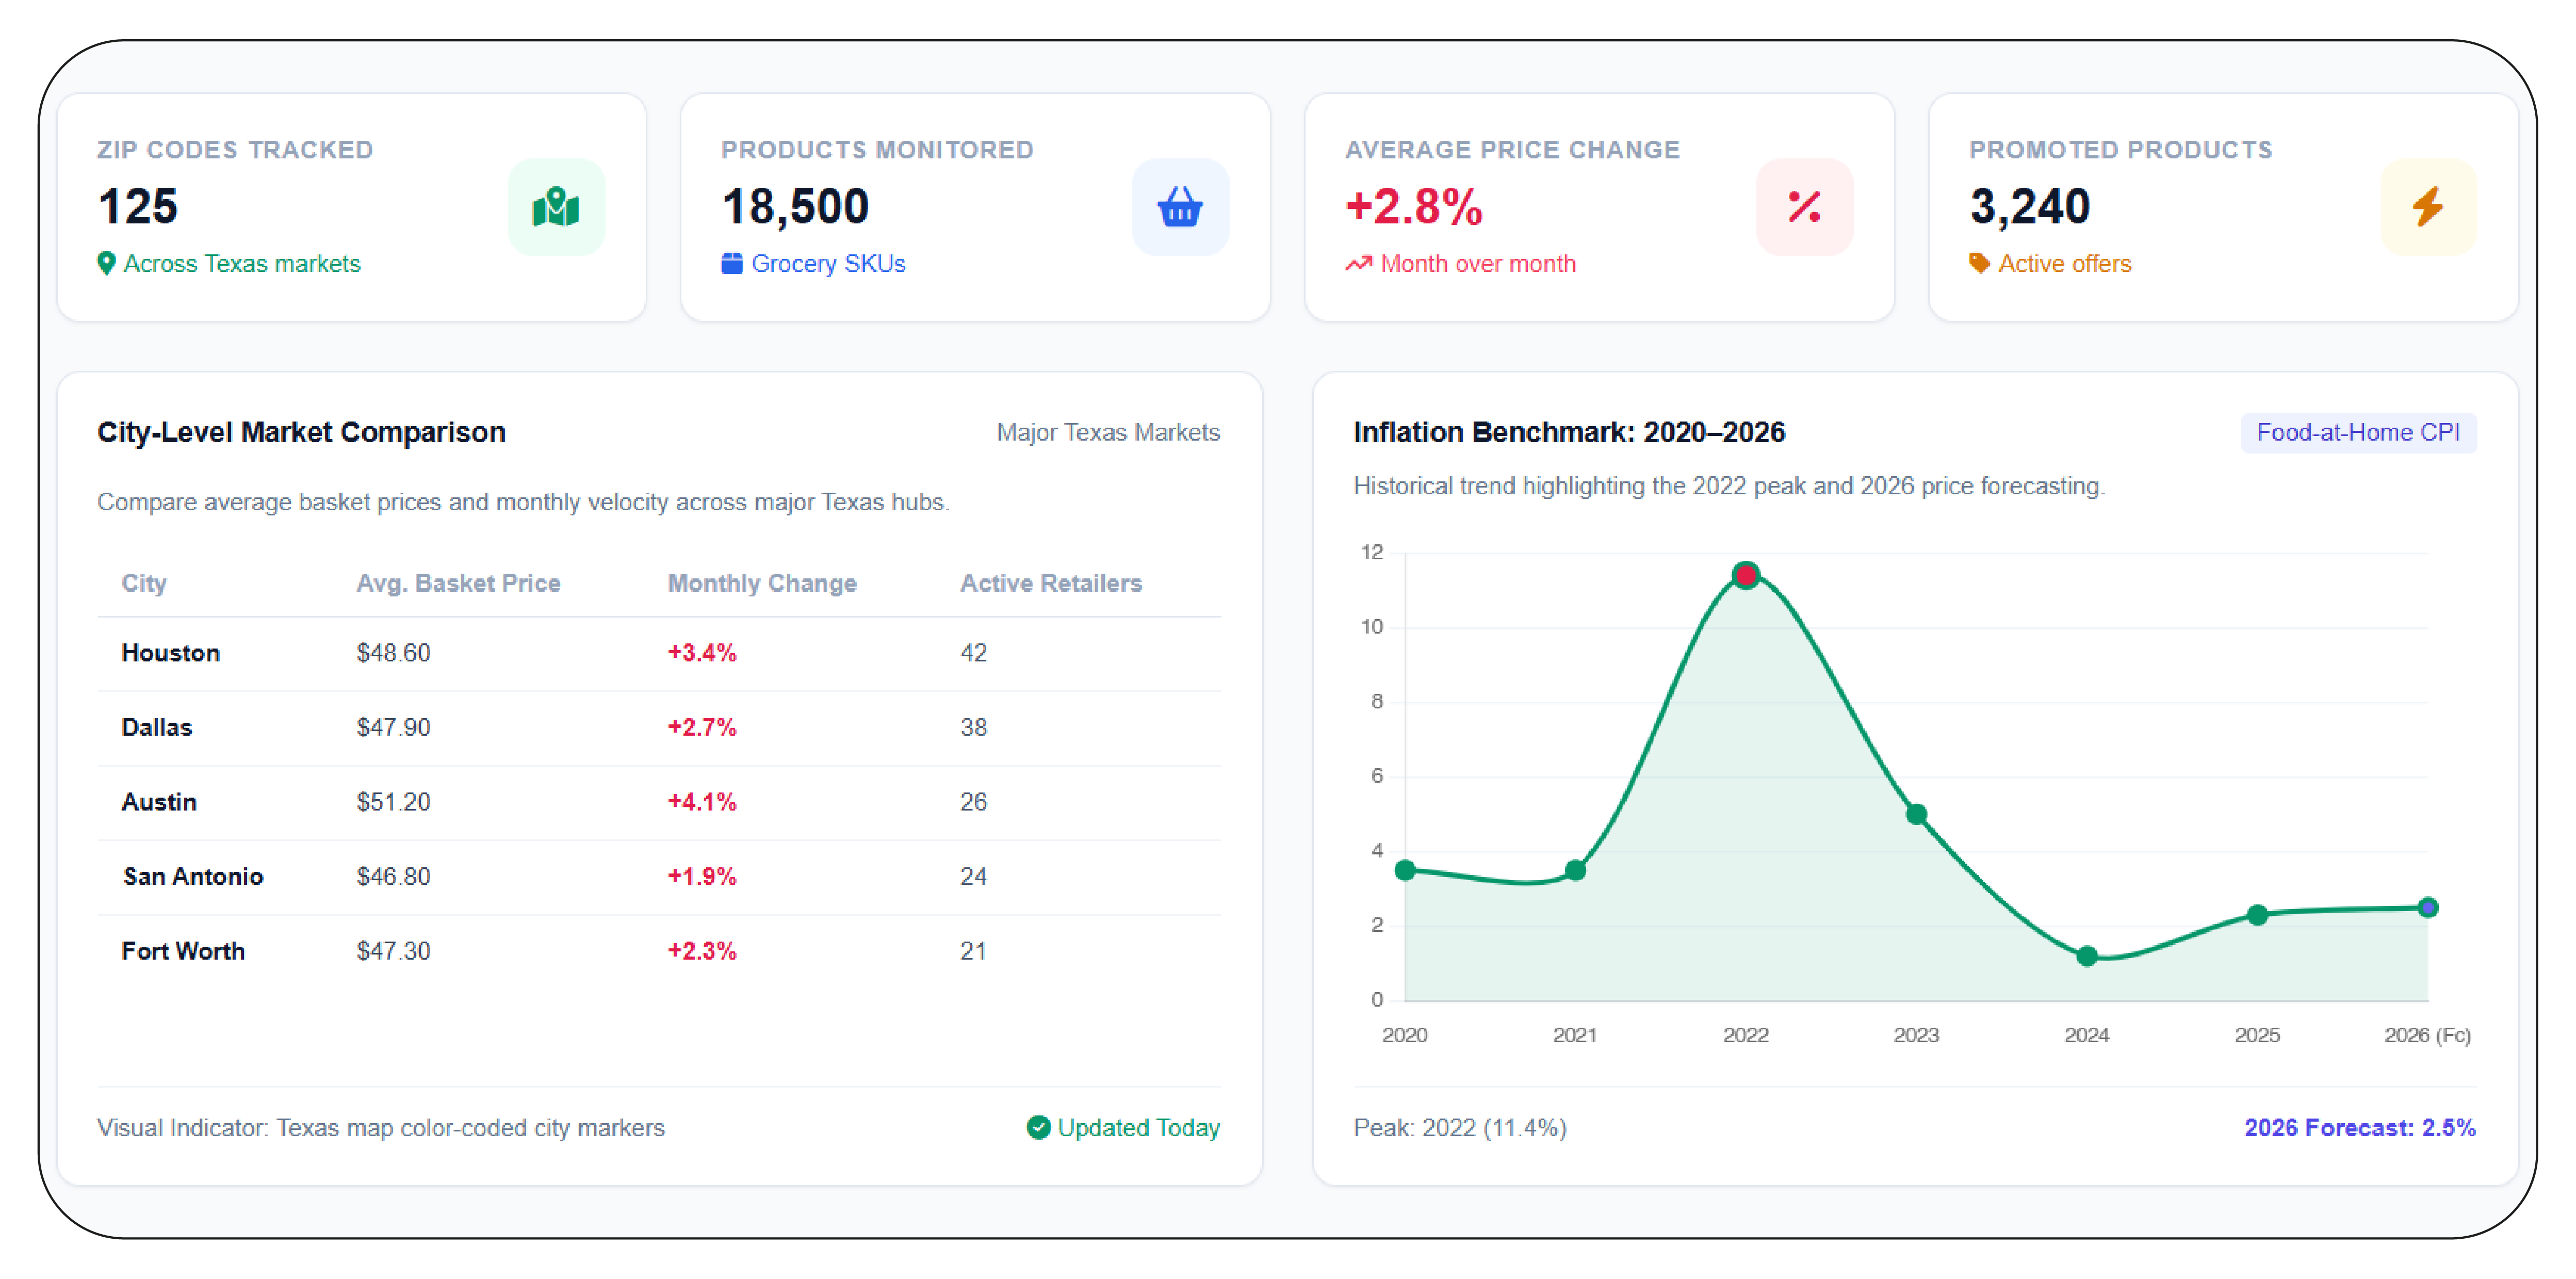
The first requirement for effective local pricing decisions is a consistent view of market conditions. Texas Grocery Market Intelligence can combine product-level prices, retailer information, category movements, promotional activity, availability, and geographic identifiers.
A statewide average can hide meaningful differences between markets. A retailer operating in Houston, Dallas, Austin, San Antonio, Fort Worth, or smaller Texas communities may face different competitive conditions. Local demand, store formats, competitor density, promotions, transportation costs, and assortment can all affect observed prices.
USDA's national data provides an important benchmark. Food-at-home prices rose 11.4% in 2022, followed by substantially slower growth in 2023 and 2024. By 2025, food-at-home inflation had returned to 2.3%. (Economic Research Service)
Reference inflation benchmark, 2020–2026
| Year |
U.S. Food-at-Home Price Change |
Data Status |
| 2020 |
3.5% |
Actual |
| 2021 |
3.5% |
Actual |
| 2022 |
11.4% |
Actual |
| 2023 |
5.0% |
Actual |
| 2024 |
1.2% |
Actual |
| 2025 |
2.3% |
Actual |
| 2026 |
2.5% |
USDA forecast |
Source: USDA ERS and BLS; 2026 is the August 2026 USDA forecast. (Bureau of Labor Statistics)
From 2020 to 2022, supply-chain disruption, changes in consumption patterns, energy costs, labor pressures, and commodity-market conditions contributed to rapid food-price growth. USDA notes that food-at-home prices increased 24% between January 2020 and January 2023. (Economic Research Service)
For retailers, the practical implication is clear: inflation should be analyzed as a product-and-location phenomenon rather than treated only as a national percentage. A ZIP-level dataset can reveal which markets are experiencing higher or lower movements than broader benchmarks.
Why Does ZIP-Level Monitoring Improve Grocery Pricing Decisions?
Grocery Price Tracking by ZIP Code gives pricing teams a geographic layer for understanding retail competition. Instead of looking only at a product's average price across Texas, analysts can examine the same SKU or GTIN across defined ZIP codes and retailer locations.
This enables businesses to identify price differences for products such as milk, eggs, bread, meat, beverages, fresh produce, packaged foods, household staples, and private-label items.
USDA's Food-at-Home Monthly Area Prices dataset demonstrates the value of geographic price measurement. It provides monthly prices across 90 food-at-home categories and 15 U.S. geographic areas, using mean unit values and price indexes. (Economic Research Service)
A commercial ZIP-level dataset can complement broader public benchmarks by collecting retailer-specific online shelf prices and location signals.
Analytical framework
| Data Point |
ZIP-Level Use |
Business Question |
| Product price |
Compare local prices |
Where is the item most expensive? |
| Discount |
Measure promotional intensity |
Which markets have stronger promotions? |
| Availability |
Detect stock differences |
Where is supply constrained? |
| Retailer |
Benchmark competitors |
Which retailers are pricing aggressively? |
| Brand |
Compare brand positioning |
Is price consistency maintained? |
| Product ID |
Track identical items |
How does the same SKU move across markets? |
From 2020 through 2022, rapid inflation made price comparisons particularly important. During 2023 and 2024, slower food-at-home inflation changed the analytical requirement: businesses increasingly needed to distinguish between broad inflation and individual product or competitor movements. In 2025, food-at-home prices increased 2.3%, while USDA's 2026 forecast is 2.5%. (Economic Research Service)
For a Texas grocery business, this means a statewide benchmark can establish context, but ZIP-level observations can explain local variation.
What Should a Retail Dataset Capture at Product Level?
A reliable Texas Grocery Product Price Dataset should contain more than product names and selling prices. For pricing intelligence, every observation needs enough context to determine what was sold, where it was sold, when it was observed, and under what conditions.
A structured dataset can include product title, brand, category, SKU, GTIN, pack size, unit quantity, regular price, promotional price, discount, availability, retailer, store or ZIP identifier, product URL, timestamp, and promotional messaging.
The need for product-level structure became particularly important during the inflationary period beginning in 2020. Grocery categories did not move uniformly. USDA reported that in 2024, egg prices increased 8.5%, beef and veal increased 5.4%, while fish and seafood declined 1.9% and dairy declined 0.2%. (Economic Research Service)
Category movement examples
| Period |
Food-at-Home Indicator |
Retail Interpretation |
| 2020 |
+3.5% |
Pandemic-era grocery demand shift |
| 2021 |
+3.5% |
Continued elevated household grocery demand |
| 2022 |
+11.4% |
Major inflationary acceleration |
| 2023 |
+5.0% |
Inflation begins moderating |
| 2024 |
+1.2% |
Broad price growth slows |
| 2025 |
+2.3% |
Moderate inflation returns |
| 2026 |
+2.5% forecast |
Continued but slower growth |
National food-at-home benchmark; not a Texas ZIP-level measurement. (Bureau of Labor Statistics)
A well-structured dataset also makes historical comparisons easier. Retailers can calculate minimum, maximum, median, average, percentage change, promotion frequency, price dispersion, and competitor price gaps.
For example, if the same branded cereal is priced at different levels across multiple ZIP codes, analysts can determine whether the difference is persistent, promotional, retailer-specific, or temporary.
This transforms raw grocery listings into an analytical resource for pricing, merchandising, category management, procurement, and market research.
How Can Businesses Identify Price Trends Across Local Markets?
Grocery Price Trend Analysis by ZIP Code allows businesses to move from simple price collection toward time-series intelligence. The objective is not merely to know today's price. It is to understand how prices behave over weeks, months, seasons, promotions, and competitive events.
The 2020–2026 period demonstrates why longitudinal analysis matters. Food-at-home inflation was 3.5% in 2020 and 2021 before jumping to 11.4% in 2022. It then declined to 5.0% in 2023 and 1.2% in 2024 before rising to 2.3% in 2025. USDA's August 2026 forecast places 2026 food-at-home inflation at 2.5%. (Bureau of Labor Statistics)
Six-year-plus trend context
| Year |
Food-at-Home Change |
Analytical Focus |
| 2020 |
3.5% |
Establish baseline |
| 2021 |
3.5% |
Monitor emerging volatility |
| 2022 |
11.4% |
Detect major price acceleration |
| 2023 |
5.0% |
Measure normalization |
| 2024 |
1.2% |
Identify category divergence |
| 2025 |
2.3% |
Track renewed price pressure |
| 2026 |
2.5% forecast |
Monitor current direction |
The same framework can be applied at ZIP level by calculating:
- Month-over-month price change
- Year-over-year price change
- Average competitor price
- Median local price
- Price dispersion
- Promotional frequency
- Price index by category
- SKU-level volatility
- Retailer price gaps
For 2026, category-level monitoring is especially relevant. USDA forecasts beef and veal prices to rise 9.8%, fresh vegetables 5.9%, sugar and sweets 7.1%, and nonalcoholic beverages 4.3%. (Economic Research Service)
These national forecasts do not establish what will happen in every Texas ZIP code. Instead, they provide benchmarks against which localized observations can be evaluated.
A retailer could therefore flag ZIP codes where observed prices are rising materially faster than the relevant benchmark or where competitors are discounting more aggressively.
How Can Businesses Build a Local Grocery Price Index?
A local index can convert thousands of product observations into a simple metric that pricing teams can monitor over time. Scrape Grocery Price Index by ZIP Code can be designed around a fixed basket of comparable products.
For example, a retailer could select a representative basket containing milk, eggs, bread, cereal, rice, chicken, beef, vegetables, fruit, beverages, and packaged grocery products. Each product can receive a consistent identifier and be tracked across selected ZIP codes.
USDA's Food-at-Home Monthly Area Prices already illustrates the broader principle of using average unit values and price indexes to measure changes over time and geography. (Economic Research Service)
Example index structure
| Component |
Example Measurement |
| Basket size |
100 comparable products |
| Geographic unit |
ZIP code |
| Frequency |
Daily, weekly, or monthly |
| Base period |
Selected 2026 baseline |
| Price metric |
Average comparable price |
| Benchmark |
Retailer, market, or category |
| Output |
ZIP-level price index |
The index could use a selected base period of 100. If a basket moves from an index value of 100 to 104, the monitored basket has increased approximately 4% relative to its base, subject to the index methodology.
The historical context is important. Between January 2020 and January 2023, U.S. food-at-home prices increased 24%, demonstrating how rapidly grocery baskets can change during a major inflationary cycle. (Economic Research Service)
By 2024, food-at-home inflation had slowed to 1.2%, while 2025 recorded 2.3%. (Economic Research Service)
In 2026, the USDA forecast is 2.5%, but category-level differences remain substantial. (Economic Research Service)
A ZIP-level index therefore becomes useful for identifying whether local grocery baskets are moving in line with broad market conditions or displaying different patterns.
How Do Digital Shelf Signals Support Competitive Decisions?
Digital Shelf Analytics connects pricing information with product visibility, assortment, promotions, availability, and retailer execution. For grocery brands, this can reveal whether products are consistently listed, competitively priced, and available across targeted markets.
Retailers and CPG companies can combine Competitive pricing data with product availability, promotional labels, pack-size information, seller details, and historical observations.
USDA reported that grocery stores accounted for 56.2% of U.S. food-at-home sales in 2025, while warehouse clubs and supercenters accounted for 26.4%. (Economic Research Service) This highlights the importance of monitoring multiple retail formats when analyzing grocery competition.
2020–2026 strategic context
| Year |
Market Context |
Data Priority |
| 2020 |
Pandemic-driven demand shifts |
Availability + price |
| 2021 |
Continuing supply pressures |
SKU monitoring |
| 2022 |
11.4% grocery inflation |
Price volatility |
| 2023 |
5.0% grocery inflation |
Competitor benchmarking |
| 2024 |
1.2% grocery inflation |
Category-level differences |
| 2025 |
2.3% grocery inflation |
Promotion and assortment |
| 2026 |
2.5% forecast |
Localized competitive intelligence |
The 2026 environment is particularly suitable for combining price and digital-shelf observations. USDA reports that July 2026 food-at-home prices were 2.7% above July 2025, while beef and veal were 9.4% higher year over year and fresh vegetables were 6.3% higher. (Economic Research Service)
A retailer can use these signals to investigate whether price changes are broad market movements or specific to particular competitors, categories, or locations.
The most actionable output is often an exception list: products with unusual price increases, large competitor gaps, repeated stockouts, disappearing promotions, or significant changes in local availability.
Why Choose Product Data Scrape?
Product Data Scrape can support a structured grocery intelligence workflow covering collection, normalization, validation, matching, and delivery. The objective is to turn fragmented online grocery information into datasets that pricing, merchandising, category, and analytics teams can use.
A robust workflow can capture product attributes, prices, promotions, availability, retailer information, location signals, and timestamps. Data can then be normalized into consistent fields and checked for duplicates, missing values, inconsistent units, and product-matching errors.
The approach can support recurring monitoring rather than one-time collection. Businesses can define target retailers, categories, products, ZIP codes, and collection frequencies according to their analytical requirements.
This is especially useful when teams need historical comparisons. A consistent data model allows current observations to be compared against previous periods without rebuilding the dataset from scratch.
Key capabilities
- Product and price collection
- ZIP-level geographic organization
- SKU and GTIN matching
- Promotion monitoring
- Historical price tracking
- Competitor benchmarking
- Availability monitoring
- Structured data delivery
- Recurring data collection
- Analytics-ready datasets
What Makes Product Identification Critical for Grocery Monitoring?
Barcode and GTIN Matching for Grocery Data helps ensure that pricing comparisons are made between genuinely comparable products.
A product title alone may not be sufficient because similar products can differ by brand, pack size, flavor, formulation, quantity, or packaging. Matching identifiers can reduce false comparisons and improve historical tracking.
For example, a 12-pack beverage should not automatically be compared with a single bottle simply because their product titles contain similar words. Likewise, private-label products should be separated from branded products unless the analysis specifically concerns substitute-product pricing.
A structured matching layer can include:
- GTIN or barcode
- SKU
- Brand
- Product name
- Category
- Pack size
- Unit quantity
- Retailer
- ZIP code
- Timestamp
This structure supports better price-per-unit calculations and more reliable competitor comparisons.
It also improves longitudinal analysis. If a retailer changes a product title or reorganizes its category structure, a persistent product identifier can help maintain continuity.
How Does Grocery Data Collection Turn Into Actionable Intelligence?
Grocery data scraping becomes valuable when the collected information is transformed into consistent, validated, and decision-ready datasets.
For retailers, the workflow can begin with a defined list of ZIP codes, stores, categories, brands, SKUs, and competing retailers. Data is then collected at a selected frequency and standardized into common fields.
The next stage is validation. Duplicate products, missing prices, invalid availability statuses, inconsistent units, and product-matching issues should be identified before analytics.
The final stage is analysis. Businesses can calculate price changes, competitor gaps, promotional intensity, category indexes, price dispersion, and availability rates.
The 2020–2026 period shows why this process matters. Grocery inflation moved from moderate growth in 2020 and 2021 to a sharp 11.4% increase in 2022, followed by a gradual slowdown. (Bureau of Labor Statistics)
At the same time, individual categories can behave very differently. In 2026, USDA forecasts beef and veal prices to rise 9.8%, fresh vegetables 5.9%, and sugar and sweets 7.1%, while eggs and fats and oils are forecast to decline. (Economic Research Service)
That divergence creates opportunities for category-specific and ZIP-specific monitoring rather than relying on a single grocery inflation figure.
Why Is Local Price Visibility Becoming More Important?
Texas retailers operate across a large and diverse geographic market. A centralized pricing strategy can benefit from local validation because competitive intensity, assortment, promotions, and consumer behavior can differ between markets.
A ZIP-level approach enables businesses to build market-specific dashboards and alerts.
Potential alerts
| Alert |
Example Trigger |
| Price increase |
SKU rises above defined threshold |
| Competitor gap |
Competitor becomes materially cheaper |
| Promotion change |
Discount appears or disappears |
| Availability issue |
Product becomes unavailable |
| Assortment change |
SKU disappears from a location |
| Category movement |
Basket index changes significantly |
The historical benchmark reinforces the value of continuous monitoring. USDA's 2026 forecast puts food-at-home inflation at 2.5%, but category forecasts range considerably, with beef and veal at 9.8% and fresh vegetables at 5.9%. (Economic Research Service)
This means retailers need to ask more specific questions than "Are grocery prices increasing?"
The useful questions are:
- Which categories are changing?
- Which products are responsible?
- Which ZIP codes are most affected?
- Which competitors are changing prices?
- Are increases temporary or persistent?
- Are promotions offsetting higher shelf prices?
- Is the same product priced differently across locations?
Answering these questions consistently requires granular, historical, and geographically structured data.
Why Choose a ZIP-Level Grocery Monitoring Strategy?
A ZIP-level monitoring strategy gives retailers a practical bridge between broad economic indicators and store-level commercial decisions.
National inflation statistics establish context. Retailer-specific observations reveal competitive behavior. ZIP-level data connects the two.
The combination can help pricing teams identify market anomalies, category trends, promotional changes, and local price gaps without relying exclusively on averages.
For Texas grocery businesses, the most useful architecture is therefore a layered one:
National benchmark → Texas market view → ZIP-level prices → Product-level records → Competitor comparison → Historical trend → Actionable alert
This structure supports pricing, merchandising, assortment planning, category management, and competitive intelligence.
Conclusion
The value of Texas grocery price Monitoring data zip level 2026 lies in its ability to convert broad inflation signals into localized commercial intelligence. National food-at-home prices rose sharply during 2022 and have since moderated, but category-level movements remain uneven. (Economic Research Service)
For retailers and grocery brands, ZIP-level monitoring can reveal where products are becoming more expensive, where competitors are changing prices, and which categories require closer attention. Consistent product identifiers, timestamps, retailer information, promotions, and availability signals make the resulting dataset more useful for historical analysis.
A structured local pricing program can help businesses move from reactive price checks toward continuous market visibility.
Ready to build a scalable grocery pricing intelligence workflow? Partner with Product Data Scrape to collect, structure, and monitor localized grocery price data for actionable retail insights!
FAQs
1. What is Texas grocery price Monitoring data zip level 2026?
It is ZIP-level grocery pricing information collected across Texas markets, enabling retailers to compare products, competitors, promotions, availability, and price movements by location.
2. How does Grocery Inflation Tracking Data help retailers?
Grocery Inflation Tracking Data helps businesses distinguish broad inflation from product-level changes, supporting pricing reviews, category planning, competitor monitoring, and localized market analysis.
3. Why is Texas Grocery Market Intelligence important?
Texas Grocery Market Intelligence combines pricing, product, retailer, promotion, and location signals to help businesses understand competitive conditions across different Texas grocery markets.
4. What is Grocery Price Tracking by ZIP Code?
Grocery Price Tracking by ZIP Code organizes product prices according to geographic areas, allowing businesses to compare local prices and identify differences between retailers and markets.
5. How can Product Data Scrape support grocery monitoring?
Product Data Scrape can help collect and structure grocery product information, prices, promotions, availability, identifiers, retailer details, and geographic signals for recurring analysis.


 Singapore
 EMAIL
EMAIL
 PHONE
PHONE


.webp "thumb")













.webp)






