Introduction
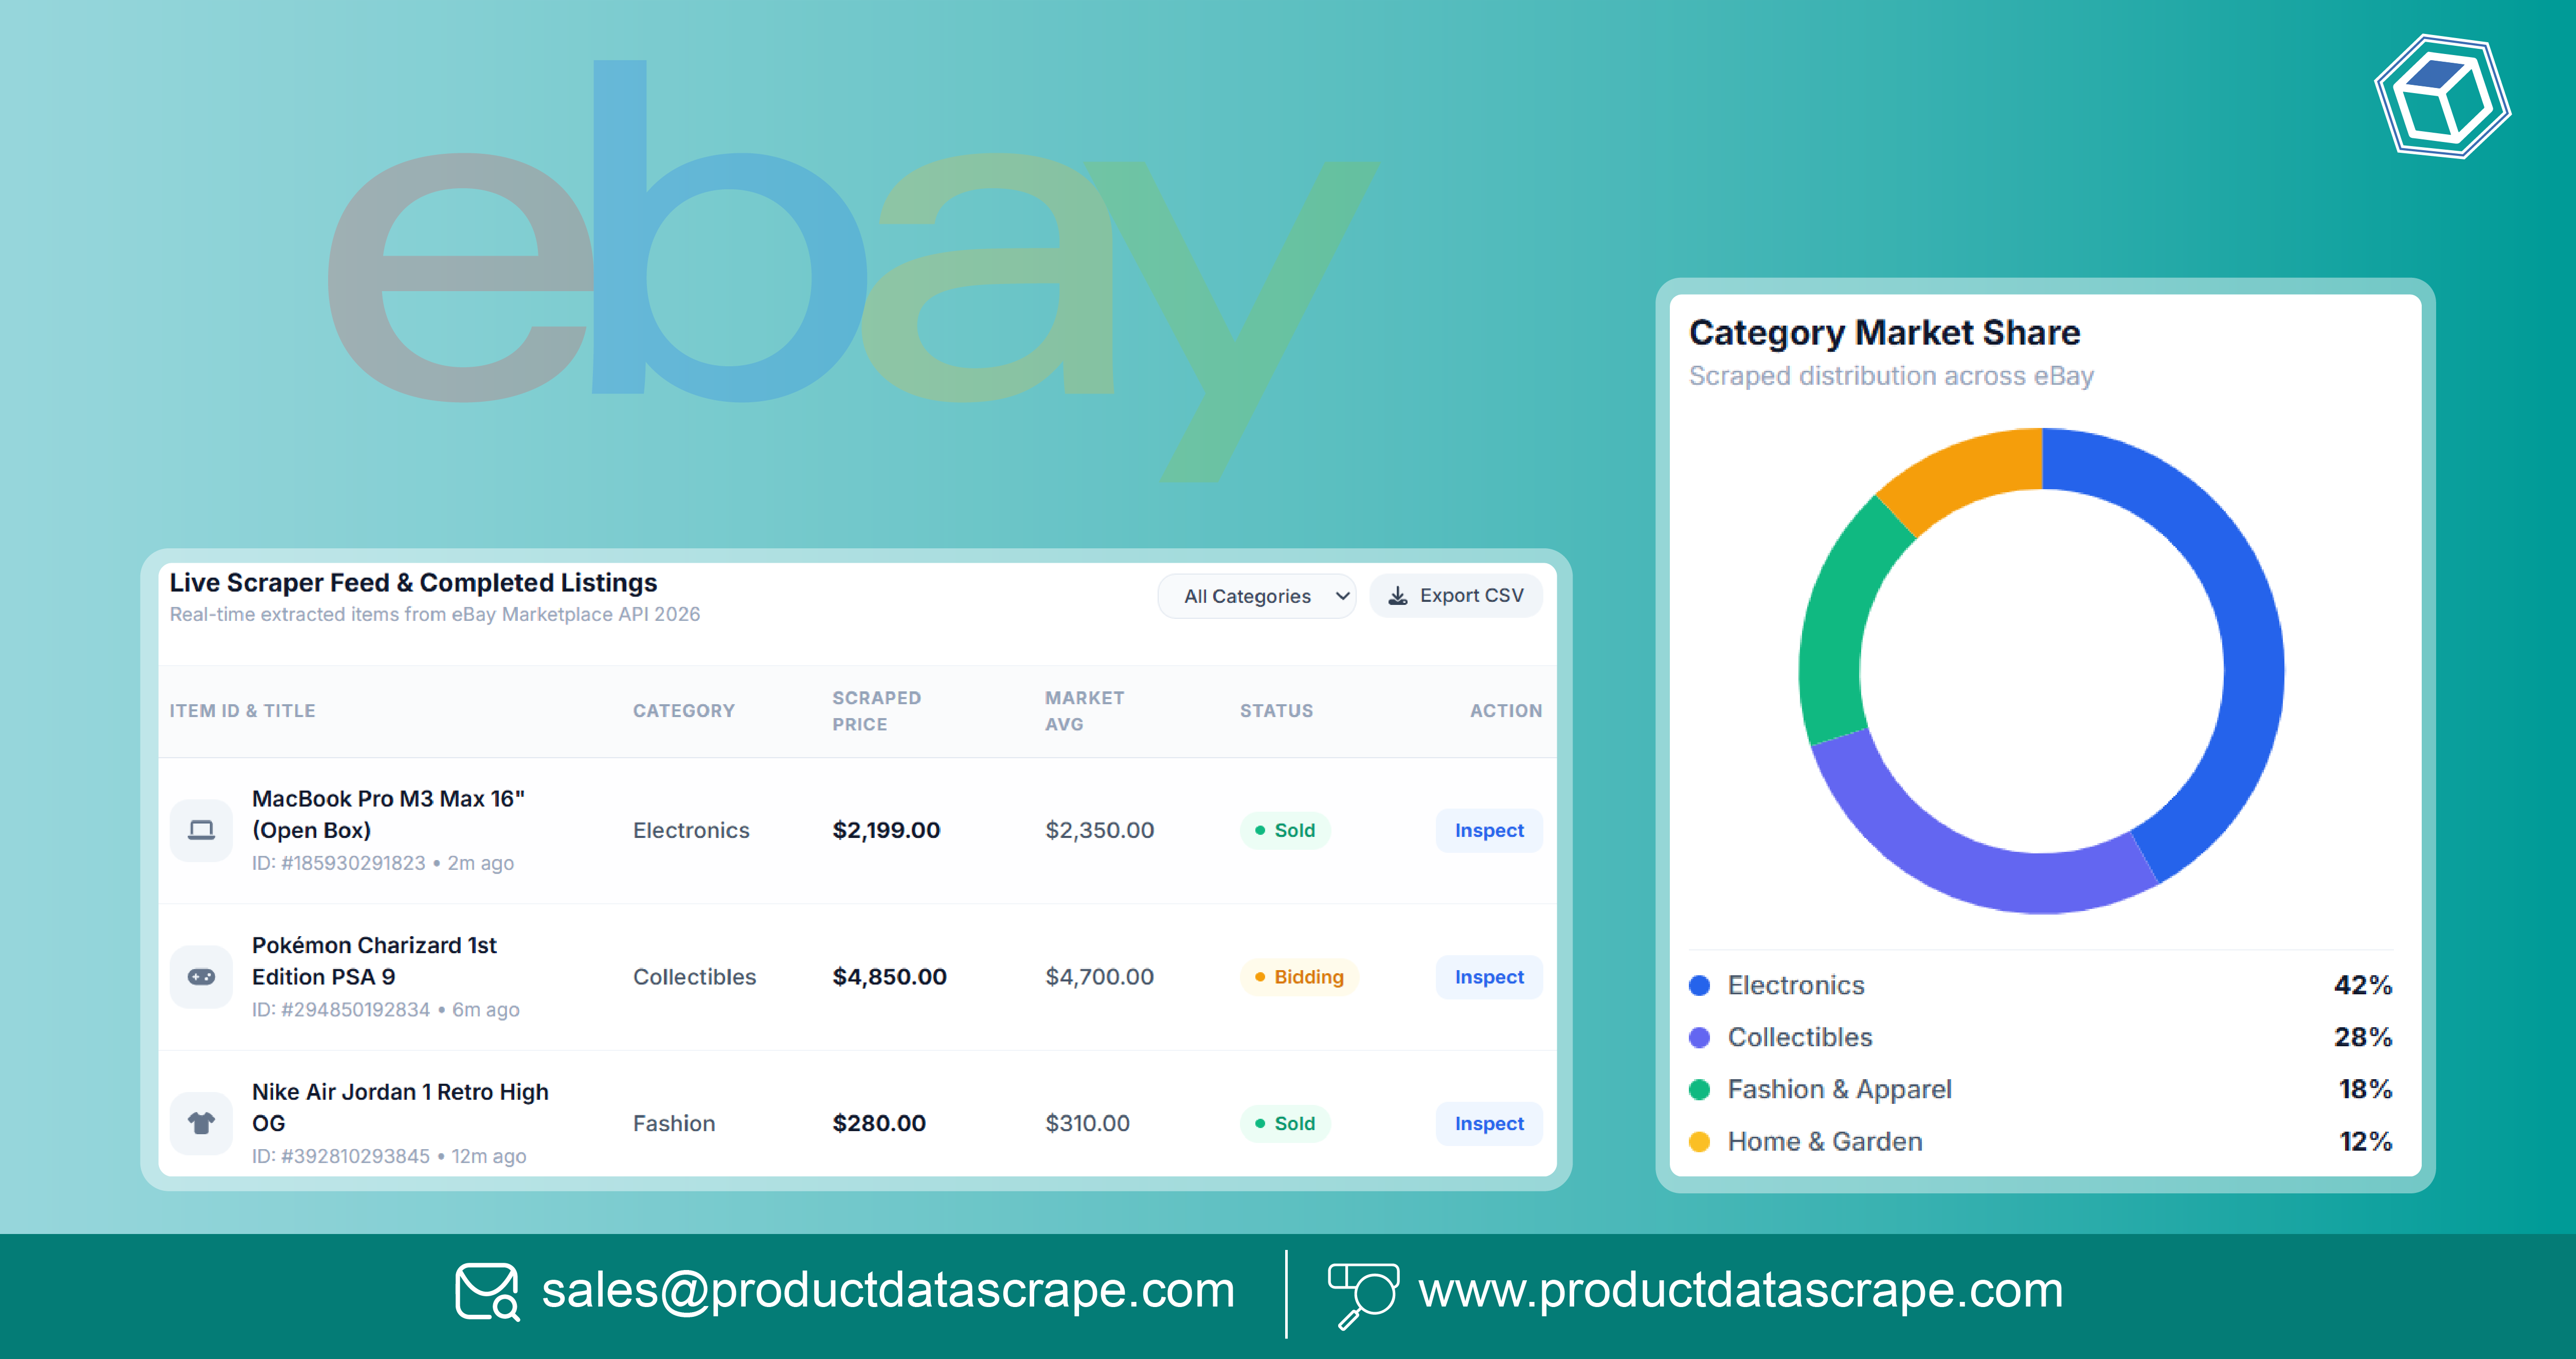
eBay Sales Data Scraper API 2026 can help brands, retailers, sellers, analysts, and marketplace teams convert frequently changing product, pricing, seller, and sales signals into structured data for faster commercial decisions. Instead of manually checking thousands of listings, businesses can build recurring data pipelines that organize marketplace information for pricing analysis, product monitoring, competitive research, and sales intelligence.
The eBay marketplace contains a broad range of products, sellers, categories, prices, offers, shipping information, ratings, and listing attributes. For businesses operating in the United States, monitoring these signals can help answer practical questions:
- Which products are appearing at competitive prices?
- How are seller prices changing?
- Which categories are gaining or losing product visibility?
- Which listings have changed?
- How does a product compare with competing offers?
- Which sellers are gaining marketplace visibility?
- Which product attributes are missing from existing catalogs?
A structured eBay E-commerce Product Dataset can bring these data points together in a consistent format.
The core value is not simply collecting more marketplace records. It is creating timely, normalized, validated, and reusable data that sales, pricing, merchandising, and strategy teams can actually use.
How Can Better Marketplace Data Improve Product Visibility?
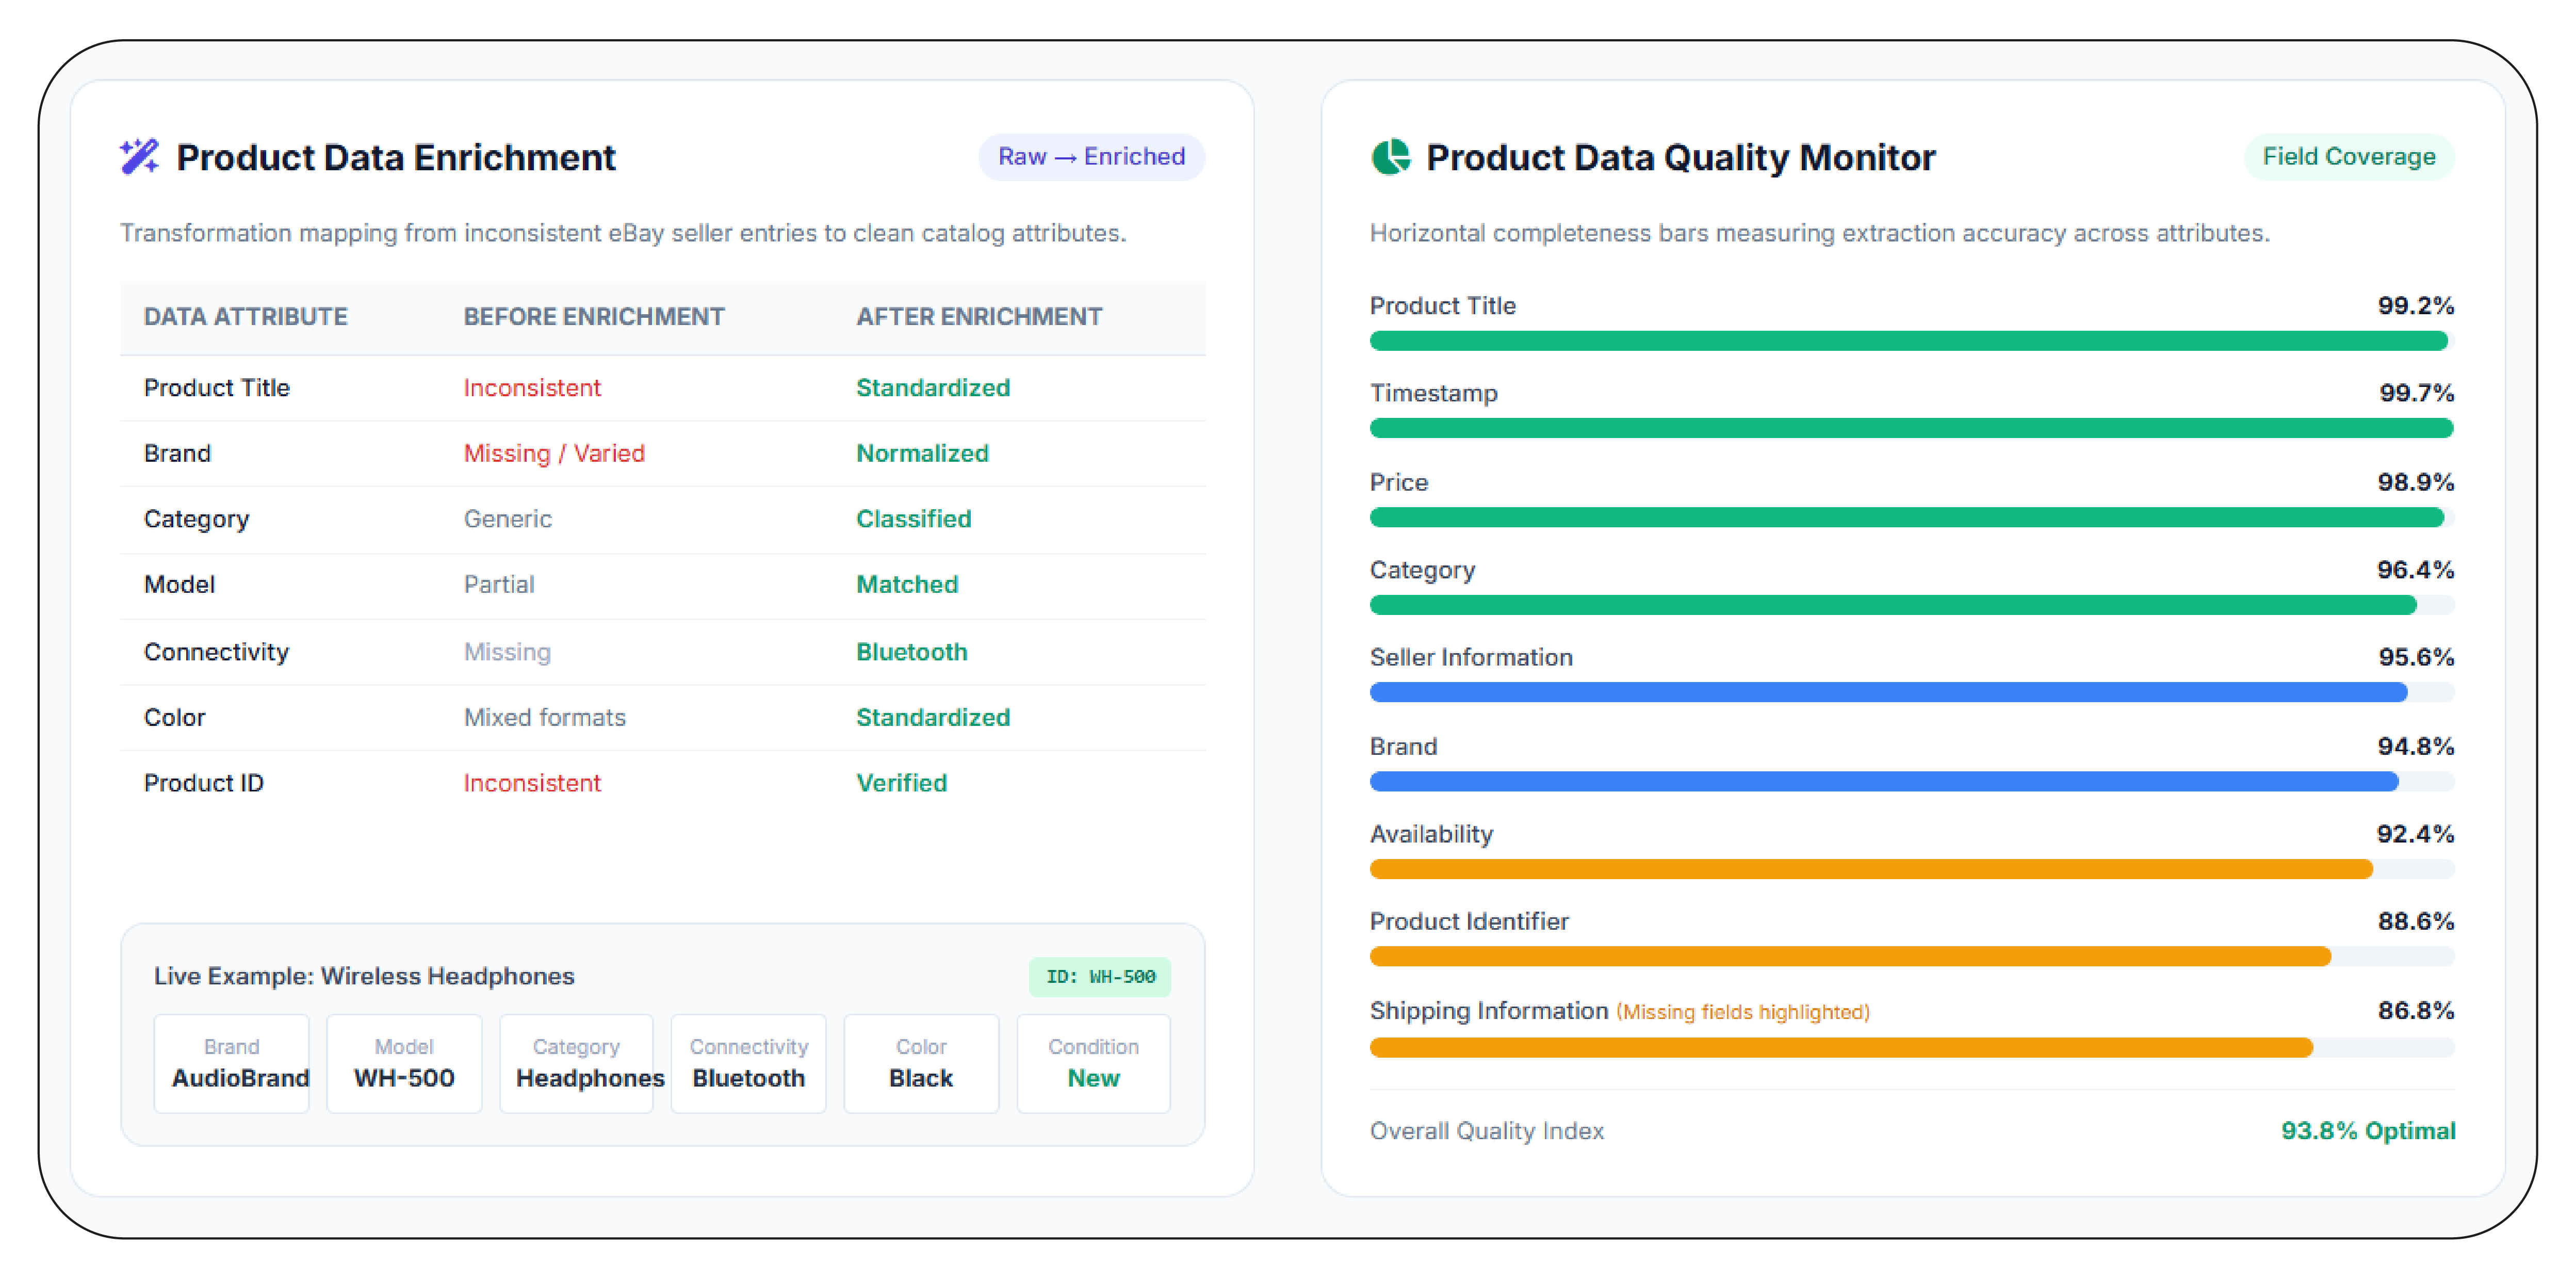
Businesses need a consistent product-data foundation before they can perform reliable sales, pricing, or competitor analysis. eBay's Marketplace Insights API can be incorporated into a broader marketplace-data workflow where applicable, while Catalog Enrichment Services can help enhance incomplete product records with standardized attributes.
For an e-commerce business, product data can come in different formats and levels of completeness. One listing may contain detailed specifications, while another may provide only basic information. This creates difficulties when organizations attempt to compare products programmatically.
A structured data model can standardize important fields such as product title, brand, category, price, condition, seller, availability, shipping information, ratings, product identifiers, and timestamps.
Structured Data Model
| Data Layer |
Example Fields |
Business Application |
| Product identity |
SKU, product ID, title |
Product matching |
| Classification |
Category, subcategory, brand |
Catalog organization |
| Commercial |
Price, discount, offer |
Pricing analysis |
| Seller |
Seller name, rating |
Seller intelligence |
| Availability |
Stock/listing status |
Product monitoring |
| Logistics |
Shipping information |
Offer comparison |
| Time |
Collection timestamp |
Historical analysis |
Product enrichment makes marketplace information easier to search, compare, and analyze. For example, two listings for the same type of wireless headphones may use different titles and attribute structures. Normalization can identify common attributes such as brand, model, connectivity, color, and price.
For marketplace sellers, enriched data can support competitor benchmarking. For retailers, it can improve assortment analysis. For data teams, standardized records reduce the complexity of downstream analytics.
From 2020 to 2022, e-commerce businesses increasingly needed structured product data as digital marketplace activity expanded. Basic monitoring often focused on price, product availability, seller information, and listing changes.
During 2023 and 2024, organizations began demanding more detailed product attributes and better historical visibility. Rather than maintaining isolated spreadsheets, teams increasingly moved toward automated pipelines and centralized datasets.
In 2025 and 2026, the emphasis has increasingly shifted toward making product information usable across analytics, AI, catalog management, pricing, and competitive intelligence workflows. Businesses can combine marketplace observations with their own product catalogs to identify matching SKUs and gaps.
Illustrative benchmark: If a company monitors 20,000 listings and captures 15 standardized fields per listing, one collection cycle can generate up to 300,000 core field values before variants, historical records, or seller-level observations are added.
What Can Businesses Learn From the U.S. Marketplace?
eBay US Marketplace Intelligence Data gives businesses a structured foundation for understanding product availability, pricing patterns, seller activity, category movements, and marketplace competition in the U.S. market.
U.S. marketplace analysis becomes more useful when businesses can compare the same product or category over time. A single snapshot may show the current price, but recurring observations can reveal whether prices are stable, increasing, decreasing, or frequently changing.
| Intelligence Area |
Example Metric |
Business Question |
| Product |
Listing count |
How broad is the assortment? |
| Price |
Median selling price |
What is the market price range? |
| Seller |
Seller count |
How competitive is the category? |
| Availability |
Active listings |
Which products remain visible? |
| Discount |
Discount frequency |
How promotional is the category? |
| Rating |
Seller/product rating |
How is marketplace quality represented? |
| Category |
Product distribution |
Which categories have greater visibility? |
How can U.S. intelligence support decision-making?
A brand entering eBay can use marketplace data to understand existing product positioning before launching a new SKU. A retailer can compare its own pricing against observed marketplace offers. A market researcher can examine category composition and seller participation.
Historical datasets are particularly valuable because they allow teams to distinguish short-term changes from persistent patterns.
For example, if the same product is observed at several price points over multiple collection cycles, analysts can calculate price movement and identify periods of promotional activity.
2020–2026: The increasing value of U.S. marketplace visibility
Between 2020 and 2022, businesses increasingly recognized that marketplace presence could influence online product discovery and competitive positioning. Basic data collection typically focused on product and price information.
In 2023 and 2024, more businesses began combining marketplace data with internal product catalogs and competitive intelligence systems. This allowed teams to move from simple observation toward structured comparison.
By 2025 and 2026, marketplace intelligence is increasingly connected with pricing, assortment, seller monitoring, product research, and digital shelf workflows. The data can also support machine-learning and AI applications when properly normalized.
Illustrative benchmark: Suppose 5,000 U.S. products are monitored once daily for 30 days. That produces approximately 150,000 timestamped product observations. If each observation contains 20 fields, the resulting dataset can contain millions of individual data values.
How Can Sales Analytics Reveal Changes in Marketplace Performance?
Scrape eBay US Sales Analytics Data to create structured observations that support product performance analysis, pricing research, seller monitoring, and category-level intelligence. Digital Shelf Analytics can then use these observations to understand how products are positioned and presented in a competitive online environment.
The objective is to identify patterns rather than merely collect individual records.
For example, a business can compare:
- Product price movements
- Listing frequency
- Seller participation
- Product availability
- Discount activity
- Ratings
- Category presence
- Product attributes
- Listing changes
| Analysis |
Input Data |
Possible Insight |
| Price trend |
Timestamp + price |
Price movement |
| Seller analysis |
Seller + listing data |
Competitive structure |
| Product tracking |
Product ID + status |
Listing lifecycle |
| Category analysis |
Category + listings |
Assortment changes |
| Promotion analysis |
Price + discount |
Promotional activity |
| Digital shelf |
Listing + attributes |
Product visibility |
Why is historical sales-related data valuable?
Historical records allow businesses to compare current observations with earlier snapshots. This is especially useful for identifying recurring pricing patterns or changes in marketplace participation.
A seller may want to understand whether competitor pricing changes are isolated or part of a longer-term pattern. A brand may want to see whether its product assortment remains competitive.
Data can also help identify gaps in digital shelf presentation. Missing images, incomplete specifications, inconsistent titles, or absent attributes can affect how products are evaluated by shoppers and downstream systems.
2020–2026: From marketplace reporting to continuous analytics
In 2020–2022, e-commerce analytics often relied on periodic reports and manually collected marketplace information. These approaches could work for small product sets but became difficult as catalogs expanded.
From 2023 onward, businesses increasingly adopted automated data pipelines for repeated marketplace observations. This created stronger historical datasets for pricing and competitive analysis.
By 2024–2026, digital shelf analytics increasingly connects product visibility with pricing, assortment, availability, seller activity, and content quality. Instead of evaluating a product page in isolation, businesses can analyze its position within the wider marketplace.
Benchmark: A monitoring workflow covering 10,000 products with four observations per day creates up to 40,000 observations daily, or approximately 1.2 million observations over 30 days before data-quality filtering.
How Can Automated Price Monitoring Strengthen Competitive Analysis?
eBay US Sales Price scraper API can help businesses automate the collection of relevant pricing observations and build historical records for comparison.
Pricing teams often need answers faster than traditional market research can provide. They may need to know whether competitors have changed prices, whether discounts are appearing more frequently, or whether specific products are moving outside an expected price range.
| Pricing Signal |
Analysis |
| Current price |
Competitive price comparison |
| Previous price |
Price movement |
| MRP/list price |
Discount calculation |
| Offer price |
Promotion monitoring |
| Seller price |
Seller-level benchmarking |
| Timestamp |
Change detection |
| Product condition |
Apples-to-apples comparison |
What pricing problems can automated data address?
Manual price tracking becomes increasingly difficult as the number of products and sellers grows. Human teams may check a sample of products but miss changes occurring between scheduled reviews.
Automated collection creates consistent observation points. Analysts can then calculate:
Price Change % = ((Current Price − Previous Price) / Previous Price) × 100
This simple metric can be applied across products, sellers, categories, or periods.
Businesses should also account for product condition, shipping charges, bundle sizes, and variants before making direct price comparisons. A low displayed price does not necessarily represent a lower total purchase cost.
2020–2026: The shift toward dynamic pricing intelligence
Between 2020 and 2022, competitive pricing analysis often relied on periodic marketplace audits. As online sellers increased their use of dynamic commercial strategies, more frequent observations became useful.
From 2023 to 2024, automated price monitoring became increasingly relevant for large catalogs. Businesses could track hundreds or thousands of products without relying entirely on manual checks.
In 2025 and 2026, pricing intelligence increasingly integrates historical observations with dashboards, alerts, business rules, and analytics workflows.
Benchmark: If 8,000 products are checked twice daily, the system can create up to 16,000 pricing observations per day. Over 30 days, this represents approximately 480,000 observations, allowing businesses to build a meaningful historical price series.
How Can a 2026 Sales Intelligence Report Support Strategic Planning?
eBay US 2026 Sales Intelligence Report can organize marketplace observations into a structured view of products, pricing, sellers, categories, and competitive movements.
A useful report should not simply provide large quantities of data. It should translate observations into understandable metrics.
Potential report sections can include:
- Product and category overview
- Pricing distribution
- Seller landscape
- Product availability
- Listing changes
- Discount activity
- Category-level movements
- Product attribute coverage
- Historical price changes
- Competitive observations
| KPI |
Example Measurement |
| Average price |
Mean observed selling price |
| Median price |
Midpoint of price distribution |
| Price variance |
Difference across observations |
| Listing count |
Number of monitored listings |
| Seller count |
Distinct observed sellers |
| Availability rate |
Available observations / total observations |
| Discount rate |
Discounted listings / total listings |
| Data completeness |
Populated fields / expected fields |
How should businesses interpret these metrics?
The right KPI depends on the business objective. A pricing team may prioritize median price and price variance. A category manager may focus on listing counts and assortment changes. A marketplace strategy team may examine seller participation.
A report can also segment results by category, brand, product type, price band, seller, or condition.
2020–2026: How marketplace reporting matured
From 2020 to 2022, marketplace reports commonly concentrated on basic product and price snapshots. As e-commerce data volumes increased, businesses needed better historical comparisons.
In 2023 and 2024, reporting increasingly incorporated seller, category, availability, and product-content metrics. This gave businesses a broader view of marketplace performance.
By 2025–2026, organizations can use structured marketplace datasets as inputs for dashboards, BI systems, AI models, and strategic planning. The report itself becomes one layer of a larger data workflow.
Benchmark: A monthly report covering 50,000 products across 12 KPIs can represent up to 600,000 KPI-level observations before segmentation by seller, category, location, or time period.
How Can U.S. Data Collection Scale Across Large E-Commerce Catalogs?
E-Commerce Data Scraping United States can help businesses collect and organize product information from U.S.-focused e-commerce environments for competitive intelligence, catalog research, pricing analysis, and marketplace monitoring, subject to applicable platform rules and data-access requirements.
Large-scale data projects require more than extraction. They need an architecture that maintains consistency from collection through delivery.
What should a scalable workflow include?
| Stage |
Key Activity |
| Scope definition |
Select categories, products, sellers, and fields |
| Collection |
Capture permitted marketplace information |
| Parsing |
Extract required attributes |
| Normalization |
Standardize names, prices, units |
| Validation |
Detect missing or inconsistent records |
| Matching |
Connect equivalent products |
| Storage |
Preserve historical observations |
| Delivery |
Provide structured datasets |
| Monitoring |
Track pipeline quality |
What makes data quality important?
A large dataset can still be unreliable if product identifiers are duplicated, prices are incorrectly parsed, or product variants are mixed together.
Data-quality controls should therefore measure:
- Duplicate records
- Missing attributes
- Invalid prices
- Product matching accuracy
- Timestamp consistency
- Category consistency
- Availability accuracy
- Schema changes
2020–2026: Scaling from datasets to data infrastructure
Between 2020 and 2022, many businesses began with relatively focused e-commerce datasets covering limited categories or products. As digital catalogs expanded, collection requirements became more complex.
During 2023 and 2024, businesses increasingly required automated workflows that could handle recurring extraction, normalization, and historical storage. The challenge shifted from "Can we collect the data?" to "Can we maintain a reliable data pipeline?"
By 2025 and 2026, scalable e-commerce intelligence increasingly involves integrating multiple datasets into business intelligence and AI workflows. Businesses may combine marketplace information with internal sales, inventory, catalog, and pricing systems.
Benchmark: A pipeline monitoring 100,000 products with 20 fields creates 2 million core field values per collection cycle. At this scale, automated validation and structured storage are essential for maintaining data usability.
Why Choose Product Data Scrape?
Web Scraping eBay E-Commerce Product Data can help brands, retailers, sellers, analysts, and marketplace teams transform fragmented listing information into structured datasets. The focus should be on data quality, scalability, recurring monitoring, and delivery formats that fit existing analytics workflows.
Key capabilities can include:
- Product and catalog data collection
- Price and discount monitoring
- Seller information tracking
- Product attribute extraction
- Historical marketplace datasets
- Data normalization
- Duplicate removal
- Product matching
- Recurring collection
- Analytics-ready delivery
A project can be designed around specific categories, SKUs, sellers, fields, and collection schedules. This makes the resulting dataset more useful for pricing teams, category managers, competitive intelligence professionals, and data analysts.
The broader objective is to create reliable marketplace intelligence that reduces repetitive research and supports faster, evidence-based commercial decisions.
What Business Decisions Can Structured Marketplace Data Improve?
A well-designed marketplace dataset can support several business functions simultaneously.
| Business Team |
Data Use Case |
Decision Supported |
| Pricing |
Price benchmarking |
Pricing review |
| Sales |
Product performance analysis |
Sales planning |
| Merchandising |
Assortment monitoring |
Catalog decisions |
| Marketing |
Promotion analysis |
Campaign planning |
| Strategy |
Seller intelligence |
Market assessment |
| Product |
Attribute analysis |
Catalog enrichment |
| Analytics |
Historical datasets |
Trend analysis |
For example, a pricing team can monitor competitor prices while a category team uses the same dataset to identify assortment changes. This reduces the need for separate manual research projects.
Historical data also allows businesses to build baselines. Instead of asking whether today's price is high or low in isolation, analysts can compare it against previous observations or category-level distributions.
For AI teams, structured product records can additionally become inputs for search, recommendation, classification, and product-matching applications.
Conclusion
Marketplace data becomes more valuable when businesses can collect it consistently, organize it accurately, and connect it to specific commercial decisions. Marketplace & Seller Intelligence can help organizations understand product positioning, seller activity, pricing movements, assortment changes, and marketplace competition.
eBay Sales Data Scraper API 2026 can support a scalable approach to recurring product and marketplace data collection, enabling pricing teams, retailers, sellers, analysts, and brands to work with structured historical information instead of fragmented manual observations.
The strongest solution combines collection with normalization, validation, historical storage, and analytics-ready delivery.
Partner with Product Data Scrape to build a customized eBay marketplace data pipeline for faster sales tracking, price analysis, seller monitoring, and competitive intelligence!
FAQs
1. What is an eBay sales data scraper API?
An eBay sales data scraper API is a structured data-access workflow designed to collect permitted marketplace information and deliver product, pricing, seller, or listing data for analytics.
2. Which eBay data can businesses monitor?
Depending on accessibility and permitted collection methods, businesses can monitor product details, prices, sellers, categories, availability, ratings, discounts, listing information, and historical observations.
3. How does automated eBay data collection help retailers?
Automated collection reduces repetitive manual research and creates consistent datasets that retailers can use for competitive pricing, assortment monitoring, seller analysis, product research, and marketplace strategy.
4. Can marketplace data support pricing intelligence?
Yes. Timestamped pricing observations can help businesses compare current and historical prices, calculate movements, identify promotional patterns, and benchmark products across sellers and categories.
5. How often should eBay marketplace data be collected?
Collection frequency depends on the use case. Fast-changing pricing may require frequent observations, while catalog research or category analysis may work with daily or weekly collection schedules.


 Singapore
 EMAIL
EMAIL
 PHONE
PHONE


.webp "thumb")













.webp)






