Introduction
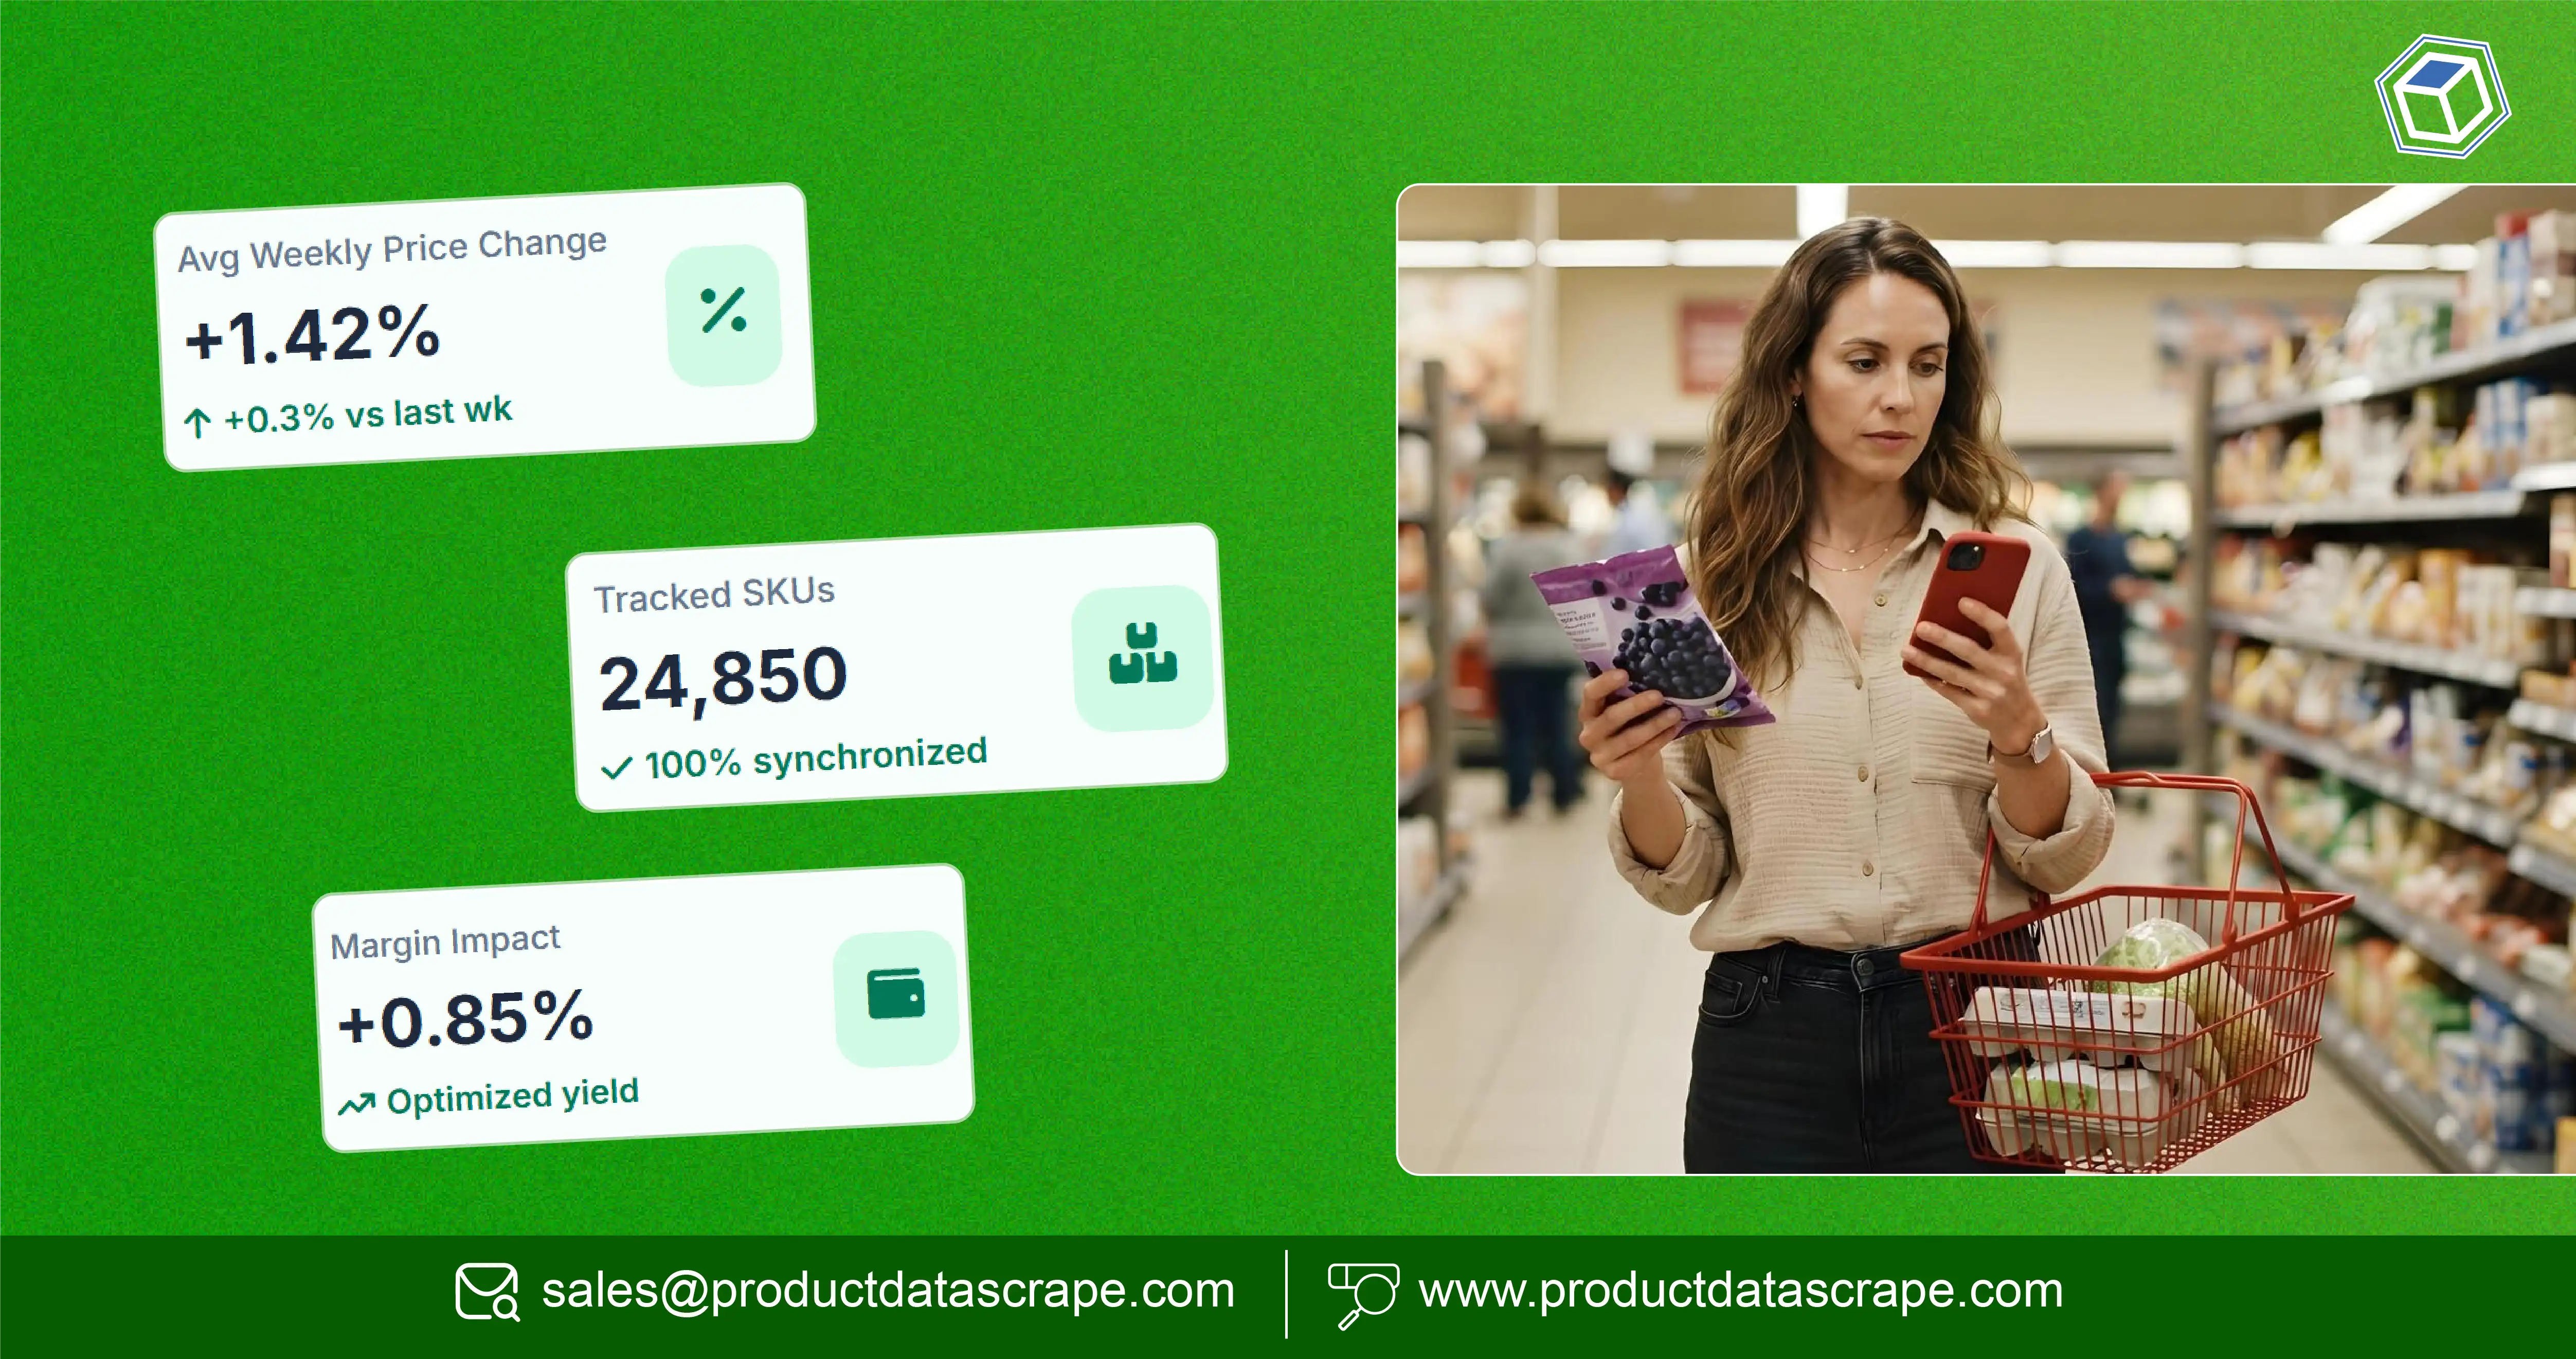
Weekly price tracking helps retailers distinguish temporary promotions from sustained price movements, identify competitor gaps, and respond faster to changing market conditions. Supermarkets Price Changes Data Analysis turns repeated price observations into structured intelligence for pricing, merchandising, category, and procurement teams.
A single price snapshot answers what a product costs today. A weekly dataset answers more useful questions: When did the price change? How often did it change? Was the movement category-wide? Did competitors move first? Was the change linked to a promotion or broader inflationary pressure?
This distinction matters because official Indian price statistics themselves rely on recurring market observations. MoSPI states that CPI price data are collected through a weekly roster across rural and urban markets, while the CPI/CFPI are released monthly.
For retailers, a Supermarket Product Database can complement macroeconomic statistics by capturing SKU-level online prices, promotions, availability, pack sizes, and retailer-specific movements.
The 2024–2026 period demonstrates why this matters. India's food inflation reached 8.39% in December 2024, while food inflation was 2.13% in January 2026 and 3.87% in March 2026 under the new CPI base series.
These movements demonstrate why retailers need both macro indicators and granular product-level observations.
How Does Weekly Collection Reveal Meaningful Price Movements?
Supermarket weekly Price Data Scraping gives retailers repeated observations of the same products instead of isolated snapshots. This creates a historical layer for identifying price increases, reductions, promotions, stock-related changes, and competitor movements.
From 2020 through 2026, grocery markets experienced periods of substantial volatility. The pandemic disrupted supply chains and shopping patterns in 2020–21; commodity and logistics pressures became prominent during 2022; food-price volatility remained important through 2023–24; and inflation moderated considerably in some periods during 2025–26. Rather than assigning a single annual number to online supermarket prices, retailers should connect these broader trends with SKU-level observations.
| Period |
Market intelligence focus |
Recommended tracking |
| 2020 |
Pandemic disruption |
Availability and price changes |
| 2021 |
Supply normalization |
Promotions and assortment |
| 2022 |
Commodity pressure |
Price increases and pack sizes |
| 2023 |
Food-price volatility |
Category benchmarking |
| 2024 |
Elevated food inflation |
Weekly price movements |
| 2025 |
Inflation moderation |
Competitive price gaps |
| 2026 |
Changing food-price momentum |
Real-time category monitoring |
Official data illustrate the importance of granular tracking. India's December 2024 food inflation was 8.39%, considerably above general CPI inflation of 5.22%. By January 2026, food inflation had fallen to 2.13%, before rising to 3.87% in March.
For retailers, this does not mean every SKU moved at the same rate. A category can experience inflation while individual products remain stable, receive promotions, or move in the opposite direction.
Weekly collection therefore creates a more actionable view. Retailers can calculate week-over-week changes, identify products with repeated increases, flag unusual movements, and separate promotional reductions from permanent price changes.
The practical workflow is straightforward:
- Collect product observations weekly.
- Match the same SKU across periods.
- Record price, MRP, discount, pack size, and availability.
- Calculate percentage movement.
- Flag significant changes.
- Compare movements across retailers.
- Review recurring category patterns.
This creates an evidence-based foundation for pricing decisions rather than relying on occasional manual checks.
How Can Retailers Compare Competitor Pricing More Effectively?
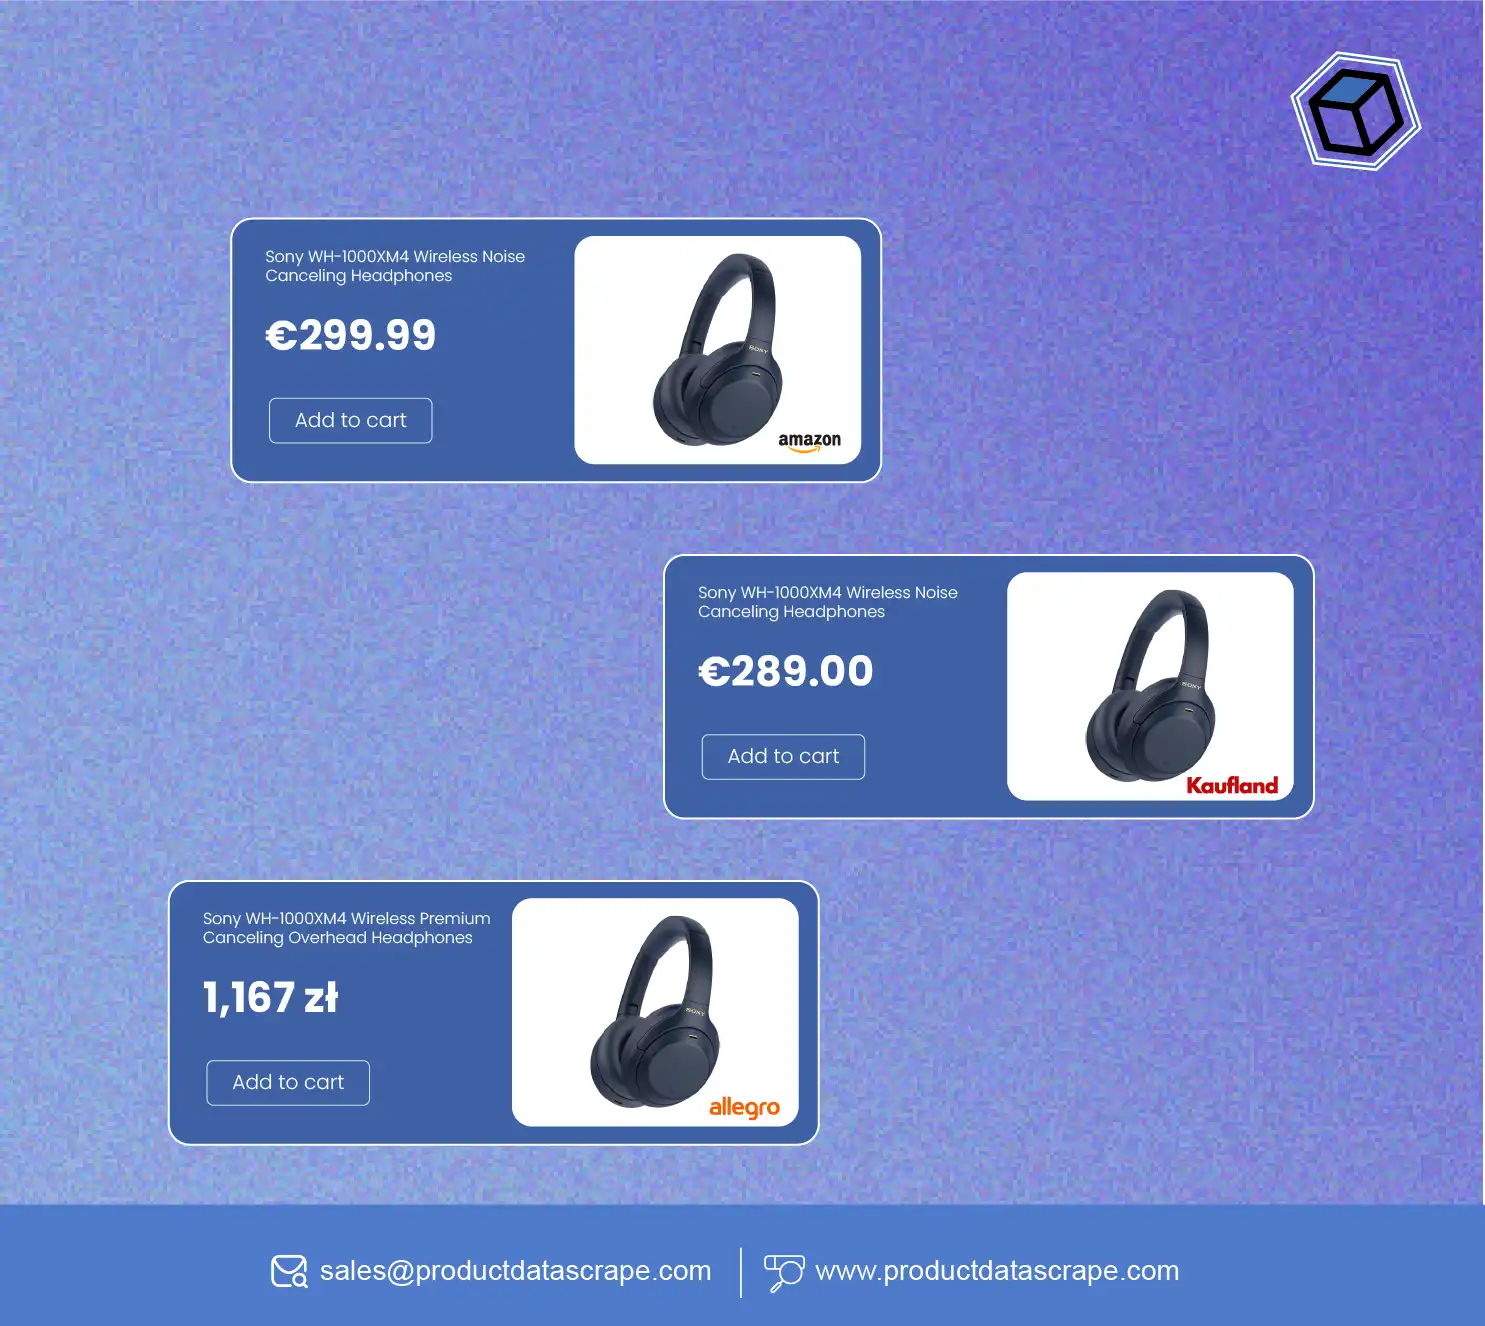
Grocery Competitive Pricing Intelligence helps retailers understand whether a price movement is isolated or part of a broader market change. This distinction is critical because a retailer may increase a product's price while competitors maintain their prices, creating a competitive gap.
A weekly competitive dataset allows category managers to compare equivalent SKUs and monitor changes across multiple retailers. Product matching should consider brand, product name, pack size, variant, quantity, and unit of measurement.
| Comparison |
Business question |
| Current vs previous week |
Did the price change? |
| Retailer A vs Retailer B |
Who is cheaper? |
| Brand vs private label |
Which offers stronger value? |
| MRP vs selling price |
How deep is the promotion? |
| Price per unit |
Is pack-size variation distorting comparison? |
| Availability + price |
Is a lower price actually actionable? |
The period from 2020 to 2026 also shows why historical context matters. During December 2024, food inflation was 8.39%, while the broader CPI rate was 5.22%. In March 2026, food inflation was 3.87% and overall CPI inflation was 3.40%.
A retailer should not interpret these macro figures as direct measures of its own online prices. Instead, they can serve as context for SKU-level observations.
For example, if cooking oil, pulses, or packaged staples show repeated weekly increases across several retailers, the movement may represent a broader category trend. If only one retailer changes its price, the movement could be promotional or strategic.
Weekly competitive intelligence can also reveal price leadership. If one competitor repeatedly moves first and others follow, that retailer may be influencing category pricing.
Another useful metric is the price gap percentage:
Price Gap % = (Retailer Price − Competitor Price) ÷ Competitor Price × 100
This enables category managers to prioritize products where their prices are materially above or below the market.
The result is a more precise pricing process: track, compare, contextualize, and then decide.
What Should a Retail Price Monitoring API Track?
A Retail Price Change Monitoring API can automate the movement of supermarket pricing data from online sources into internal dashboards, analytical systems, or databases.
The main advantage is consistency. Instead of analysts manually recording prices every week, automated workflows can collect the same fields repeatedly and create a time-series dataset.
A strong API-based monitoring structure can capture:
| Data field |
Why it matters |
| Product name |
Identifies the SKU |
| Brand |
Supports brand benchmarking |
| Category |
Enables category analysis |
| Pack size |
Enables like-for-like comparison |
| Selling price |
Measures current market position |
| MRP |
Calculates discount depth |
| Discount |
Tracks promotions |
| Availability |
Adds supply context |
| Rating |
Adds consumer-performance context |
| Timestamp |
Enables historical analysis |
MoSPI notes that CPI price data are collected from selected rural and urban markets through a weekly roster, demonstrating the value of recurring price observations in formal price measurement.
For commercial retail analytics, API-based collection can operate at a much more granular SKU level.
Between 2020 and 2026, the business requirement shifted from simply knowing current prices toward understanding price trajectories. A retailer can therefore calculate:
- Week-over-week price change.
- Four-week average price.
- Highest and lowest observed price.
- Promotion frequency.
- Competitor price gap.
- Price volatility.
- Availability-adjusted price movement.
The API can also support alerting. For example, a category manager may receive a notification when a priority competitor changes a product price by more than a predefined threshold.
This helps prevent information overload. Rather than sending every price observation to an analyst, the system can surface only meaningful exceptions.
For larger retailers, the API can feed multiple systems simultaneously. Pricing teams can consume competitive benchmarks, category teams can use assortment intelligence, and management dashboards can display market-level trends.
The important principle is that the API should not simply transport raw data. It should preserve timestamps, product identity, and historical relationships so the resulting information remains analytically useful.
How Can a Supermarket Build Reliable SKU-Level Price Data?
A Supermarket Product Price Scraper provides the collection layer required to build consistent product-level price histories from online supermarket channels.
The challenge is not merely extracting a number. Product pages can contain multiple pack sizes, promotional prices, MRP values, membership discounts, unavailable products, and changing product descriptions. Without proper normalization, these records can produce misleading conclusions.
A reliable collection framework should therefore capture the full pricing context.
| Requirement |
Example |
| SKU identity |
Stable product identifier |
| Product title |
Standardized name |
| Quantity |
500 g, 1 kg, 2 L |
| Selling price |
Current consumer price |
| MRP |
Reference price |
| Discount |
Promotional difference |
| Availability |
In stock/out of stock |
| Retailer |
Source supermarket |
| Location |
Relevant market/pincode |
| Timestamp |
Exact observation time |
The 2020–2026 period reinforces the value of historical records. Market conditions changed substantially during the pandemic, supply normalization, commodity volatility, and subsequent inflation moderation. But these broad phases cannot explain individual SKU behavior.
For example, two products within the same category may experience completely different price trajectories because of brand strategy, pack size, promotion, or availability.
The scraper should therefore support product identity resolution. If a retailer changes the title from "Premium Basmati Rice 5 kg" to "Premium Basmati Rice – 5kg," the system should ideally recognize that both records refer to the same product.
Unit normalization is equally important. Comparing a ₹100 500-g pack with a ₹170 1-kg pack using only headline prices would produce an inaccurate competitive conclusion. Price-per-unit calculations make the comparison more meaningful.
A robust pipeline should also retain historical records instead of overwriting previous observations.
That allows businesses to ask:
- Which SKUs changed price most frequently?
- Which brands use discounts most often?
- Which categories have the highest volatility?
- Which competitor consistently undercuts the market?
- Which price reductions coincide with increased availability?
These questions turn raw supermarket data into actionable retail intelligence.
How Can Weekly Analytics Improve Pricing Decisions?
Supermarket Weekly Pricing Analytics transforms repeated observations into metrics that pricing teams can act on. The goal is not simply to produce another report but to identify patterns that would be difficult to see from individual price snapshots.
Weekly analysis is especially useful for retailers because promotions often operate on short cycles. A product may be discounted for one week and return to its previous price afterward. If analysts review only monthly data, that temporary movement may disappear from the final picture.
A weekly analytical framework can classify movements as:
| Movement |
Interpretation |
| One-week decline |
Possible promotion |
| Repeated decline |
Strategic price repositioning |
| One-week increase |
Temporary adjustment |
| Repeated increase |
Sustained price pressure |
| Competitor-only decline |
Competitive action |
| Market-wide increase |
Category-level pressure |
| Price + availability decline |
Potential supply issue |
Official Indian statistics also show that food prices can change materially over short periods. In February 2026, MoSPI highlighted month-over-month decreases of more than 10% for tomato, peas, and cauliflower. This illustrates why monthly or annual averages alone can hide significant short-term movements.
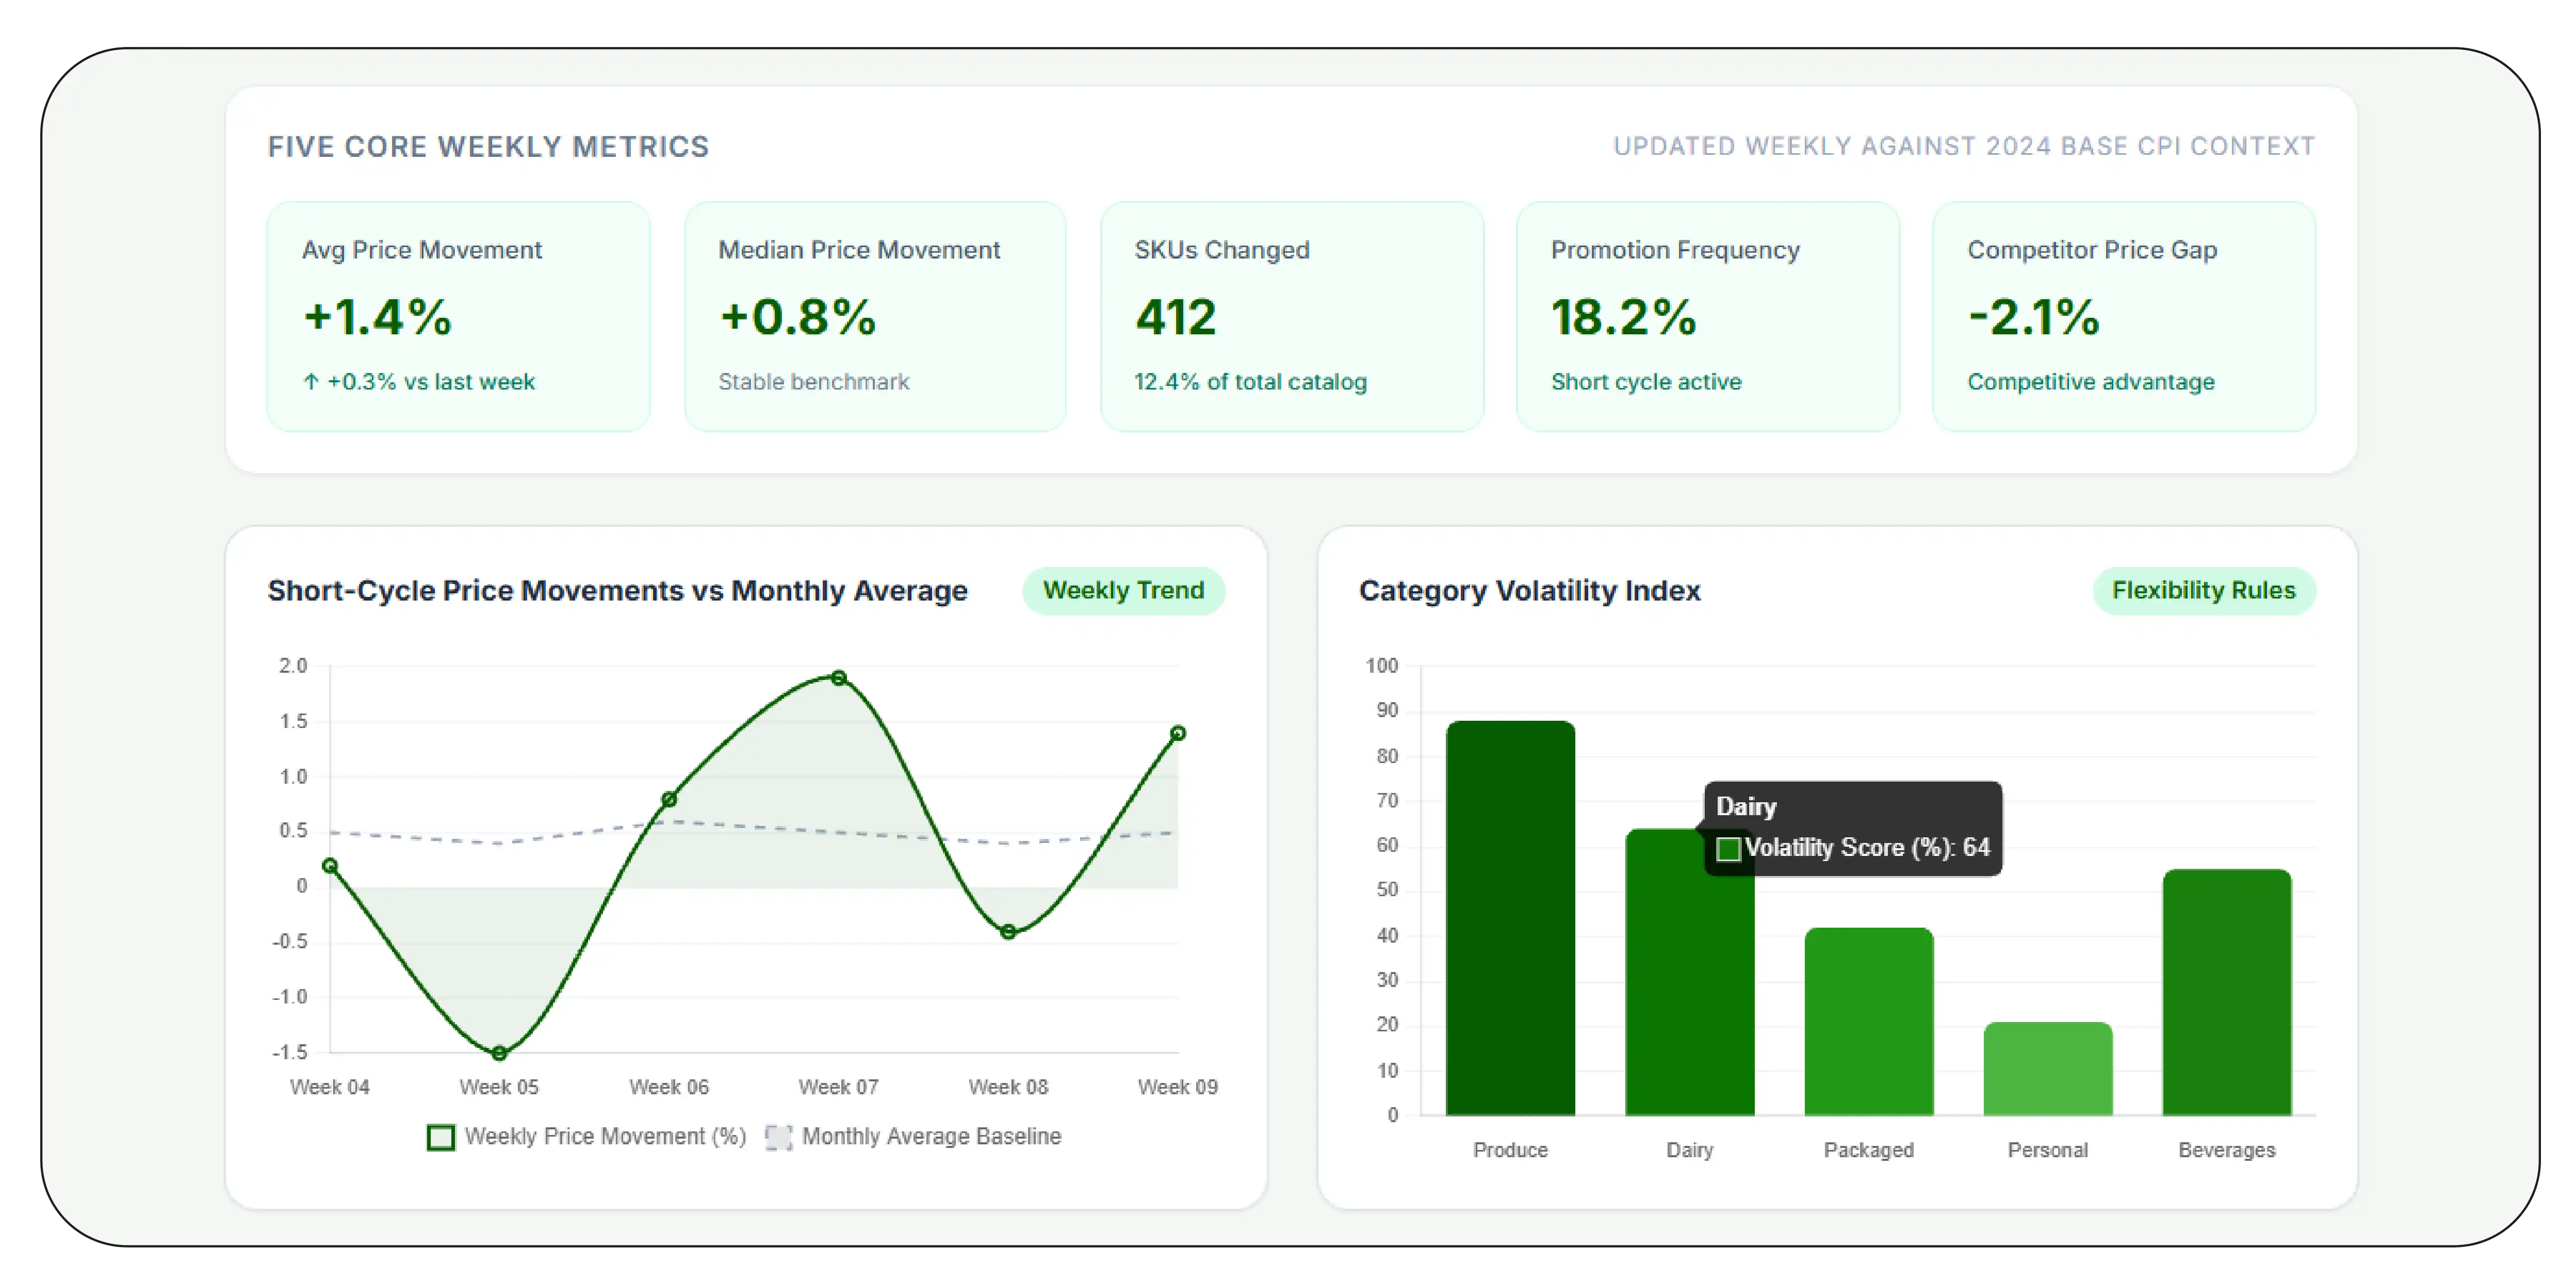
Retailers can build weekly dashboards around five core metrics:
- Average price movement
- Median price movement
- Number of SKUs changed
- Promotion frequency
- Competitor price gap
A useful additional measure is category volatility. If a category has frequent price changes, pricing teams may require more frequent monitoring and more flexible decision rules.
The 2025–26 transition is another reason to maintain historical context. India's CPI series was updated to a 2024 base, and MoSPI noted that the revision incorporated newer consumption patterns based on the 2023–24 Household Consumption Expenditure Survey.
Retailers should similarly maintain consistent internal definitions when comparing their own historical data.
Weekly analysis becomes most valuable when it connects price changes with promotions, availability, competitor behavior, and product attributes. That combination helps teams determine whether a movement requires action or simply reflects normal promotional cycles.
How Can Retailers Collect Product Data Across Supermarket Websites?
A Supermarket Websites Product Data Scraper can provide a scalable method for collecting structured product observations across multiple digital supermarket environments.
The business case is straightforward: retailers cannot make reliable competitive comparisons if the underlying product data is incomplete, inconsistent, or outdated.
From 2020 to 2026, digital grocery became an increasingly important source of market information. Online product pages can reveal not only prices but also assortment breadth, pack-size choices, promotional activity, ratings, availability, and product positioning.
A multi-source workflow should standardize these observations into one analytical structure.
| Data layer |
Retail application |
| Product catalogue |
Assortment comparison |
| Price history |
Competitive pricing |
| Promotion history |
Discount analysis |
| Availability |
Stock intelligence |
| Pack sizes |
Value comparison |
| Brand information |
Brand benchmarking |
| Ratings |
Customer perception |
| Timestamp |
Trend analysis |
The workflow should also distinguish between price availability and product availability. A product listed at ₹120 but unavailable to customers does not necessarily represent an actionable competitive price.
Location is another important variable. Grocery prices may differ by city, store, fulfilment area, or pincode. Retailers should therefore capture location context whenever it is available and relevant to the business question.
A structured dataset can support regional comparisons such as:
- Same SKU across cities.
- Same brand across retailers.
- Same category across locations.
- Competitor price gaps by market.
- Availability differences by geography.
The resulting dataset can then be refreshed weekly or more frequently depending on the category's volatility.
This creates a feedback loop: collect prices, compare products, detect changes, evaluate context, and update pricing decisions.
The objective is not to collect the maximum amount of data. It is to collect the right product data consistently enough to support repeatable decisions.
Why Choose Product Data Scrape?
Product Data Scrape focuses on turning supermarket product information into structured, decision-ready datasets rather than delivering disconnected snapshots. The workflow can combine product discovery, price extraction, historical tracking, product matching, promotion monitoring, and availability signals.
For retailers, this means pricing and category teams can work from a common dataset instead of maintaining separate spreadsheets. Automated refreshes reduce repetitive collection, while historical records make it possible to understand whether a movement is temporary or sustained.
The approach also supports granular SKU-level analysis. Teams can compare equivalent products, calculate price gaps, identify high-volatility categories, and monitor competitor behavior.
Weekly Review Tracking can complement Supermarkets Price Changes Data Analysis by adding recurring observations that reveal patterns across successive periods.
The focus remains on actionable intelligence: what changed, where it changed, how significant the movement was, and what the retailer should investigate next.
Conclusion
Retail pricing becomes more responsive when businesses can see how prices change over time rather than relying on isolated snapshots. Grocery data scraping creates the foundation for collecting structured product, price, promotion, and availability information across supermarket channels.
The broader value of Supermarkets Price Changes Data Analysis lies in connecting weekly SKU-level observations with competitive benchmarks and macroeconomic context. Official data show that food-price movements can vary significantly across periods and even individual items.
Retailers can use this intelligence to identify price gaps, distinguish promotions from sustained movements, prioritize volatile categories, and improve pricing responsiveness.
Partner with Product Data Scrape to build a weekly supermarket price intelligence workflow and turn changing retail prices into faster, data-driven pricing decisions!
FAQs
1. Why should supermarkets track prices weekly?
Weekly tracking captures short-term promotions, competitor changes, and price volatility that monthly or quarterly snapshots can overlook, giving pricing teams more timely evidence for commercial decisions.
2. What supermarket data should retailers monitor?
Retailers should monitor product names, SKUs, prices, MRP, discounts, pack sizes, availability, brands, categories, locations, ratings, and timestamps for meaningful historical comparisons.
3. Can weekly pricing data identify competitor strategies?
Yes. Repeated observations can reveal competitor price leadership, promotional frequency, sustained price reductions, category-level movements, and differences between temporary discounts and longer-term repositioning.
4. How does Product Data Scrape support supermarket analysis?
Product Data Scrape can structure product and pricing observations into datasets that support SKU comparisons, historical tracking, competitive benchmarking, promotion analysis, and availability monitoring.
5. Why is historical price data important?
Historical data establishes context for current prices. It helps retailers determine whether a price is unusually high or low, identify recurring promotions, measure volatility, and recognize longer-term trends.


 Singapore
 EMAIL
EMAIL
 PHONE
PHONE
















.webp)






