Introduction
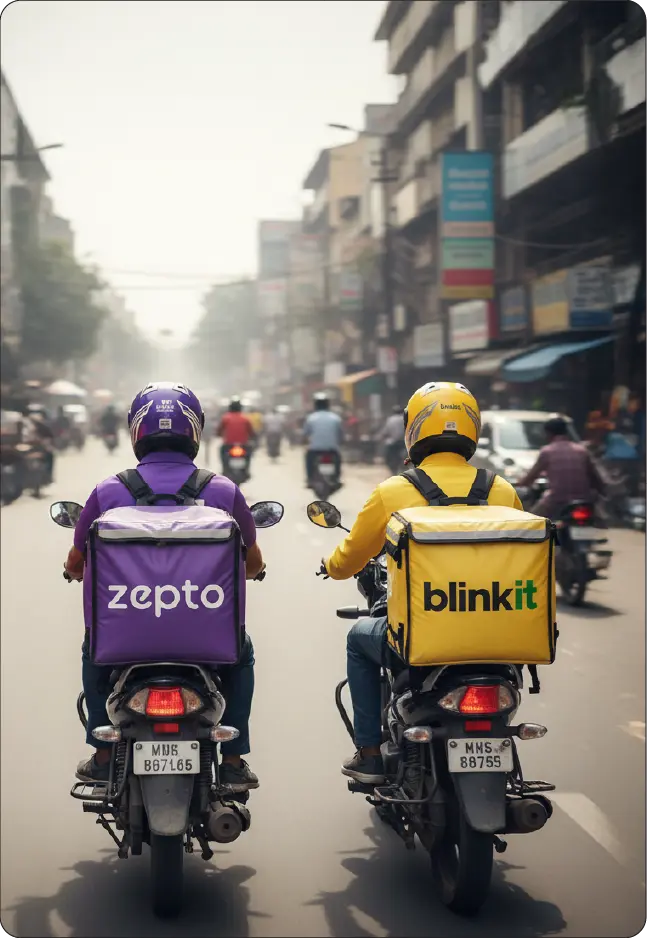
Quick commerce has changed how consumers discover, compare, and purchase everyday products. Brands must monitor product visibility, pricing, availability, search rankings, and competitor activity across platforms to remain competitive. Digital Shelf Analytics for Quick Commerce helps businesses track these performance indicators weekly, identify visibility gaps, and make data-driven decisions that improve product discovery and sales opportunities.
Unlike traditional e-commerce, quick commerce operates through hyperlocal fulfilment networks, where product availability and delivery speed can vary by location. A product visible in one neighbourhood may be unavailable in another because of differences in dark-store inventory, assortment, and local demand.
This makes continuous marketplace intelligence essential for FMCG manufacturers, retailers, distributors, and D2C brands. Businesses also need Delivery fee & time tracking to understand how delivery charges, estimated arrival times, and fulfilment promises influence the customer experience.
According to Bain and Flipkart's How India Shops Online 2025 report, quick commerce accounted for approximately 70–75% of India's e-grocery GMV in 2024, compared with around 35% in 2022. This demonstrates how rapidly the channel has developed into an important retail environment.
For brands, weekly monitoring is no longer just about checking whether products appear online. It is about understanding how effectively products compete for digital shelf space, customer attention, and purchase consideration.
How Can Brands Understand Product Performance Across Different Platforms?
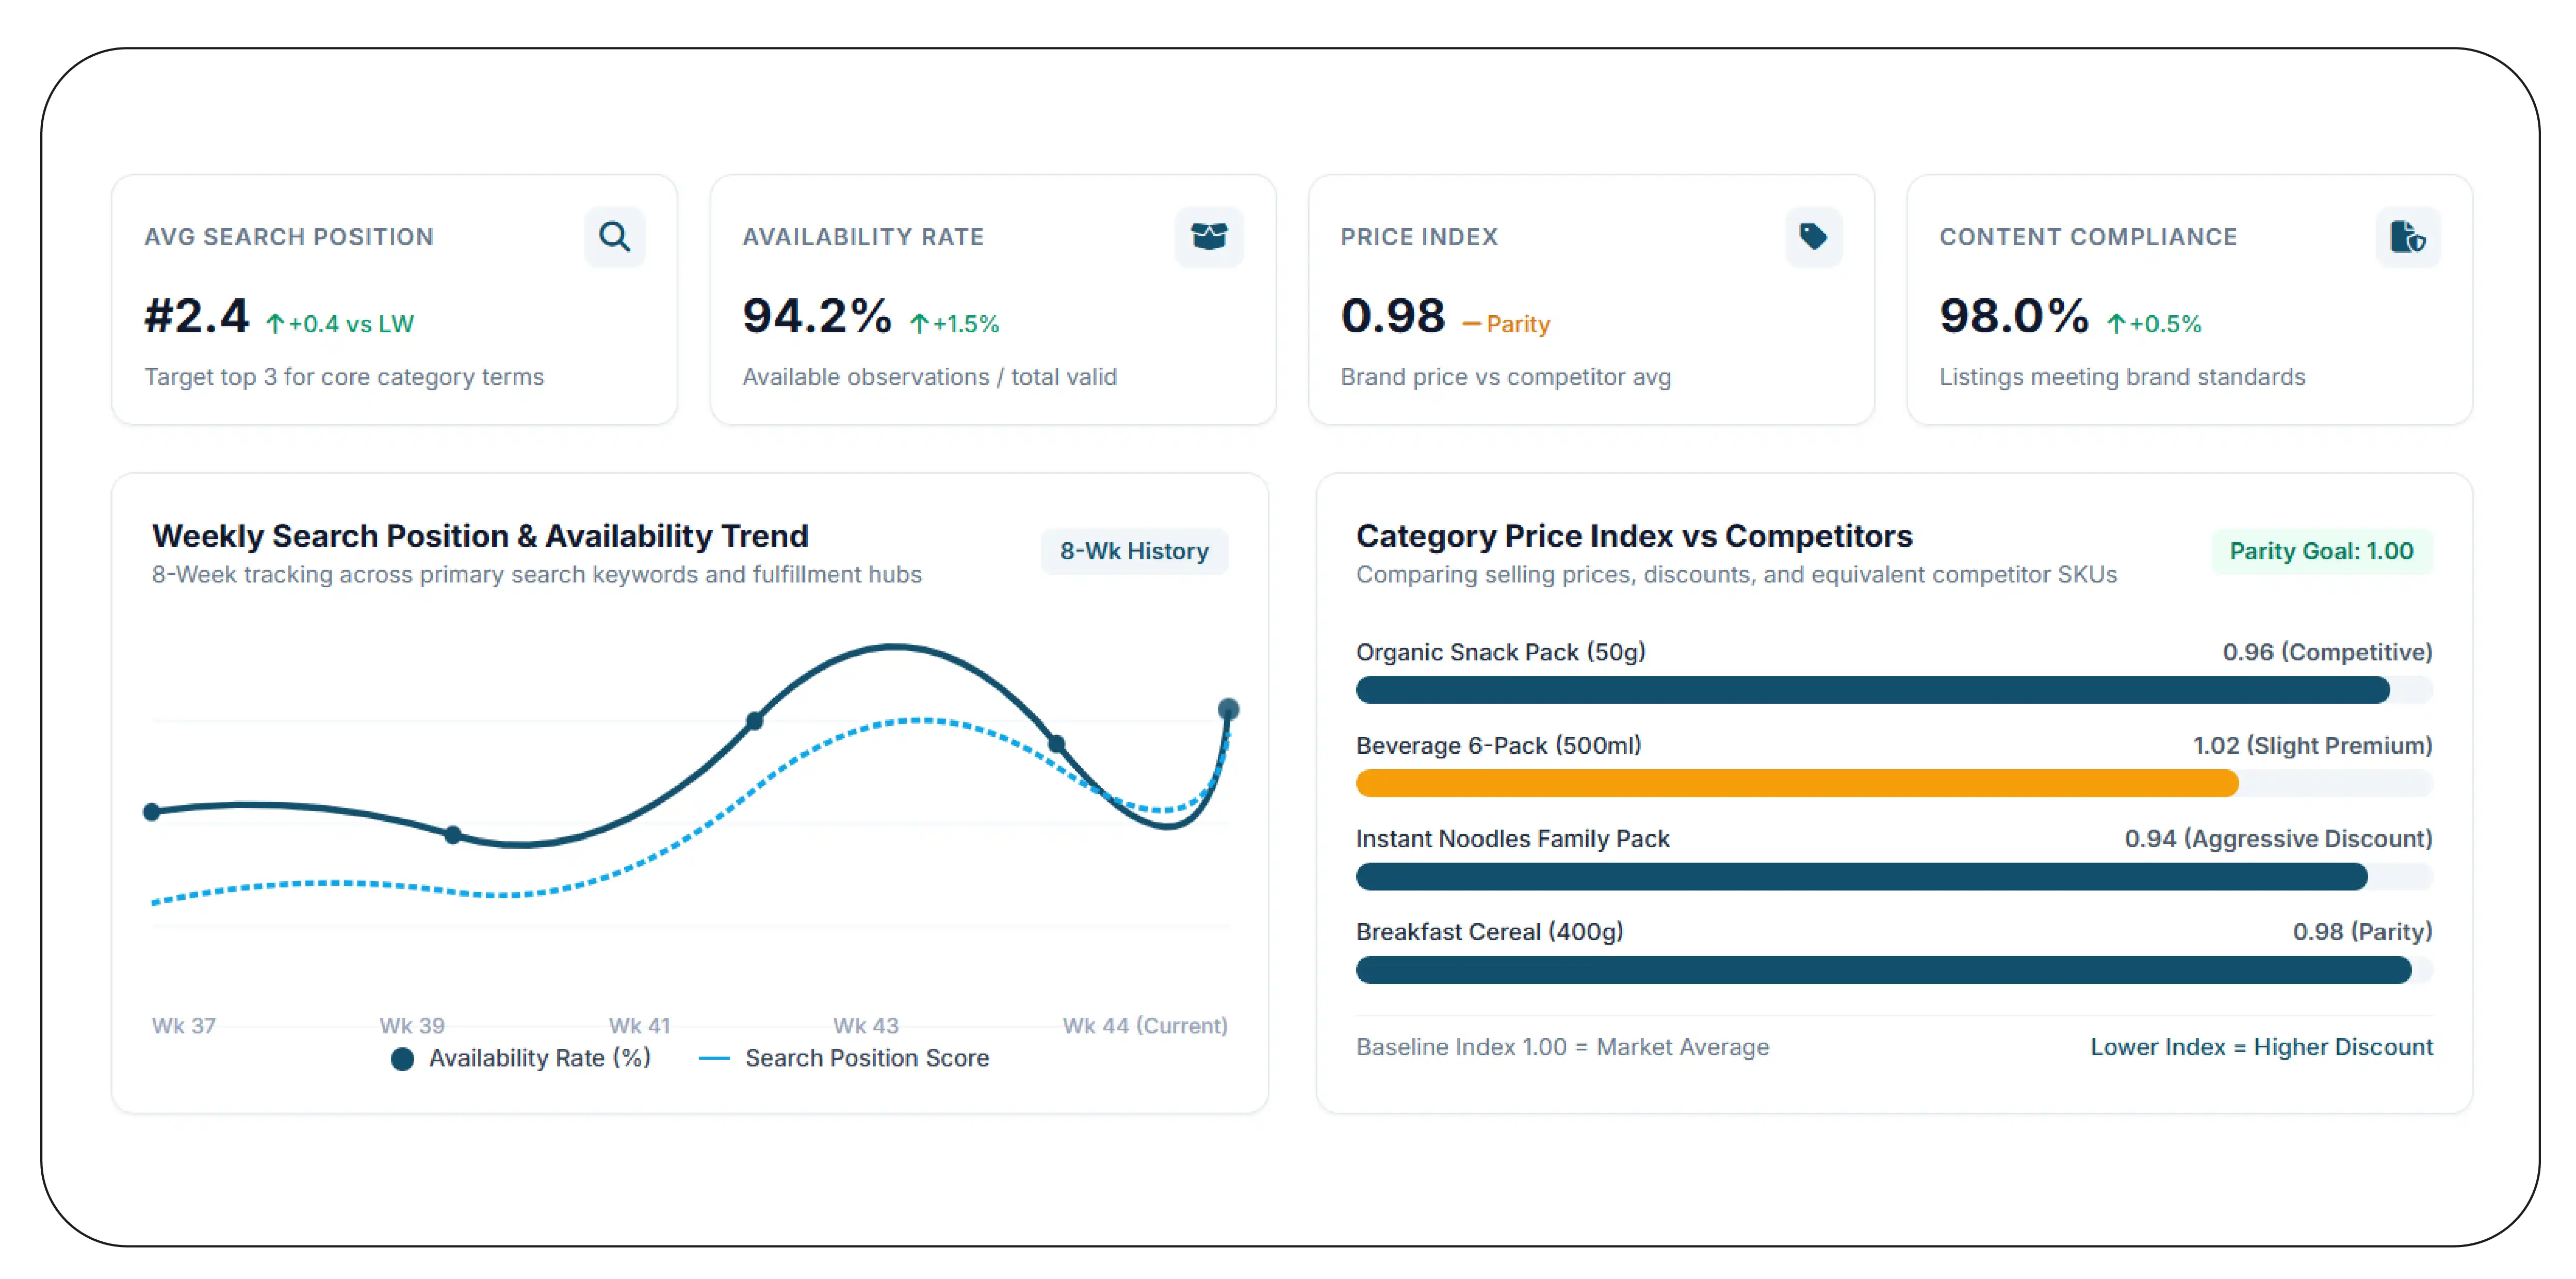
FMCG companies need accurate visibility into how their products perform across quick commerce applications. Product rankings, listing accuracy, pricing, availability, ratings, and promotional placements can differ between platforms and locations. Without consistent monitoring, brands may overlook distribution gaps or lose visibility to competing products.
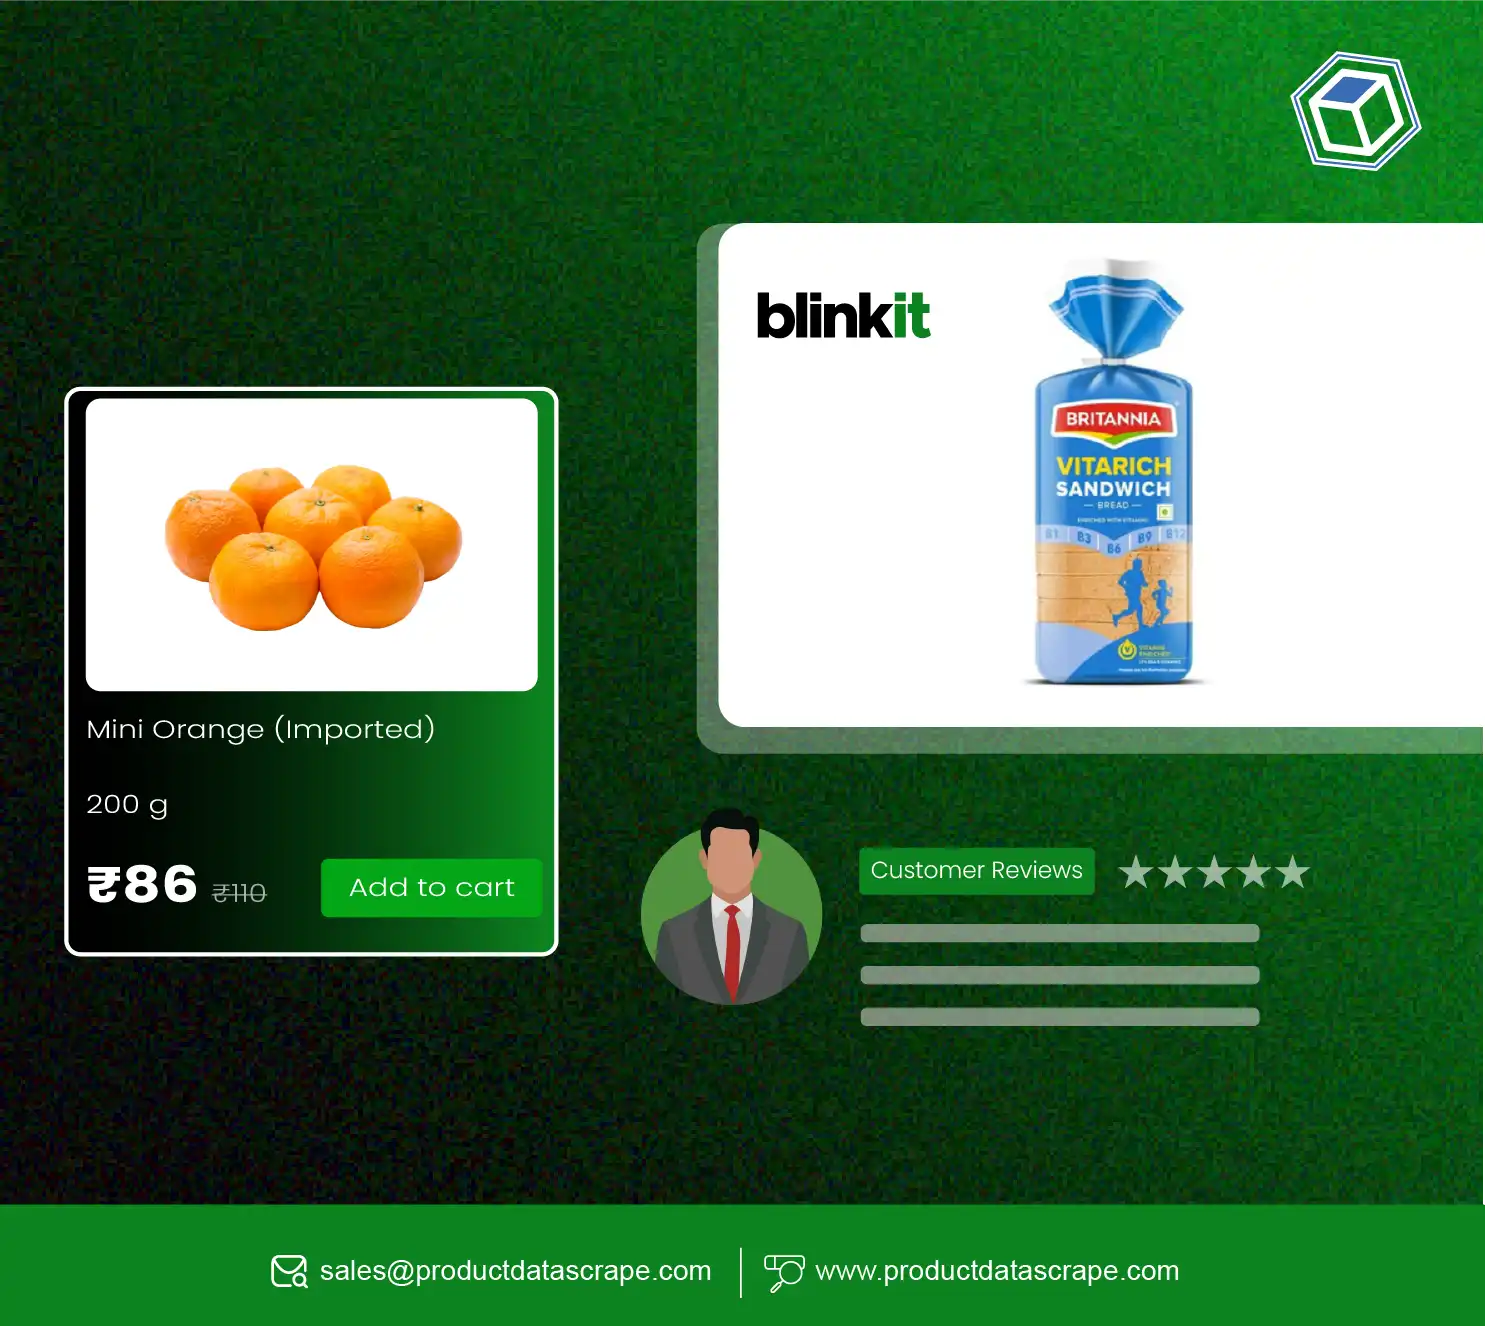
FMCG Digital Shelf Performance Tracking helps businesses evaluate these factors through structured marketplace data. Brands can examine product titles, descriptions, images, pack sizes, MRP, selling prices, discounts, and availability across platforms such as Blinkit, Zepto, and Swiggy Instamart. The objective is to identify inconsistencies and understand which products receive stronger digital exposure.
The expansion of this channel makes such analysis increasingly relevant. According to IBEF's May 2025 industry coverage, six major FMCG companies recorded combined quick commerce sales exceeding ₹4,400 crore in FY25. These companies included HUL, Britannia, AWL Agri-Business, Dabur, Tata Consumer Products, and Marico.
Brands can use Quick commerce & FMCG data to compare product-level performance, identify assortment gaps, and understand changing category demand. Weekly reviews can highlight products that disappear from listings, experience price changes, or lose promotional visibility.
For example, a packaged-food manufacturer can compare the availability of different pack sizes across delivery locations. If one SKU repeatedly becomes unavailable, the brand can investigate replenishment, distribution, or inventory allocation.
| Performance indicator | What brands should monitor | Business value |
|---|
| Product availability | In-stock and out-of-stock status | Identifies distribution gaps |
| Listing accuracy | Titles, images, descriptions | Improves product information |
| Selling price | MRP, discounts, final price | Supports pricing decisions |
| Product ratings | Average ratings and reviews | Highlights customer feedback |
| Search position | Product placement in results | Measures discoverability |
The historical development of quick commerce also explains why brands need structured performance measurement.
| Period | Verified industry development |
|---|
| FY2020 | India's quick commerce GMV was estimated at approximately $0.1 billion. |
| FY2021 | Estimated GMV remained approximately $0.1 billion. |
| FY2022 | Estimated GMV increased to approximately $0.5 billion. |
| FY2023 | Estimated GMV reached approximately $1.9 billion. |
| FY2024 | Estimated GMV reached approximately $3.3 billion in the Redseer-based industry compilation. |
| 2025 | Bain and Flipkart reported a $6–7 billion market value for 2024; Redseer subsequently described the sector as a $10 billion-plus GMV market in July 2025. |
| FY2026 | Redseer's October 2026 outlook places the market at approximately $13–14 billion. |
Sources: Redseer-based historical estimates reproduced in the Quick Commerce Industry report; Reuters industry coverage; Redseer, July 2025; Redseer, 2026. These are published estimates from different reports and should not be treated as one harmonised statistical series.
Why Should Businesses Monitor Product Search Rankings and Competitor Pricing?
Product discovery is an important part of quick commerce because customers frequently search for specific brands, categories, and everyday essentials. Products appearing prominently in relevant search results have more opportunities to attract customer attention. However, visibility can change with location, search terms, inventory, and platform merchandising.
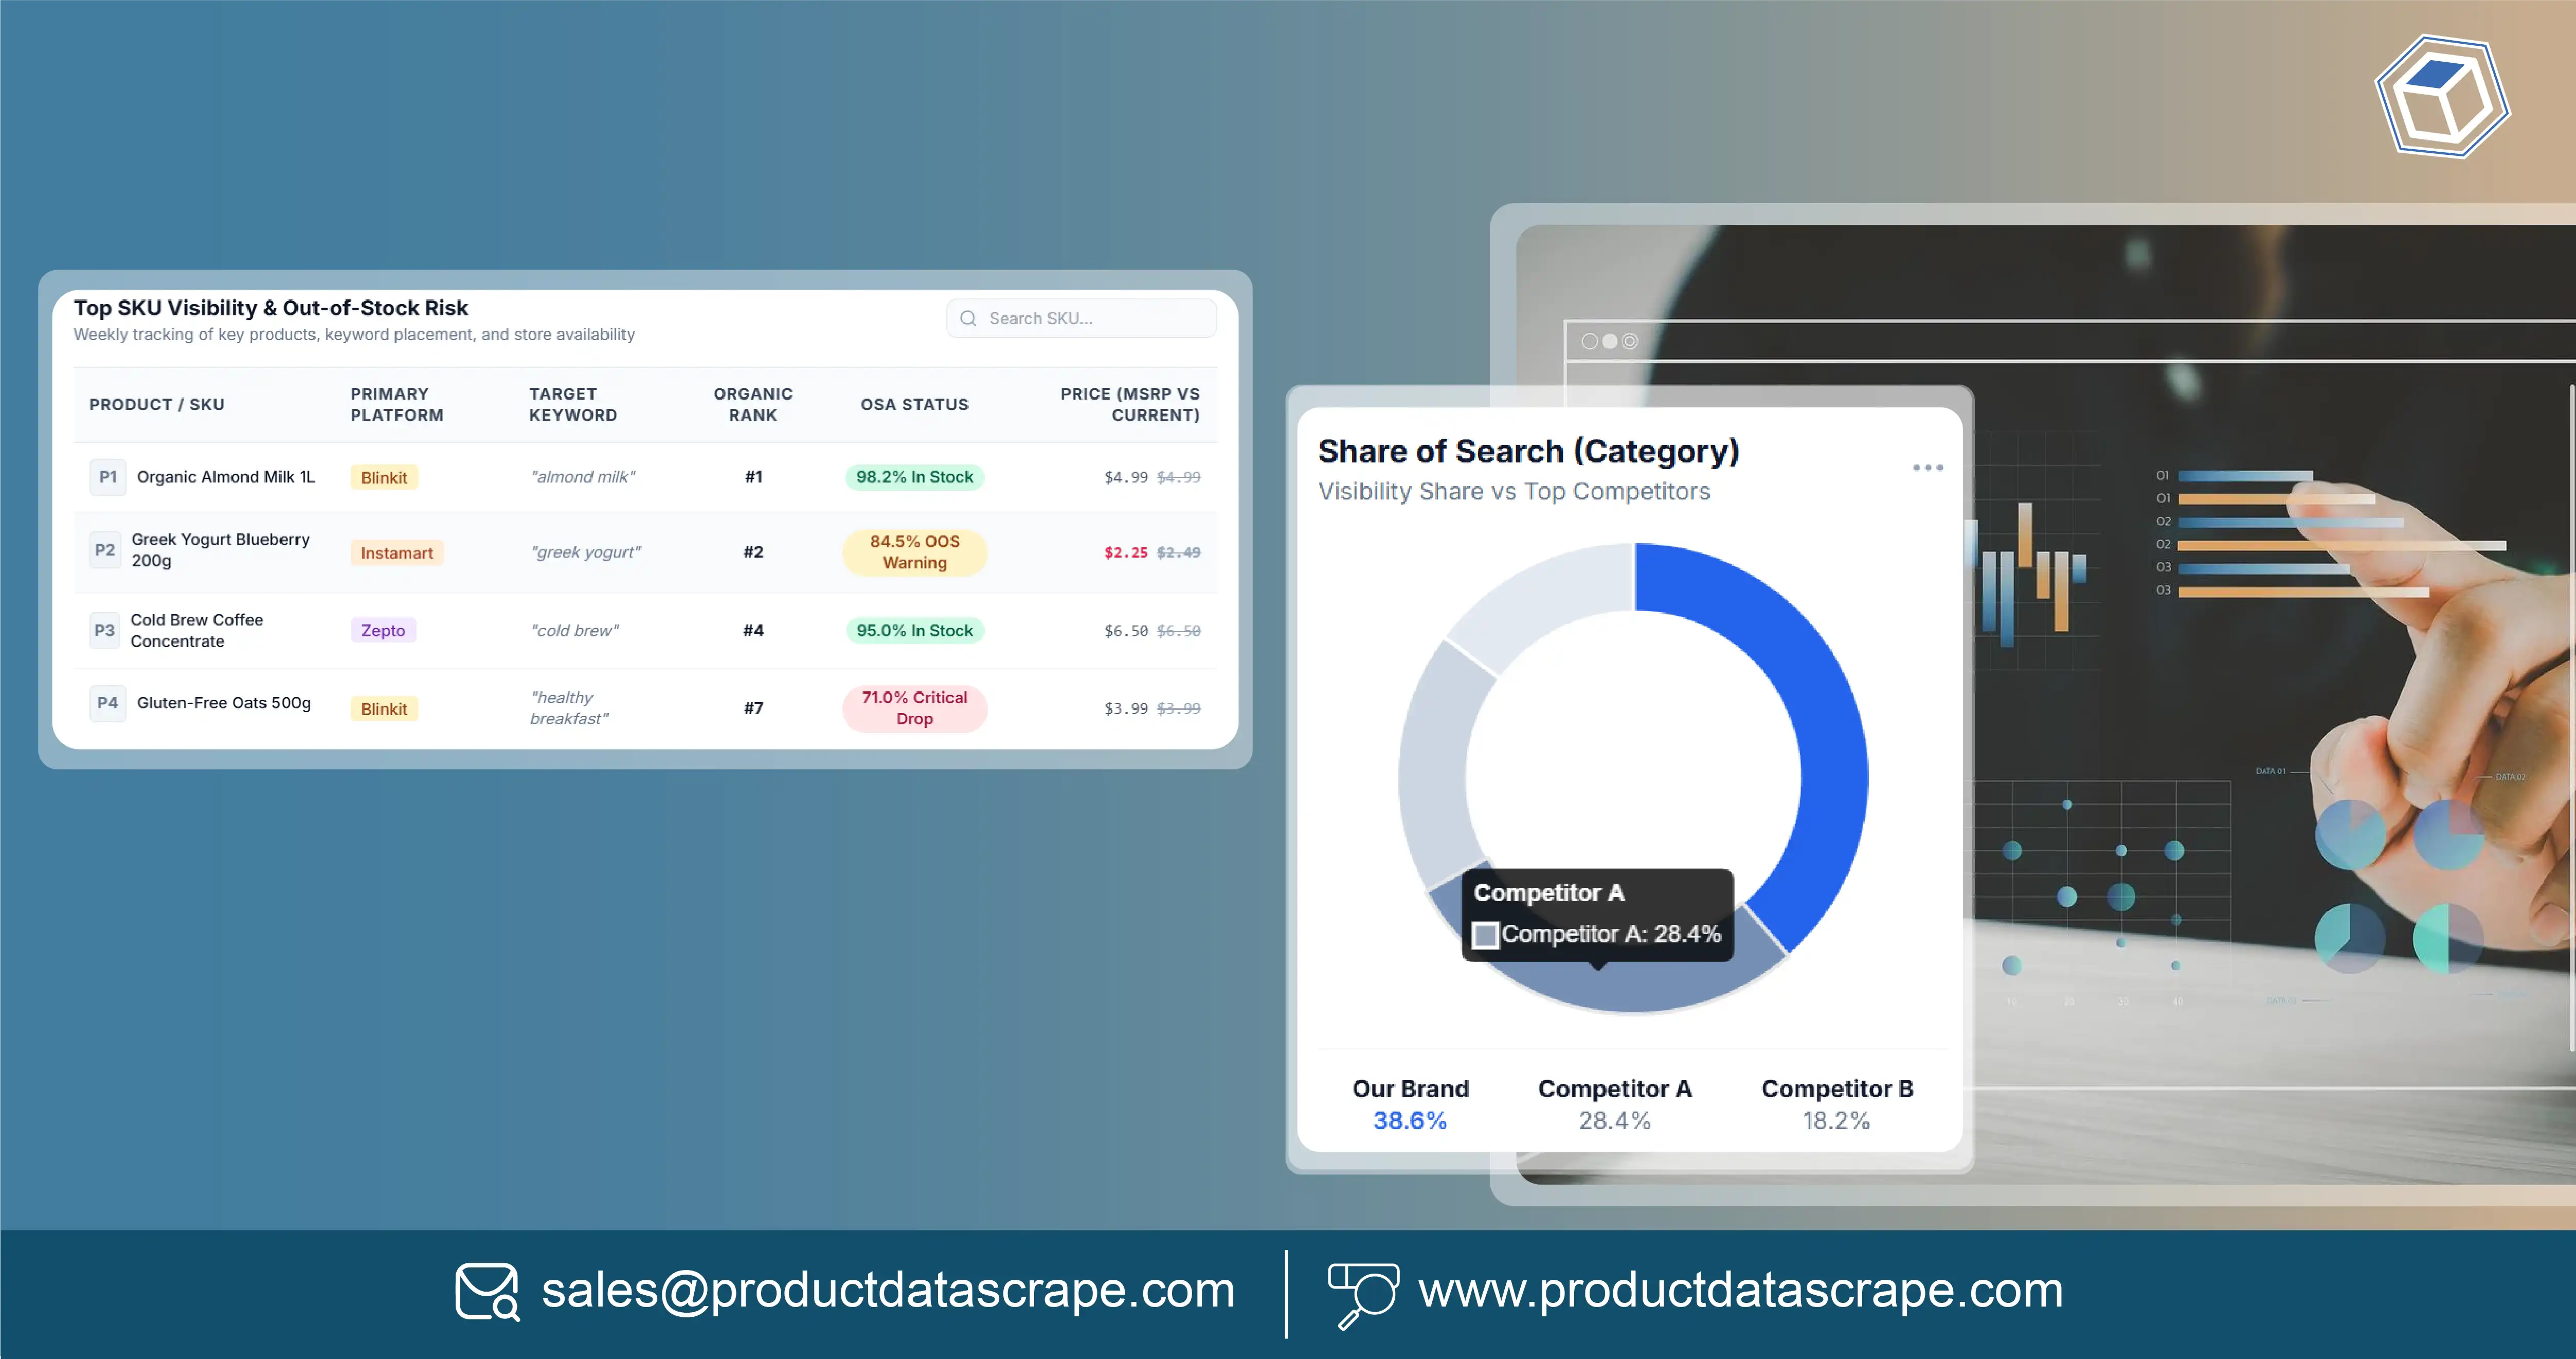
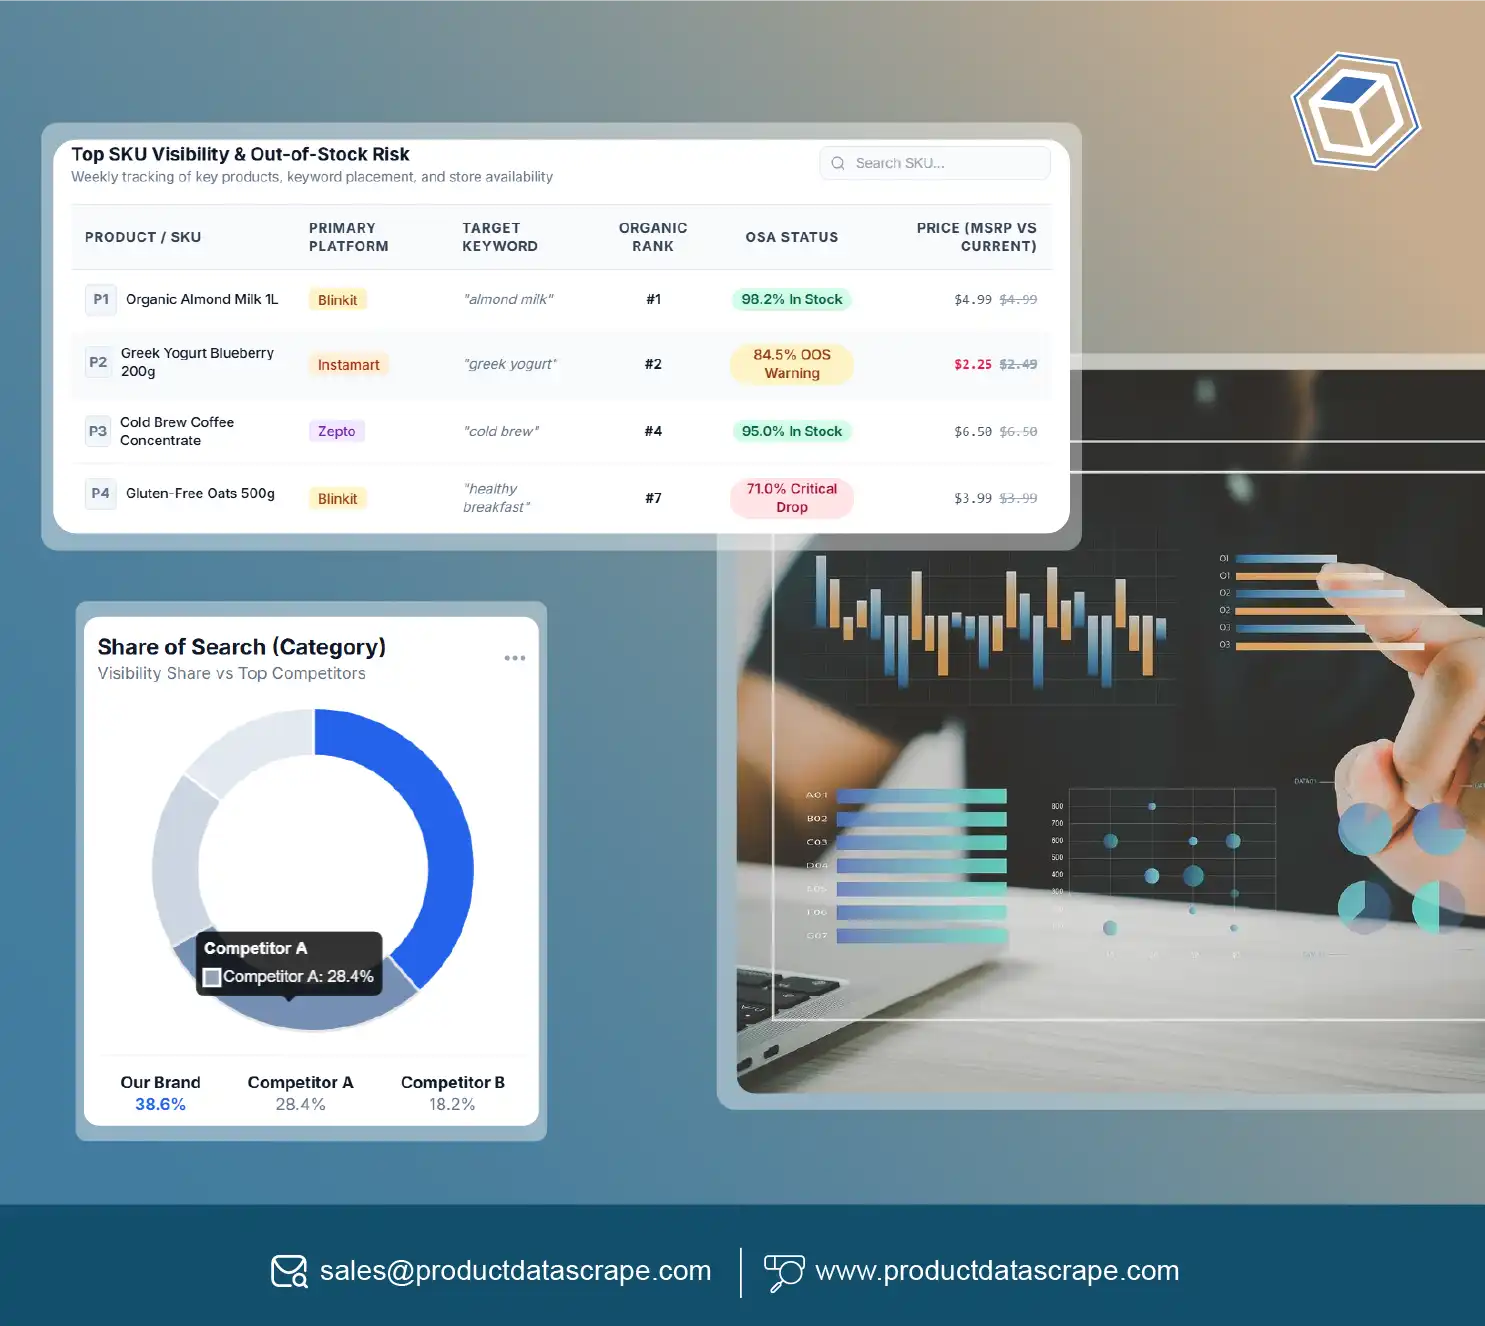
Quick Commerce Share of Search Data Tracking helps brands understand how frequently their products appear for relevant category and brand searches compared with competing products. Instead of relying on occasional manual searches, businesses can maintain a structured record of search positions, visible listings, sponsored placements, and competitor presence.
For example, a personal-care company can monitor searches related to shampoo, conditioners, and hair oils. It can compare how often its products appear against competing brands and identify search terms where its visibility is limited.
Competitive pricing data adds another layer of intelligence. Brands can examine regular prices, promotional discounts, pack-size differences, and price changes across comparable products. This is particularly important when competing brands introduce temporary promotions or change their assortment.
The Bain and Flipkart 2025 report highlights the scale of the opportunity: quick commerce represented approximately 70–75% of Indian e-grocery GMV in 2024, up from around 35% in 2022. The report also identifies rapid delivery through dark-store networks as a defining feature of the model.
Brands should evaluate search visibility and pricing together rather than treating them as separate activities. A product may have a competitive price but limited search exposure. Another product may rank prominently but lose its competitive advantage because of a higher selling price.
| Metric | Weekly analysis | Recommended action |
|---|
| Search ranking | Compare positions for priority terms | Review listing relevance |
| Share of search | Compare brand visibility with competitors | Identify discovery gaps |
| Sponsored placement | Record visible paid placements | Evaluate advertising strategy |
| Price difference | Compare equivalent pack sizes | Review pricing competitiveness |
| Discount frequency | Track promotional changes | Assess promotion consistency |
A weekly comparison helps marketing and category teams identify changes early. Businesses can then investigate whether reduced visibility relates to product availability, listing quality, competitor promotions, or advertising placements.
Importantly, share of search should be calculated using a consistent methodology. Brands should define the same keywords, locations, platforms, and observation frequency before comparing results. Otherwise, differences in search conditions may create misleading conclusions.
How Does Category-Level Monitoring Help Identify Local Market Opportunities?
Quick commerce platforms operate through neighbourhood-level fulfilment networks. Product assortment, pricing, stock availability, and delivery estimates can differ between locations because each fulfilment centre serves a specific delivery area. Consequently, national-level performance reports may not reveal what customers actually see in individual markets.
Quick Commerce Category-Level KPI Tracking helps businesses evaluate performance across product categories, subcategories, brands, and geographic locations. Companies can monitor categories such as packaged foods, beverages, personal care, household cleaning, beauty, and dairy to understand where their products receive better visibility.
Hyperlocal pricing intelligence makes these comparisons more useful by connecting product prices with location-specific availability and promotional activity. For example, a beverage brand may find that its products have different selling prices or promotional placements across two neighbourhoods. Such differences can help the business investigate local competition, platform promotions, and assortment strategies.
The importance of category-level monitoring is supported by NielsenIQ's 2026 commerce research. Its findings identify increasing quick commerce engagement in Indian beauty and home-care categories, with average order values in these categories rising 40% and 54%, respectively, year over year in the reported comparison. The research also highlights the continued importance of grocery purchasing.
For category managers, these developments make weekly monitoring valuable for identifying changing consumer demand and improving assortment decisions. Businesses can compare product visibility across locations, identify categories with limited availability, and determine whether competitors are receiving stronger promotional exposure.
| Category | Important KPIs | Strategic application |
|---|
| Packaged food | Price, availability, search position | Improve assortment coverage |
| Beverages | Discounts, pack sizes, visibility | Evaluate promotional activity |
| Personal care | Ratings, product content, ranking | Improve product discovery |
| Home care | Availability, price, competitor SKUs | Identify local opportunities |
| Dairy | Stock status, price, delivery estimates | Monitor essential-product availability |
| Beauty | Ratings, visibility, assortment | Understand category expansion |
A practical monitoring programme should maintain separate records for each platform and location. Businesses should also distinguish between a product that is genuinely unavailable and one that is simply not displayed for a particular search.
Category-level reporting becomes more actionable when teams connect marketplace observations with internal sales, inventory, and distribution information. This helps decision-makers investigate whether a performance issue originates from product demand, local inventory, pricing, or listing execution.
What Should Brands Measure Every Week to Improve Product Discoverability?
Product visibility is not determined by a single ranking or listing position. It depends on multiple factors, including product availability, search relevance, product information, customer feedback, pricing, and promotional placement.
Weekly Quick Commerce Product Visibility Tracking gives brands a repeatable way to measure these factors and understand how their digital shelf presence changes over time. Rather than checking listings occasionally, businesses can establish a weekly measurement schedule across their priority platforms and service locations.
Digital Shelf Analytics for Quick Commerce enables businesses to organize marketplace observations into measurable performance indicators. These indicators help marketing, sales, and category teams understand whether their products remain discoverable and competitively positioned.
A weekly monitoring process can include recording the following information:
- Search visibility: Track product positions for predefined brand and category search terms.
- Product availability: Record whether products are listed, available, unavailable, or temporarily missing.
- Content quality: Review titles, product images, descriptions, specifications, and pack-size information.
- Price competitiveness: Compare MRP, selling prices, discounts, and equivalent competitor products.
- Customer feedback: Monitor ratings, review counts, and changes in customer sentiment where displayed.
- Promotional exposure: Record visible offers, banners, sponsored placements, and discount campaigns.
- Delivery experience: Compare displayed delivery estimates and applicable delivery charges.
These indicators should be recorded consistently. A product's ranking at one location should not automatically be compared with its ranking at another location without accounting for differences in search conditions.
The following framework can help brands organize their weekly reporting:
| KPI | Weekly observation | What it reveals |
|---|
| Search position | Position for defined keywords | Product discoverability |
| Availability rate | Available observations divided by total valid observations | Listing availability |
| Content compliance | Listings meeting defined content standards | Product information quality |
| Price index | Brand price compared with equivalent competitor prices | Price competitiveness |
| Rating movement | Changes in displayed average ratings | Customer feedback trends |
| Delivery estimate | Displayed arrival-time estimate | Customer-facing fulfilment promise |
| Delivery charge | Applicable delivery fee and conditions | Additional purchase cost |
The availability rate and price index in this table are proposed measurement formulas, not published industry benchmarks. Brands should define their own calculation rules and maintain consistent observation conditions.
Historical industry developments reinforce the need for this approach. Bain and Flipkart reported that annual quick commerce shoppers in India exceeded 20 million in 2024, while the sector accounted for approximately one-tenth of total e-retail GMV.
Weekly reports can also include exception-based alerts. For instance, businesses can flag products that disappear from search results, experience unexpected price changes, or remain unavailable across consecutive observations. This allows teams to prioritize operational problems instead of manually reviewing every product.
How Can Brands Evaluate Their Competitive Position Across Digital Shelves?
Quick commerce competition involves more than comparing product prices. Brands must understand how much visibility they receive within relevant categories, which competitors dominate search results, and whether their product assortment adequately covers customer requirements.
Quick Commerce Brand Share of Search Monitoring helps businesses compare their search presence with other brands using predefined search terms and observation rules. This measurement can reveal whether a brand is gaining or losing visibility within important product categories.
For example, a packaged-food manufacturer can monitor searches for breakfast cereals, biscuits, and healthy snacks. Its reporting team can record the number of relevant search observations in which the brand appears and compare this with competitor appearances.
A consistent share-of-search methodology could use the following calculation:
{Brand Share of Search} = {Brand search appearances} {Total brand and competitor appearances} imes 100
This is an operational measurement formula. Brands must define how sponsored and organic placements, repeated products, locations, and search terms are counted before calculating the metric.
Competitive monitoring should also cover product assortment. If competing brands introduce additional pack sizes, flavours, or product variants, businesses can identify changes in the category landscape and review potential assortment gaps.
The commercial importance of these decisions is visible in published FMCG industry figures. According to IBEF's May 2025 report, HUL recorded ₹1,214 crore in quick commerce sales during FY25, while Britannia recorded approximately ₹675 crore. Tata Consumer Products reported ₹900 crore in quick commerce sales, representing 7% of its domestic sales.
These figures demonstrate why brands need to evaluate their competitive position through multiple indicators instead of relying only on overall revenue.
| Competitive indicator | Data to compare | Decision supported |
|---|
| Brand search presence | Appearances across priority search terms | Visibility strategy |
| Competitor assortment | SKUs, variants, and pack sizes | Assortment planning |
| Price positioning | Comparable product prices | Pricing decisions |
| Promotional activity | Discounts and special offers | Campaign planning |
| Product ratings | Displayed ratings and reviews | Product improvement |
| Availability | In-stock status across locations | Distribution planning |
A useful competitive dashboard should separate direct competitors from broader category alternatives. It should also identify products that compete for similar customer needs even when their pack sizes or positioning differ.
By reviewing these indicators weekly, businesses can identify emerging competitors, understand promotional pressure, and prioritize products that need better listing quality or stronger distribution coverage.
How Can Businesses Turn Marketplace Intelligence Into Better Brand Decisions?
Collecting marketplace information is only the first step. Brands need to convert that information into practical decisions involving pricing, distribution, promotions, product content, and category strategy.
Quick Commerce Brand Shelf Share Intelligence helps businesses evaluate how much digital shelf presence they achieve compared with competing brands. It combines product availability, search visibility, assortment coverage, promotional placements, and listing quality to create a broader view of competitive performance.
Digital Shelf Analytics for Quick Commerce can support this process by bringing product-level observations together in structured dashboards. Businesses can review changes across platforms, locations, and reporting periods rather than depending on disconnected screenshots or manual spreadsheets.
For example, if a brand experiences declining search visibility, the team can investigate whether competing products have gained better placements, whether the brand's listing has changed, or whether inventory availability has affected discoverability. Each possibility requires a different response.
The wider market is also expanding beyond traditional grocery purchases. NielsenIQ's 2026 commerce research identifies growing engagement in beauty and home-care categories, while Bain and Flipkart's 2025 report highlights quick commerce as one of the major developments reshaping Indian retail.
Businesses can organize these insights through a practical reporting framework:
| Business objective | Data requirement | Recommended decision |
|---|
| Improve visibility | Search rankings and share of search | Review product discovery strategy |
| Reduce availability gaps | SKU-level stock observations | Coordinate replenishment |
| Strengthen pricing | Selling prices and discounts | Reassess competitive positioning |
| Improve listings | Product titles, images, descriptions | Correct content inconsistencies |
| Evaluate promotions | Discount and placement records | Review campaign effectiveness |
| Improve customer experience | Ratings and delivery estimates | Investigate customer-facing issues |
A reliable reporting process should also include data validation. Product names, pack sizes, brand identifiers, and variants need to be standardized before comparisons are made. Otherwise, similar products may be counted incorrectly or unrelated SKUs may be compared.
For stronger decision-making, brands should connect external marketplace observations with their own sales and inventory information wherever appropriate and authorized. This makes it easier to distinguish between a visibility issue and an underlying supply problem.
The most effective approach is to create a weekly reporting cycle with defined KPIs, consistent collection conditions, exception alerts, and clear ownership across marketing, category management, and sales teams. This transforms marketplace monitoring into a repeatable business intelligence process.
Why Choose Product Data Scrape?
Product Data Scrape helps businesses turn complex marketplace information into structured datasets for better commercial decision-making. Its Digital Shelf Analytics approach focuses on collecting and organizing relevant product information, including prices, availability, ratings, search visibility, competitor listings, and promotional changes. Businesses can use these insights to evaluate performance across multiple quick commerce platforms and locations. With Digital Shelf Analytics for Quick Commerce, brands can identify listing inconsistencies, monitor competitive movements, and review weekly KPI trends. Structured data also supports reporting, assortment evaluation, and pricing analysis. Consistent monitoring helps businesses make informed decisions and improve their online retail strategies.
Conclusion
Quick commerce is creating new opportunities for FMCG brands, but maintaining strong product visibility requires consistent marketplace monitoring. Q-Commerce data scraping helps businesses collect product prices, availability, search rankings, competitor information, and promotional data across platforms. By combining these insights with weekly KPI reporting, companies can identify performance gaps, improve product listings, and strengthen competitive positioning. Digital Shelf Analytics for Quick Commerce makes it easier to understand changing marketplace conditions and support informed business decisions.
Want to improve your marketplace visibility and competitive performance? Contact Product Data Scrape today to explore customized data collection and analytics solutions for your business!
FAQs
1. What is digital shelf analytics in quick commerce?
It involves monitoring product listings, prices, availability, search rankings, ratings, and promotional placements across quick commerce platforms to evaluate brand performance and product discoverability.
2. Why should brands track quick commerce KPIs weekly?
Weekly monitoring helps businesses identify product availability gaps, changing competitor prices, declining search visibility, and listing inconsistencies before they affect marketplace performance.
3. Which KPIs are important for quick commerce brands?
Important KPIs include product availability, search rankings, share of search, selling prices, discounts, ratings, product content accuracy, and displayed delivery estimates.
4. How can Product Data Scrape support digital shelf monitoring?
Product Data Scrape can help businesses collect structured marketplace information for competitor analysis, product availability monitoring, pricing comparisons, and performance reporting across online retail platforms.
5. How does competitor monitoring improve quick commerce performance?
Competitor monitoring reveals pricing differences, assortment changes, promotional activities, and search visibility gaps, helping brands refine product positioning and make better commercial decisions.


 Singapore
 EMAIL
 PHONE











.webp)