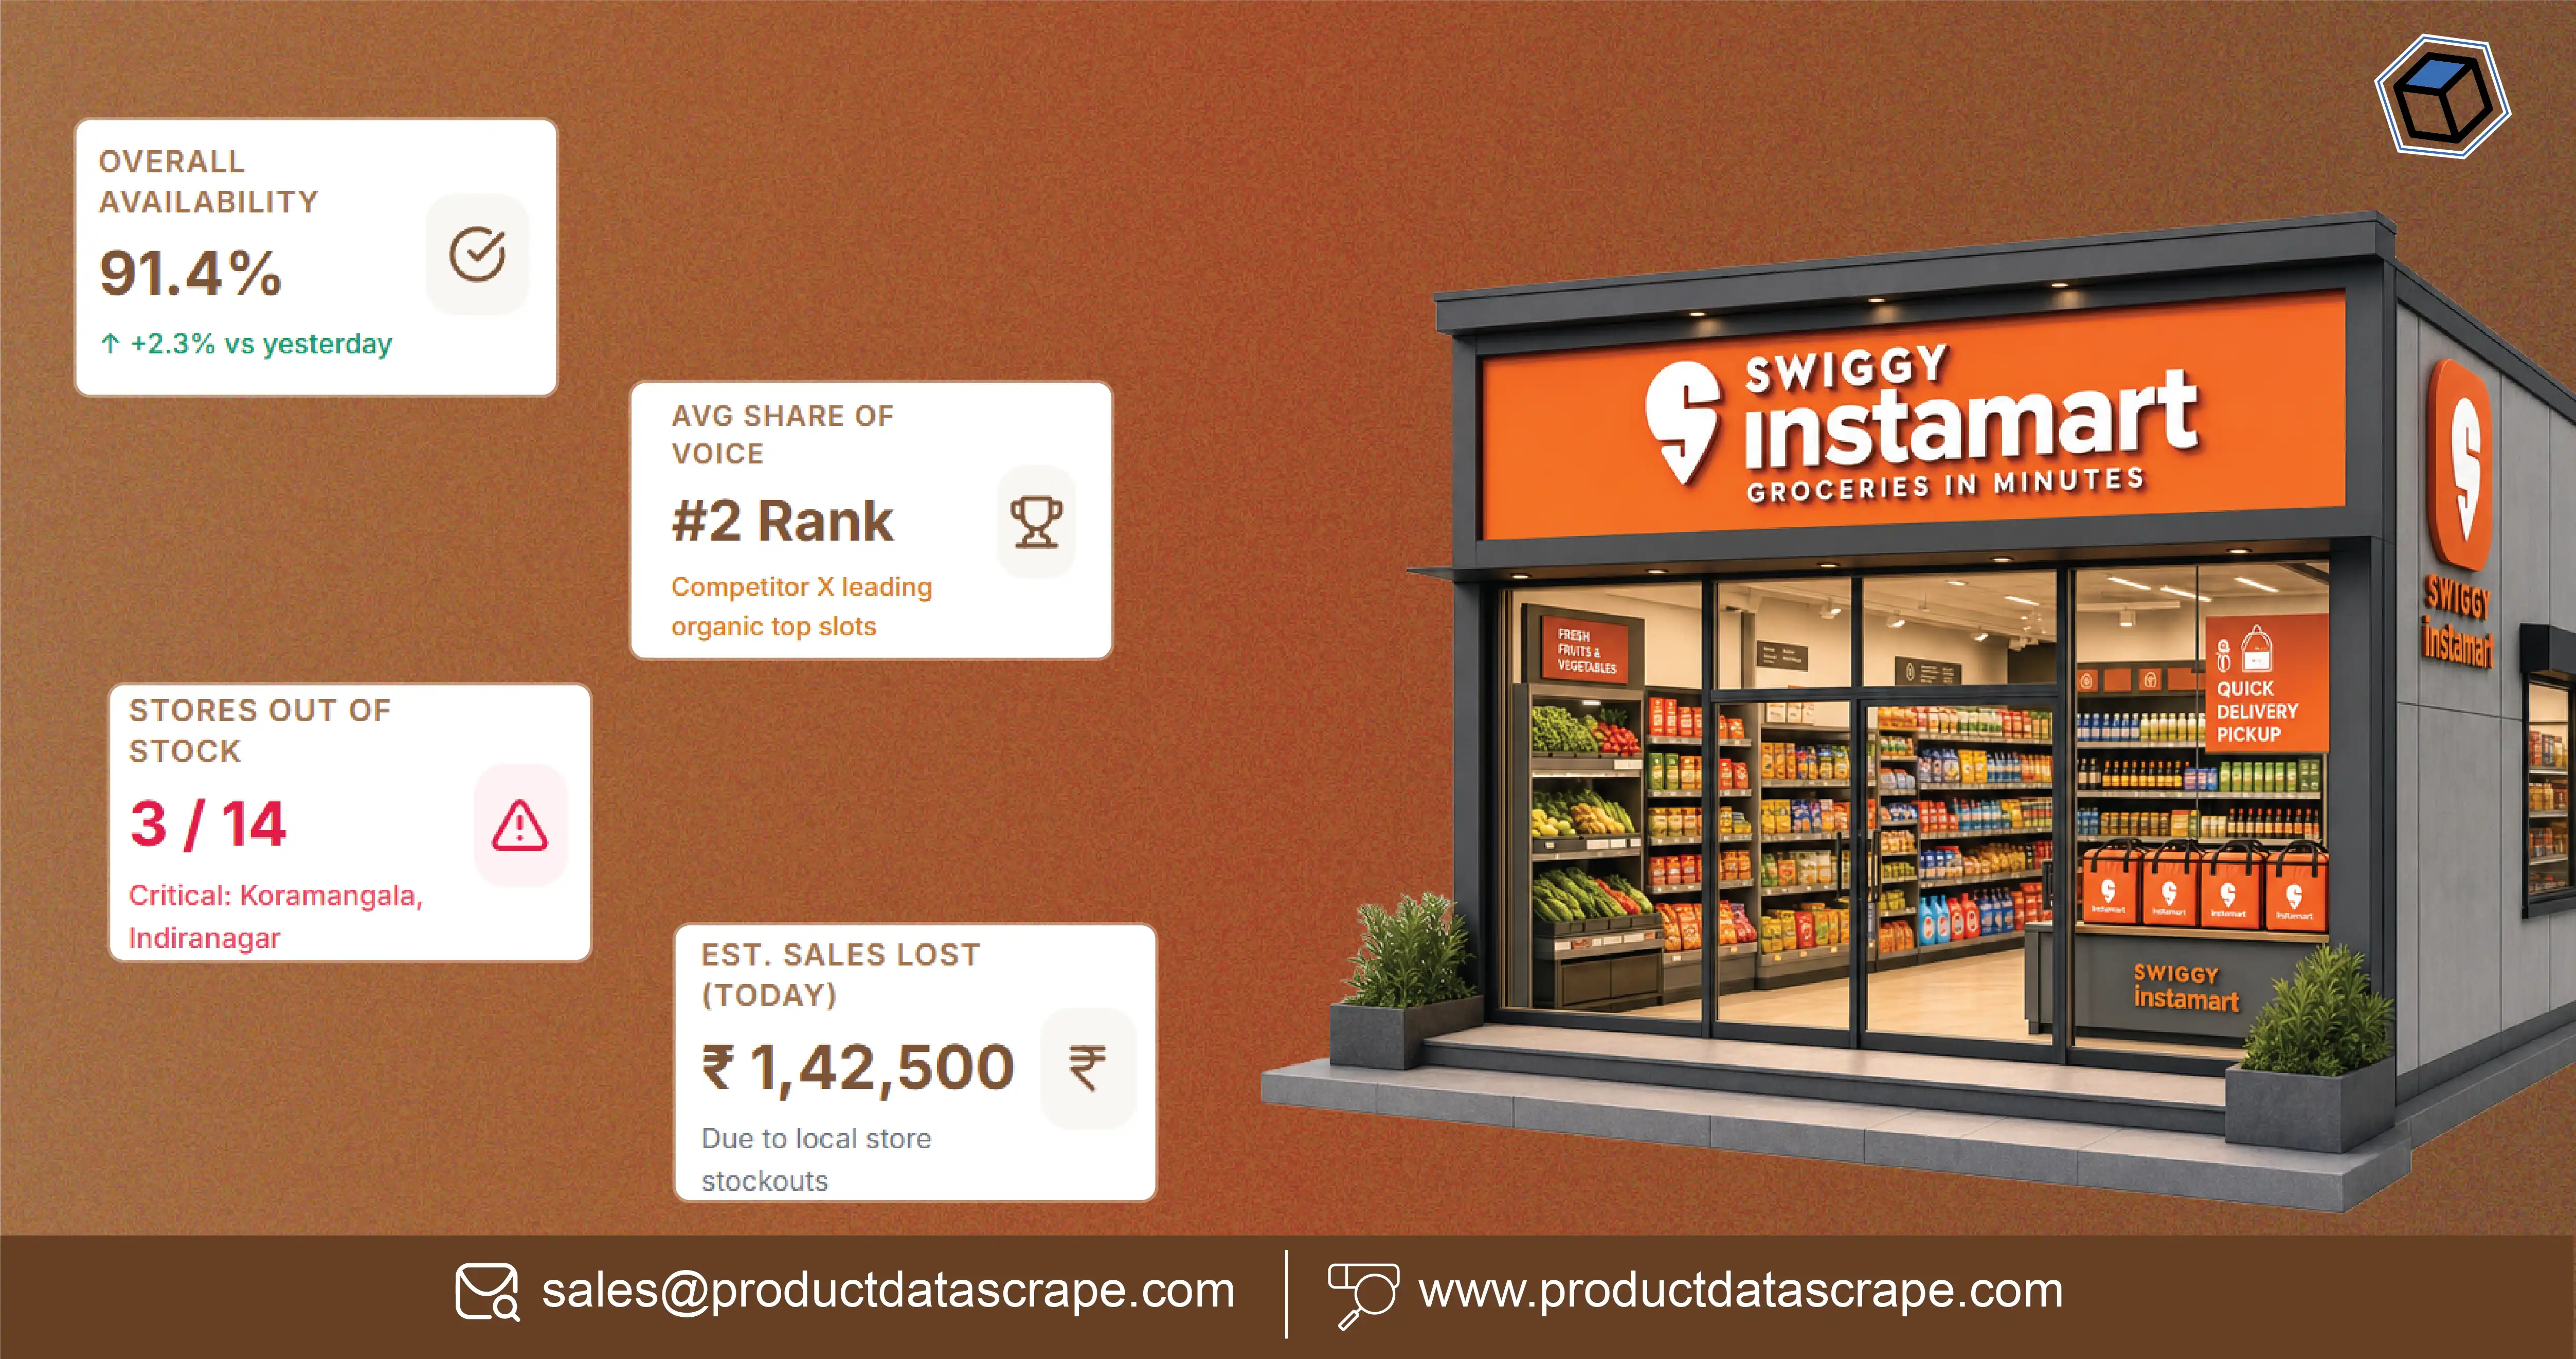
Introduction
Brands need accurate, location-specific quick-commerce intelligence to understand why product prices, stock availability, discounts, and delivery estimates differ between stores. By collecting store-level information using pincodes and geo-location identifiers, businesses can compare local assortments, identify stockout patterns, and improve competitive pricing decisions. Scrape Swiggy Instamart Data by Store helps retailers, FMCG companies, distributors, and market researchers organize these insights into structured datasets for location-based analysis.
Swiggy Instamart operates in India's quick-commerce market, where product discovery and fulfilment are closely connected to the customer's delivery location. Consequently, a product visible in one service area may not necessarily be available in another. Brands need to examine store-level product listings alongside delivery fees and estimated delivery times to understand the complete shopping experience.
This blog explains how businesses can approach store-level data collection, compare pricing across pincodes, monitor inventory changes, and use geo-location intelligence to make better retail decisions. It also explores how Product Data Scrape can support structured data collection and market monitoring.
How Can Brands Compare Prices Across Different Service Areas?
Pricing intelligence is essential for FMCG brands, grocery manufacturers, and online retailers competing in India's quick-commerce ecosystem. Product prices, promotional offers, and shopping costs can vary according to the selected delivery location and applicable platform charges. A structured Swiggy Instamart Hyperlocal Pricing Dataset allows businesses to examine these differences across serviceable locations and product categories.
Brands can collect product names, brand names, pack sizes, MRP, displayed selling prices, discounts, and promotional labels wherever these fields are publicly visible. Combining these details with Geo and store-level pricing data helps analysts distinguish between product-level price changes and location-specific differences. For example, a price comparison should match identical brands, variants, and pack sizes rather than treating differently sized products as equivalent.
Delivery fee and time tracking should also form part of the analysis. Swiggy Instamart's terms explain that delivery charges can depend on distance, delivery time, demand, traffic, weather, and seasonal conditions. Additional charges may include handling, convenience, packaging, platform, and surge fees. Therefore, brands should distinguish product prices from checkout charges instead of comparing only the displayed selling price.
The following table provides verified historical business context for planning location-level analysis.
| Financial year | Active dark stores |
|---|
| FY2020 | Instamart launched |
| FY2021 | 12 (April 1, 2021) |
| FY2022 | 301 |
| FY2023 | 421 |
| FY2024 | 523 |
| FY2025 | 1,021 |
| FY2026 | 1,143 |
Source: Swiggy's prospectus, FY2024–25 annual report and FY2025–26 annual report. Figures are company-reported store counts, not scraped product records.
swiggy.webenza.in+2
This expansion demonstrates why store-level comparisons matter. Brands can use recurring observations to identify pricing differences, evaluate promotional consistency, and understand how local fulfilment networks influence product competitiveness.
How Does Location-Based Collection Improve Retail Intelligence?
Location is a critical factor in quick-commerce research because the platform serves customers through a network of local fulfilment facilities. A customer entering a different delivery address may encounter a different selection of products, prices, and delivery estimates. Consequently, businesses need to organize observations around geographic coverage rather than treating the platform as one nationwide product catalogue.
Swiggy Instamart Geo-Location Data Extraction involves collecting permitted, publicly displayed location-related information associated with a delivery area. Relevant fields can include city, locality, pincode, serviceability status, store identifier where exposed, and observation timestamp. These fields help researchers organize product information by geographic market and compare changes over time.
A well-designed Swiggy Instamart Data Scraping API workflow can standardize collection and deliver structured records to business intelligence systems. For example, a company can maintain separate datasets for product listings, pricing, inventory status, promotional information, and delivery estimates. Each record should retain its location reference and collection timestamp so analysts can distinguish current observations from historical records.
The process should follow a consistent sequence:
- Location identification: Define the cities, localities, and pincodes included in the research.
- Serviceability validation: Record whether the selected delivery area is supported.
- Store association: Connect observations to a verified store identifier when that information is available.
- Product collection: Capture publicly visible product names, categories, variants, and prices.
- Data standardization: Normalize product names, measurement units, and brand information.
- Historical storage: Preserve timestamps to support trend analysis and auditing.
Swiggy's FY2025 annual report reported expansion to 124 cities and 1,021 active dark stores. Its FY2026 annual report reported 1,143 active dark stores across more than 125 cities. These company-reported figures illustrate the growing geographic scope of the network.
For brands, the practical benefit is better market segmentation. A national average may hide local availability gaps or price differences. Geographic records make it easier to identify where a product is visible, where its listing disappears, and where additional distribution or promotional attention may be required.
How Can Businesses Identify Product Availability Changes?
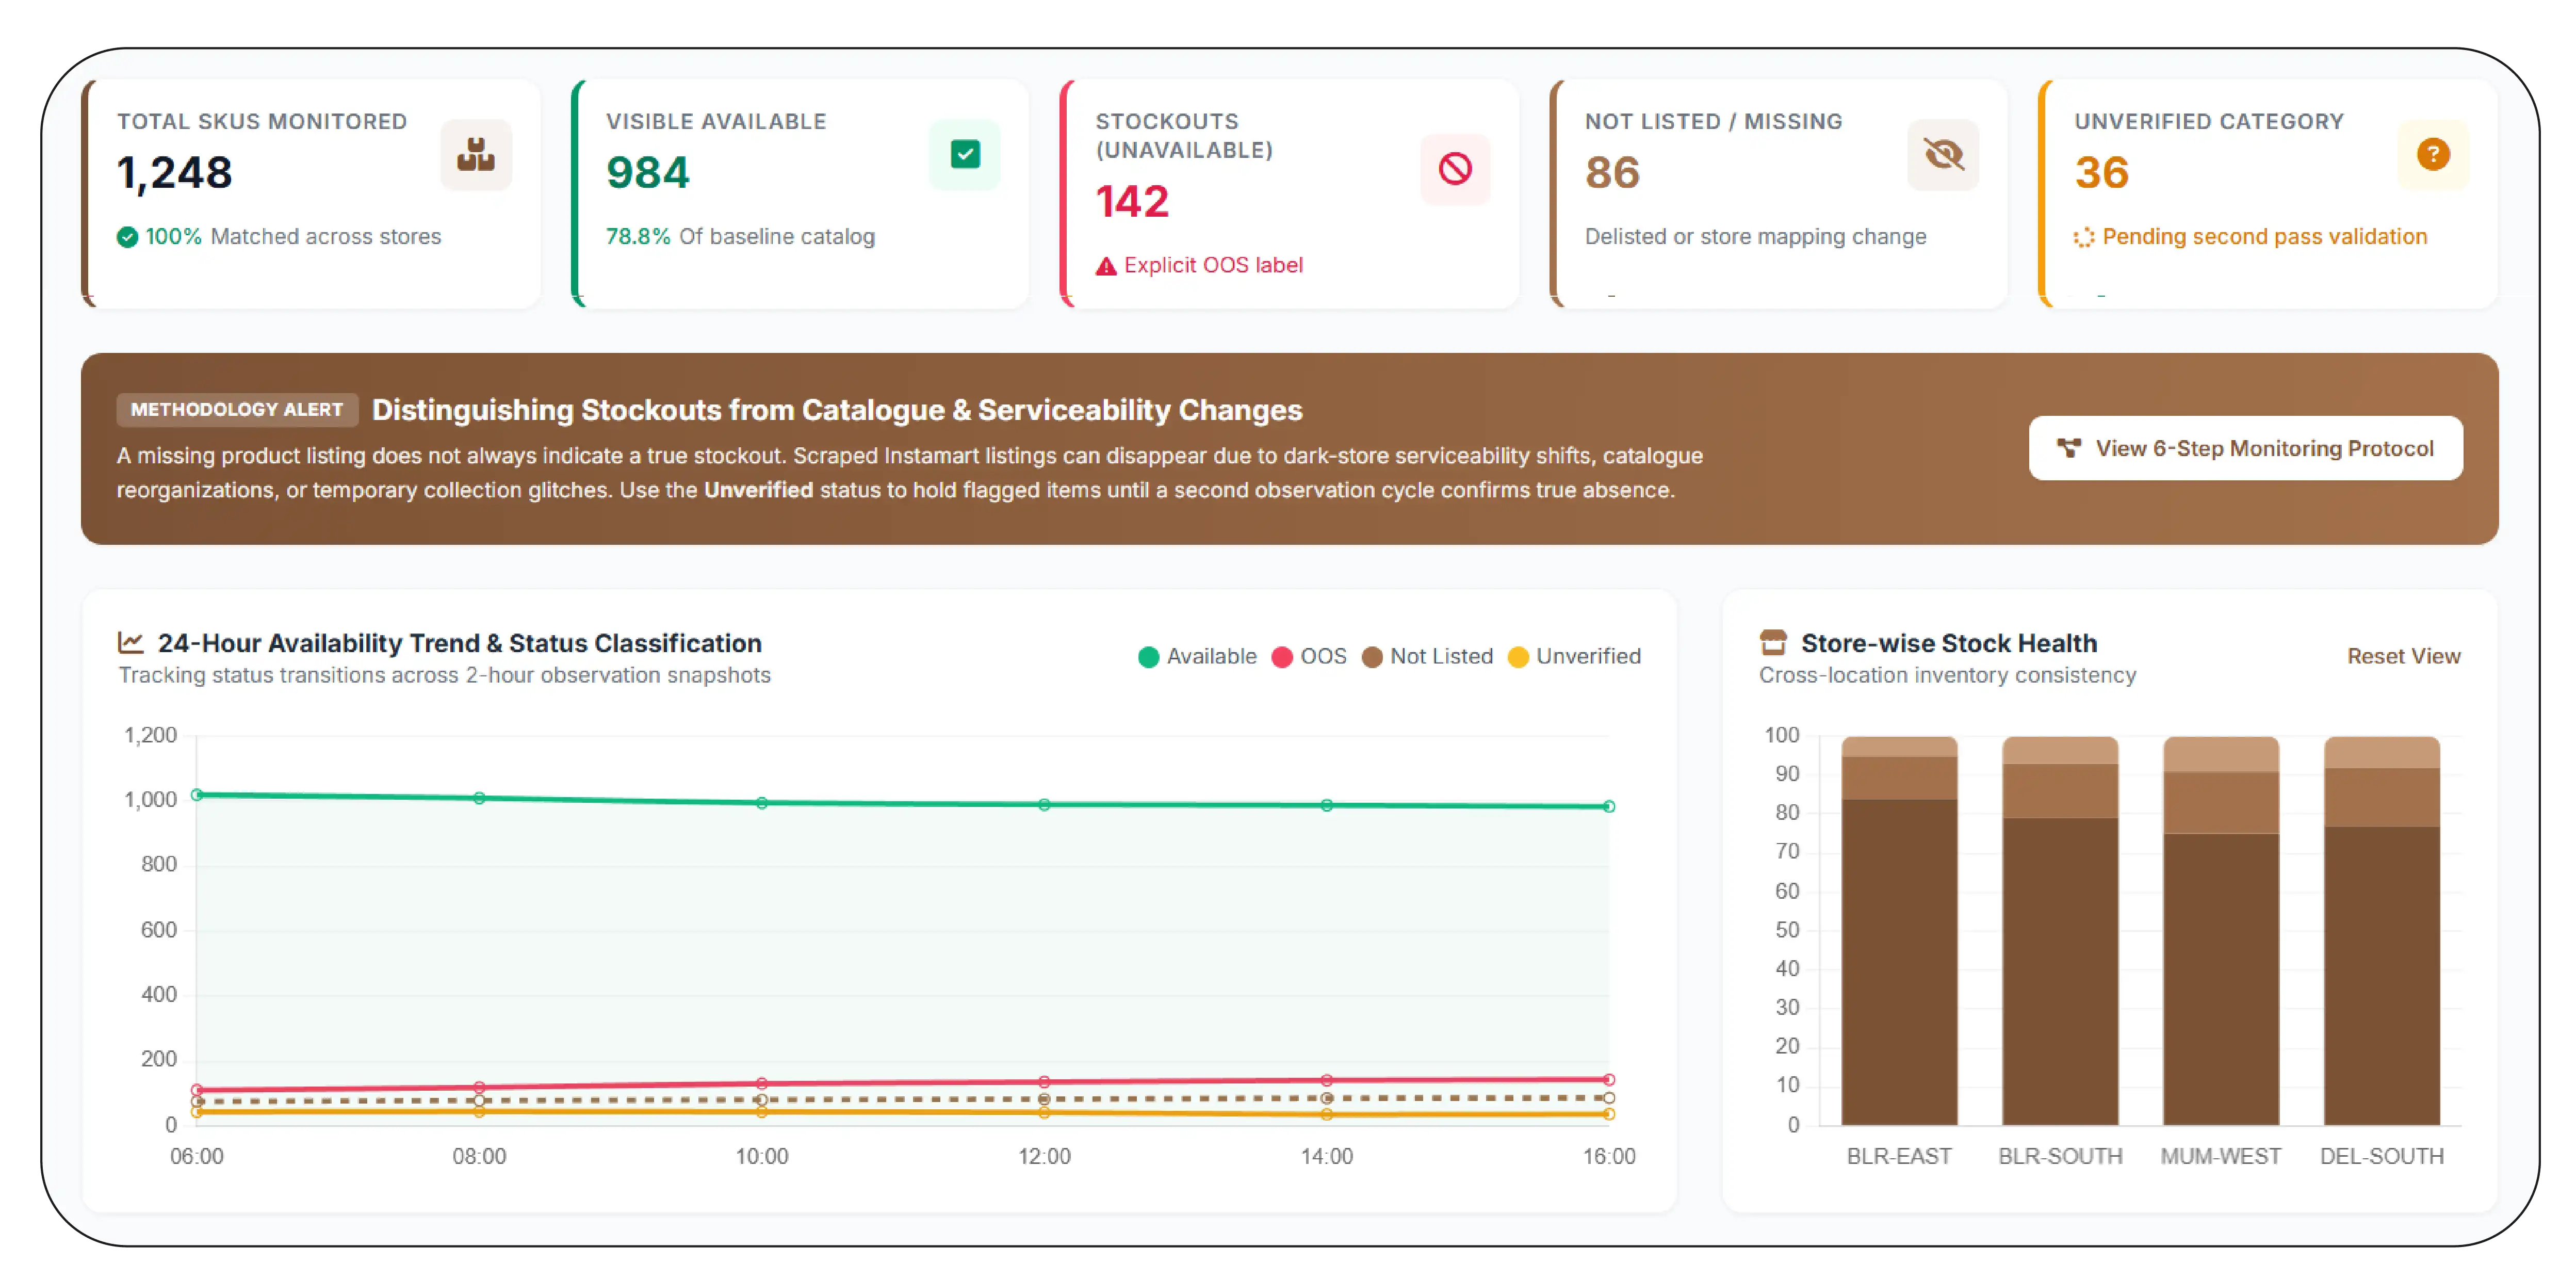
Product availability is a major consideration for brands selling through quick-commerce platforms. A product that appears in a listing during one observation may become unavailable later. Similarly, a listing may disappear because of a serviceability change, catalogue update, or temporary inventory issue. Businesses should distinguish these conditions before interpreting missing records as stockouts.
Instamart Product Stock Tracking Across Locations helps companies monitor visible availability indicators across selected delivery areas. A structured dataset can contain product identifiers, product names, variants, displayed availability labels, prices, store references, and timestamps. Repeated observations make it possible to identify changes in the displayed status without assuming access to Swiggy's internal inventory systems.
For this purpose, Scrape Swiggy Instamart Data by Store should involve consistent product matching and location validation. Brands should compare the same SKU or equivalent product variant across locations rather than relying on similar product names. Pack size, quantity, flavour, and brand identifiers can prevent incorrect comparisons.
A practical monitoring process includes:
- Establish a baseline of products visible in each selected service area.
- Collect subsequent observations at consistent intervals.
- Compare current listings with previous records.
- Classify products as available, unavailable, not listed, or unverified.
- Flag repeated availability changes for further investigation.
- Maintain a timestamped history for reporting.
| Monitoring field | Business application |
|---|
| Product identifier | Matches the same SKU across observations |
| Store or location reference | Organizes records geographically |
| Availability status | Identifies visible listing changes |
| Selling price | Supports price comparisons |
| Discount information | Tracks promotional changes |
| Timestamp | Establishes when the observation occurred |
| Product variant | Prevents mismatched comparisons |
The distinction between unavailable and not listed is particularly important. If a product disappears from a page, the reason may not be a stockout. It could reflect a catalogue change, a different location selection, or an issue with the collection process. A reliable monitoring system should therefore use an unverified category until the observation is checked again.
For FMCG manufacturers and distributors, this information supports more informed conversations about product distribution, local assortment, and retail execution. It also helps identify recurring visibility problems that deserve investigation.
What Information Should Brands Collect From Individual Store Listings?
Store-level product information becomes more valuable when it is collected in a consistent format. A catalogue containing thousands of product records is difficult to analyze if brand names, product variants, pack sizes, and pricing fields are inconsistent. Standardization allows companies to compare similar products across locations and identify meaningful changes.
Instamart Store-Wise Product Listing Extraction can cover publicly visible catalogue attributes such as product title, brand, category, variant, pack size, selling price, MRP, discount label, and availability indicator. Where available, product images and listing references can also support product identification and catalogue matching.
Brands should organize the information into separate but connected datasets. Product master records can store relatively stable attributes, while location-level observations can store changing prices, availability, and delivery information. This separation avoids creating multiple conflicting product identities when the same SKU appears in different service areas.
A useful structure includes:
| Dataset | Recommended fields |
|---|
| Product master | SKU, brand, title, category, variant |
| Pack information | Quantity, unit, pack size |
| Store information | Store reference, city, locality |
| Pricing | MRP, selling price, discount |
| Availability | Displayed status, observation date |
| Delivery | Estimated time, applicable charges |
| History | Previous value, current value, timestamp |
Consider the difference between two records for the same brand. One may represent a 500 ml product and another a 1 litre variant. Comparing their selling prices without normalizing the quantity would create misleading conclusions. Unit-price calculations, where sufficient information is available, provide a more meaningful comparison.
Product matching should also account for spelling variations, abbreviations, punctuation, and changing catalogue titles. Exact SKU or barcode matching is preferable when available. When those identifiers are absent, analysts can use brand, variant, pack size, and product attributes together, while retaining a confidence indicator.
The objective is not simply to collect more listings. It is to create a dependable product catalogue that connects every observation to the right product and location. This improves reporting accuracy and makes historical comparisons more useful for category managers, pricing teams, and retail strategy professionals.
How Can Companies Monitor Differences Between Cities and Pincodes?
Quick-commerce performance can differ between local markets because service coverage, product assortment, fulfilment capacity, and customer demand are not identical everywhere. Brands that rely only on city-level information may overlook differences between individual service areas.
Swiggy Instamart City and Pincode Data Monitoring helps businesses organize observations across geographic segments. Companies can compare the same product category across selected pincodes and identify where listings, discounts, and availability indicators differ. This is particularly useful for brands distributing products across multiple cities or evaluating expansion opportunities.
A systematic approach to Scrape Swiggy Instamart Data by Store should preserve the relationship between a product record and its observed delivery location. Pincode alone should not automatically be treated as a unique store identifier. Multiple service areas may be associated with different fulfilment arrangements, while a single store may serve multiple nearby locations. Analysts should retain a separate store reference only when it is reliably exposed or independently verified.
Swiggy's FY2025 annual report recorded 124 cities and 1,021 active dark stores. By FY2026, its reported network had reached 1,143 active dark stores across more than 125 cities. This expansion makes geographic segmentation increasingly relevant for businesses studying assortment and retail competition.
Brands can use a location comparison framework:
| Comparison dimension | What businesses can identify |
|---|
| City | Differences in broad market coverage |
| Pincode | Local serviceability and listing variations |
| Store reference | Store-associated product assortment |
| Product category | Differences in local selection |
| Price | Geographic selling-price variations |
| Availability | Repeated visible stock-status changes |
| Delivery estimate | Differences in displayed fulfilment times |
For actionable reporting, businesses should classify locations into consistent groups, such as metro markets, developing urban markets, and smaller serviceable cities. They can then compare product visibility and pricing within similar market groups.
The most important step is maintaining a historical record. A single collection provides a snapshot, but repeated observations reveal whether a product is consistently available, temporarily unavailable, or subject to frequent listing changes. Brands can use these findings to prioritize distribution discussions, review local promotions, and improve their understanding of regional retail performance.
How Can Automated Collection Support Continuous Market Research?
Manual collection becomes difficult when businesses need to monitor multiple product categories, locations, and changing retail conditions. Repeatedly checking individual listings also makes it harder to maintain consistent timestamps, compare historical records, and identify changes quickly.
A structured Swiggy Instamart scraper workflow can organize publicly accessible information into repeatable collection and validation processes. The workflow should begin with a defined research scope, including approved locations, product categories, relevant fields, and collection frequency.
Automation can support several important activities. First, scheduled collection can capture product information at consistent intervals. Second, product matching can connect new observations with existing records. Third, validation rules can identify missing prices, unusual values, duplicate products, and incomplete location information. Finally, structured outputs can be delivered to databases, spreadsheets, dashboards, or other business intelligence environments.
The following table outlines a practical implementation framework.
| Workflow stage | Activity | Business outcome |
|---|
| Planning | Define locations and product categories | Clear research coverage |
| Collection | Gather permitted listing information | Structured observations |
| Validation | Check missing and inconsistent fields | Better data quality |
| Matching | Connect records to product identities | Reliable comparisons |
| Monitoring | Compare successive observations | Change detection |
| Reporting | Create location-level dashboards | Actionable insights |
Historical market context also demonstrates the scale of the opportunity. According to Reuters' coverage of the Bain and Flipkart report, India's quick-commerce sector accounted for more than two-thirds of e-grocery orders in 2024. Its market value was estimated at approximately $6–7 billion, around five times its 2022 level. These are sector-wide figures, not Swiggy-specific performance statistics.
Automation should not be confused with unrestricted access to platform information. Businesses should use authorized collection methods, respect applicable terms and privacy requirements, avoid bypassing access controls, and apply reasonable collection limits. A scraper should also distinguish between information that is genuinely unavailable and information that could not be collected during a particular run.
The result is a more organized research process. Instead of maintaining disconnected screenshots or manually prepared price lists, brands can use timestamped records to understand product visibility, local pricing, and changes in the quick-commerce marketplace.
Why Should Businesses Invest in Better Store-Level Data Quality?
Accurate data is essential when businesses make decisions about pricing, distribution, and product availability. Product Data Scrape helps companies organize permitted retail information into structured datasets that support consistent analysis.
A key application is Stockout Monitoring, which helps brands identify repeated changes in publicly displayed product availability across selected locations. Businesses can also compare product prices, discounts, pack sizes, and listing visibility without confusing missing records with confirmed inventory shortages.
Reliable data validation, product matching, location tagging, and historical tracking make these insights more useful. A Swiggy Instamart Data Scraping API can help businesses organize permitted marketplace observations into structured datasets for consistent analysis. Brands can also incorporate Delivery fee & time tracking to compare location-specific delivery estimates and applicable charges. These insights help prioritize distribution reviews, understand regional assortment differences, evaluate competitive positioning, and turn fragmented marketplace observations into organized information that supports practical retail decisions.
Conclusion
Store-level quick-commerce intelligence helps brands understand how product availability, pricing, and delivery conditions differ across local markets. A reliable Swiggy Instamart Product Dataset should connect product identifiers, store references, pincodes, geo-location details, pricing information, and historical availability observations. Businesses can use these records to identify regional assortment gaps, evaluate promotional activity, and improve competitive monitoring.
With structured collection, validation, and reporting, Scrape Swiggy Instamart Data by Store becomes a valuable approach to location-based retail research.
Want to improve your quick-commerce market intelligence? Contact Product Data Scrape today to discuss customized data collection, store-level datasets, and location-based product monitoring solutions.
FAQs
1. Why do brands collect store-level quick-commerce data?
Brands collect store-level data to compare local prices, product assortment, promotional activity, and availability across serviceable locations and improve regional retail decisions.
2. Can product availability differ between pincodes?
Yes. Product visibility and serviceability can differ by delivery location because fulfilment coverage, local assortment, and inventory conditions may vary.
3. Which information is useful for location-based product monitoring?
Useful fields include product names, brands, pack sizes, prices, discounts, availability indicators, store references, pincodes, and observation timestamps.
4. How frequently should businesses monitor product listings?
Monitoring frequency depends on business requirements, product volatility, and collection permissions. Consistent scheduled observations help identify meaningful changes and maintain historical comparisons.
5. How can Product Data Scrape support this research?
Product Data Scrape can help businesses structure permitted marketplace observations into organized datasets for pricing analysis, product availability monitoring, geographic comparisons, and competitive intelligence.


 Singapore
 EMAIL
 PHONE










.webp)