Introduction
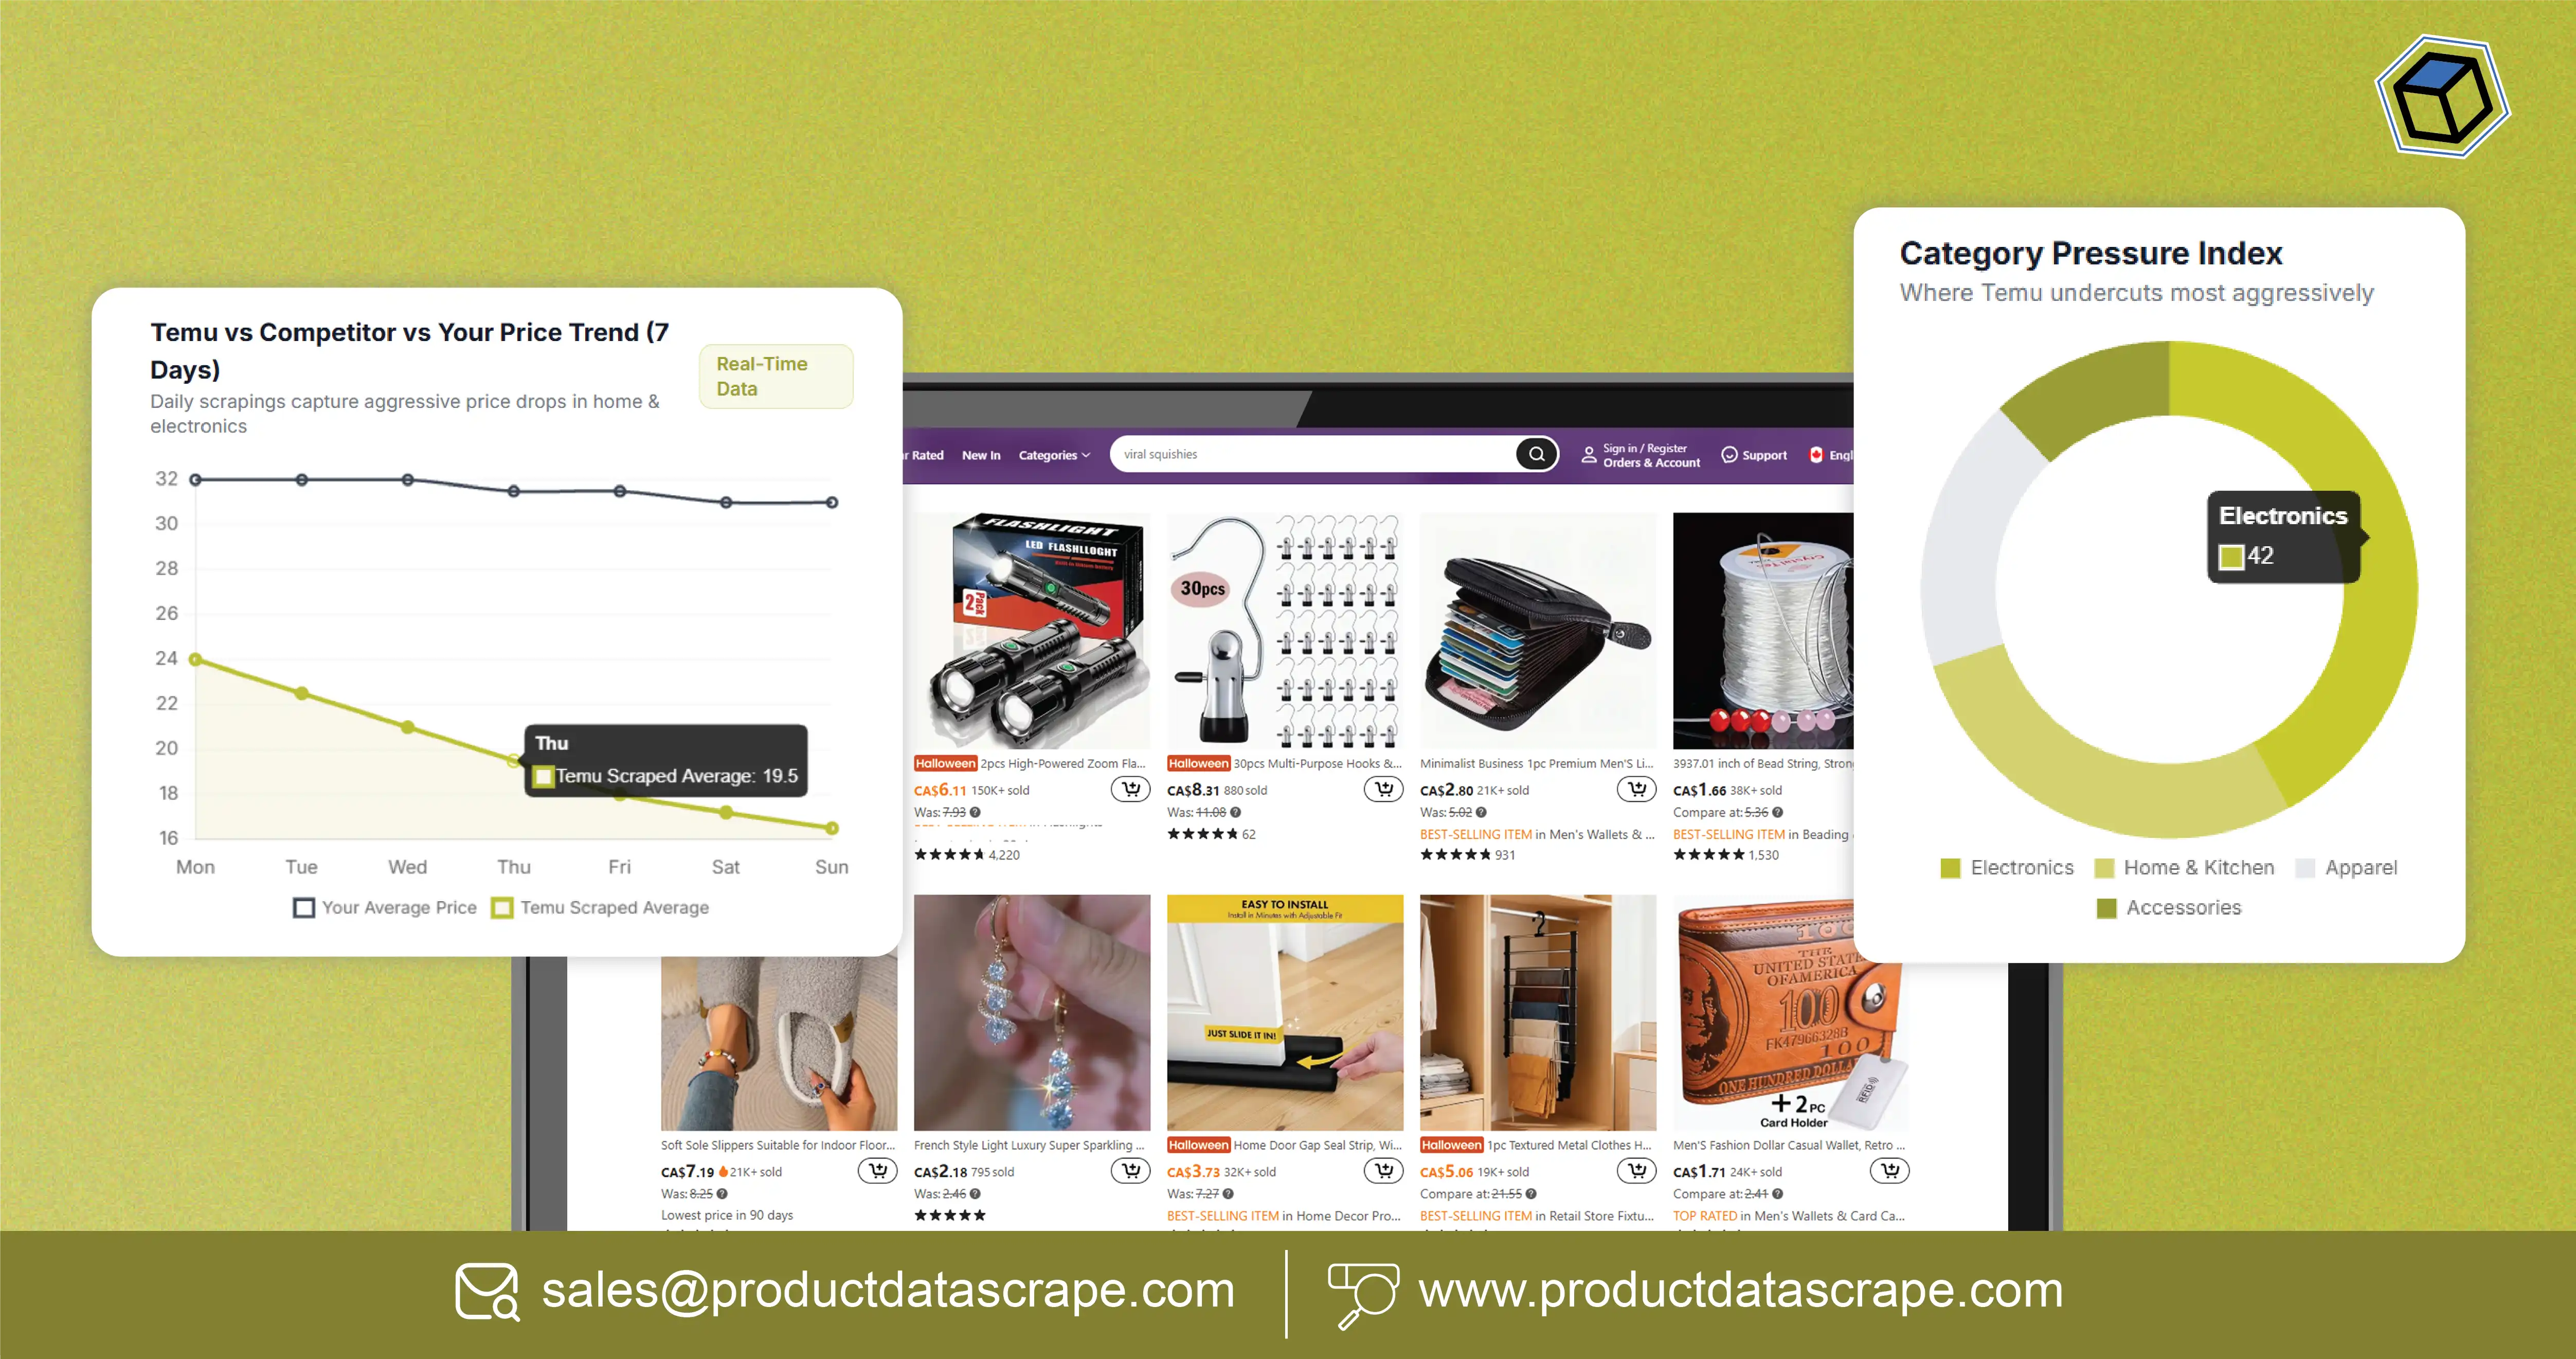
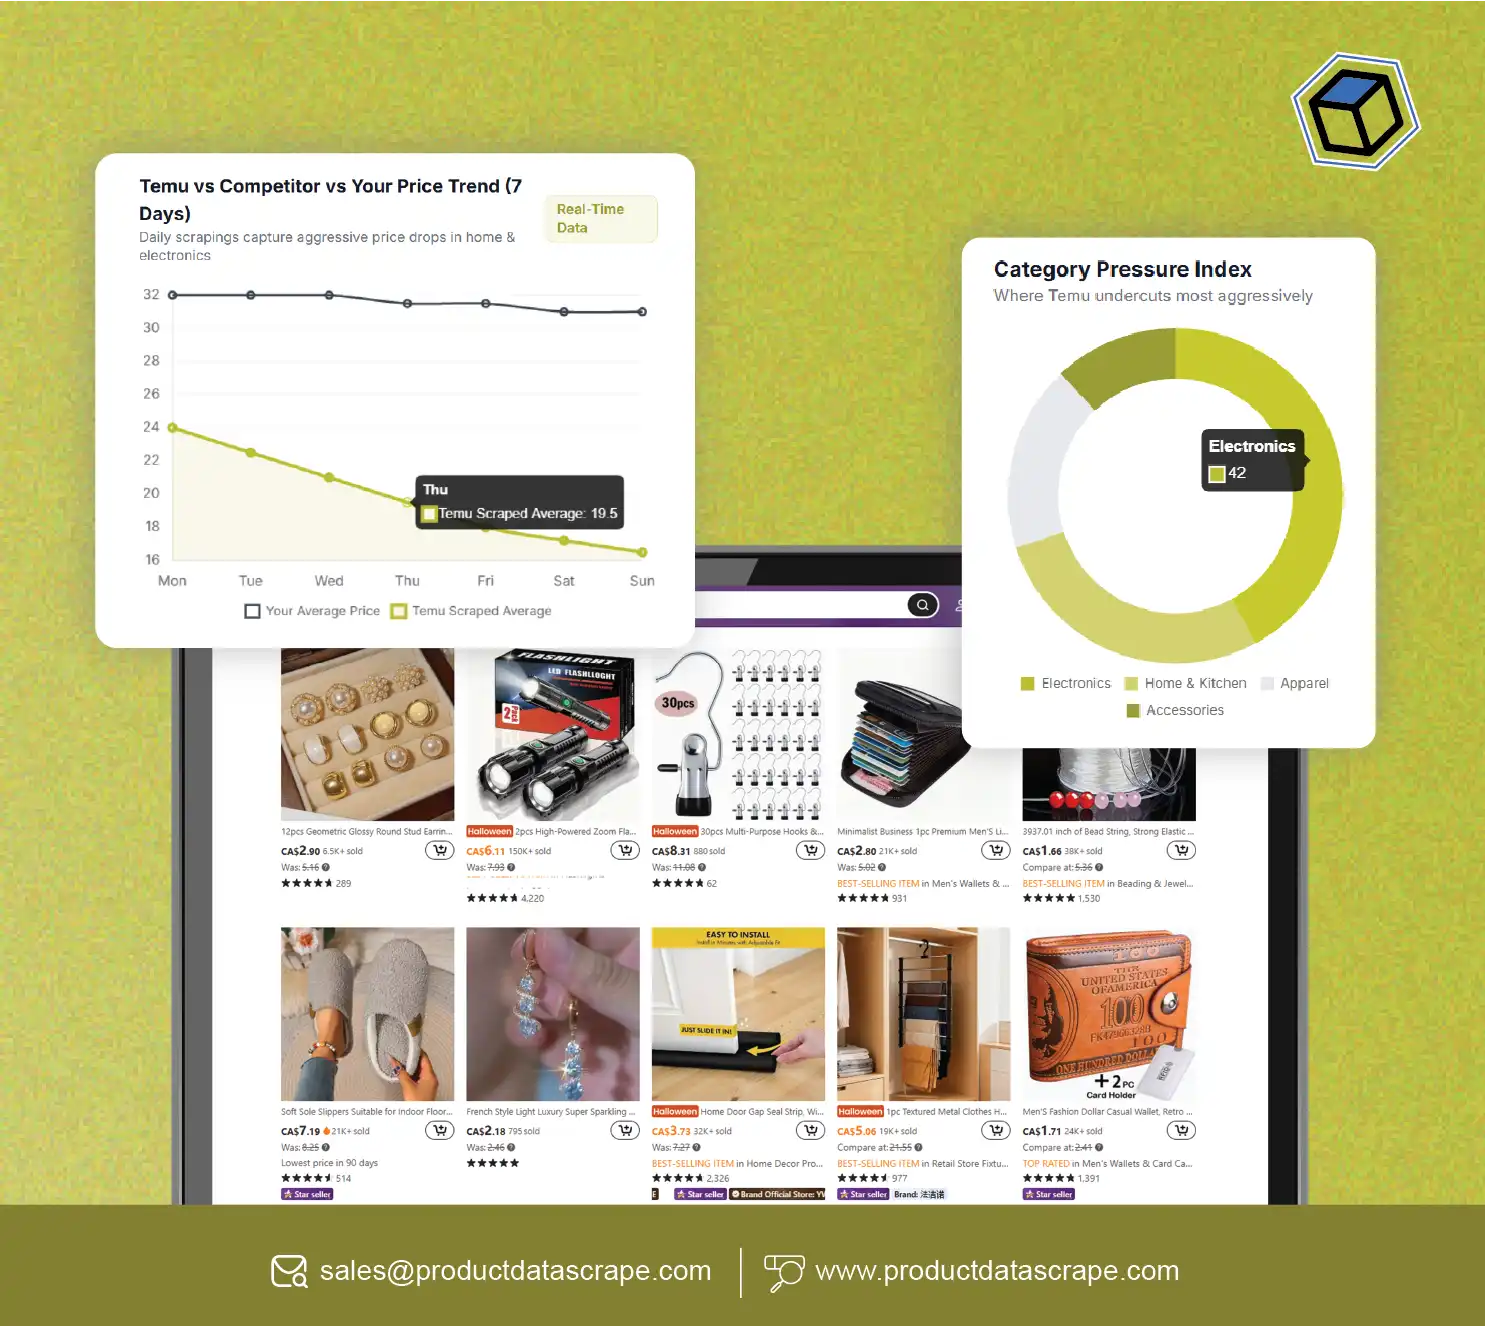
Daily Temu price Data scraping helps retailers monitor product prices, discounts, variants, and availability frequently enough to detect competitive movements before they affect margins. For pricing teams, the core value is simple: convert changing marketplace data into structured signals that support faster price benchmarking, promotion analysis, and assortment decisions.
Temu launched in September 2022 and expanded into Oceania in March 2023 and Europe in April 2023. By the end of 2025, its parent company reported that Temu was serving consumers across major markets including the U.S., Japan, Germany, the UK, France, Canada, and Italy. (SEC)
This rapid international expansion makes marketplace pricing more dynamic for competing retailers. A retailer does not necessarily need thousands of observations every minute; it needs a consistent historical record that reveals Real-time price tracking, discount movements, product-level price gaps, and recurring changes.
For decision-makers, the challenge is therefore not merely collecting a Temu price once. It is creating a repeatable system that answers:
- Which products changed price?
- How large was the change?
- Did the competitor introduce a discount?
- Is the same SKU available in multiple variants?
- Did availability change alongside price?
- Which categories show the greatest pricing volatility?
- When should internal pricing teams respond?
The following Daily Temu Price Tracking Setup, Fields & Pitfalls framework explains how retailers can structure this data from 2020 through 2026, while recognizing that Temu itself only began operations in 2022.
What Should a Retailer Capture Before Building a Daily Pricing Dataset?
A useful daily pricing program begins with a defined data schema rather than an extraction script. Retailers should decide which fields are commercially important before collecting records.
Daily Price Tracking Setup, Fields & Pitfalls
The essential product record can include product ID, product name, category, seller, current price, original price, discount percentage, currency, variant, rating, review count, product URL, availability status, shipping information, collection timestamp, and geographic market.
A common mistake is to capture only the displayed selling price. That can hide promotional mechanics. A product shown at $12.99 may have a crossed-out reference price, coupon, variant-specific price, or limited-time promotion. Capturing those surrounding fields creates a much stronger historical dataset.
Demand signals can also be derived from repeated observations. If a product repeatedly receives discounts around weekends, seasonal events, or category campaigns, retailers can identify recurring promotional behavior through Temu search page scraper data rather than reacting to one isolated price.
2020–2026 Market Context
| Year |
E-commerce pricing environment |
Data implication |
| 2020 |
Pandemic accelerated digital shopping |
More frequent online price changes became commercially important |
| 2021 |
Marketplace competition intensified |
Historical competitor benchmarks became more valuable |
| 2022 |
Temu launched |
New marketplace baseline began forming |
| 2023 |
Temu expanded internationally |
Cross-market price monitoring became more relevant |
| 2024 |
PDD Holdings reported RMB 393.8B revenue, up 59% year over year |
Marketplace scale reinforced the need for structured monitoring |
| 2025 |
Temu operated across multiple major economies |
Geographic and category-level comparisons gained importance |
| 2026 |
Dynamic marketplace competition continues |
Daily historical pricing datasets support faster decisions |
PDD Holdings reported that its total revenue increased 59% from RMB 247.6 billion in 2023 to RMB 393.8 billion in 2024, with transaction-services revenue increasing 108%. These figures are for PDD Holdings rather than Temu alone, so they should not be interpreted as Temu-specific revenue. (PDD Holdings)
Historical price observations become more useful when paired with timestamps. A six-month dataset can reveal whether a product's average price is falling, whether discount frequency is increasing, or whether a category is becoming more promotional through Temu variant availability scraping.
For retailers, this enables a shift from static competitor snapshots toward evidence-based pricing decisions.
How Should a Scalable Temu Collection Architecture Be Designed?
A reliable collection architecture separates discovery, extraction, validation, storage, and analysis. This reduces the risk of creating a large dataset that cannot be trusted or compared over time.
Temu scraper setup
The Temu scraper setup should begin with a product universe. Retailers can define target categories, search terms, product URLs, brands, or competitor groups. Each target should receive a stable internal identifier so today's record can be compared with yesterday's record.
The extraction layer should then capture the agreed fields and timestamp every observation. This timestamp is essential because price data without collection time has limited historical value.
A validation layer should check:
- Missing product identifiers
- Invalid or unexpected prices
- Duplicate records
- Currency inconsistencies
- Broken URLs
- Missing variants
- Sudden extreme price movements
- Incomplete category assignments
A storage layer should preserve both current and historical observations. Overwriting yesterday's price with today's price eliminates the ability to calculate price-change frequency and volatility.
2020–2026 Development Perspective
From 2020 onward, e-commerce data programs increasingly moved toward automated recurring collection because manual spreadsheets could not efficiently maintain rapidly changing marketplace records. After Temu's 2022 launch and international expansion during 2023, the requirement became even more relevant for retailers comparing new marketplace competitors. (SEC)
The strongest architecture is therefore not simply a scraper. It is a repeatable pipeline that transforms marketplace observations into historical business data.
How Can Search Results and Catalog Data Improve Competitive Analysis?
Search pages provide an important view of what shoppers encounter before opening individual product pages. They can reveal category positioning, product ordering, displayed prices, promotional labels, and the breadth of competing products.
Search-level collection can be combined with product-level extraction to create a richer competitive dataset. For example, a retailer tracking wireless accessories could collect search-result position, product name, displayed price, discount, rating, review count, and product URL through an automated daily Temu scraper before enriching each product with additional attributes.
Catalog enrichment is particularly valuable when products have inconsistent names or incomplete descriptions. Additional fields such as material, size, color, compatibility, pack count, dimensions, and brand can make competitor products easier to classify.
This helps retailers compare like-for-like products instead of relying only on product titles.
2020–2026 Market Context
| Period |
Catalog intelligence priority |
Retailer benefit |
| 2020–2021 |
Basic product and price fields |
Competitor benchmarking |
| 2022 |
New marketplace discovery |
Establishing baseline catalogs |
| 2023 |
International expansion |
Cross-market catalog comparison |
| 2024 |
Broader marketplace competition |
Category-level benchmarking |
| 2025 |
More geographic coverage |
Regional assortment analysis |
| 2026 |
Continuous intelligence |
Faster pricing and assortment decisions |
Euromonitor reported that the share of U.S. e-commerce sales represented by third-party marketplaces increased from 22% in 2018 to 27% in 2023, while identifying Temu as particularly strong in electronics. (Euromonitor)
For retailers in competitive categories, combining search visibility with catalog attributes can therefore reveal both what is being sold and how it is being positioned.
Why Does Variant-Level Availability Matter for Price Intelligence?
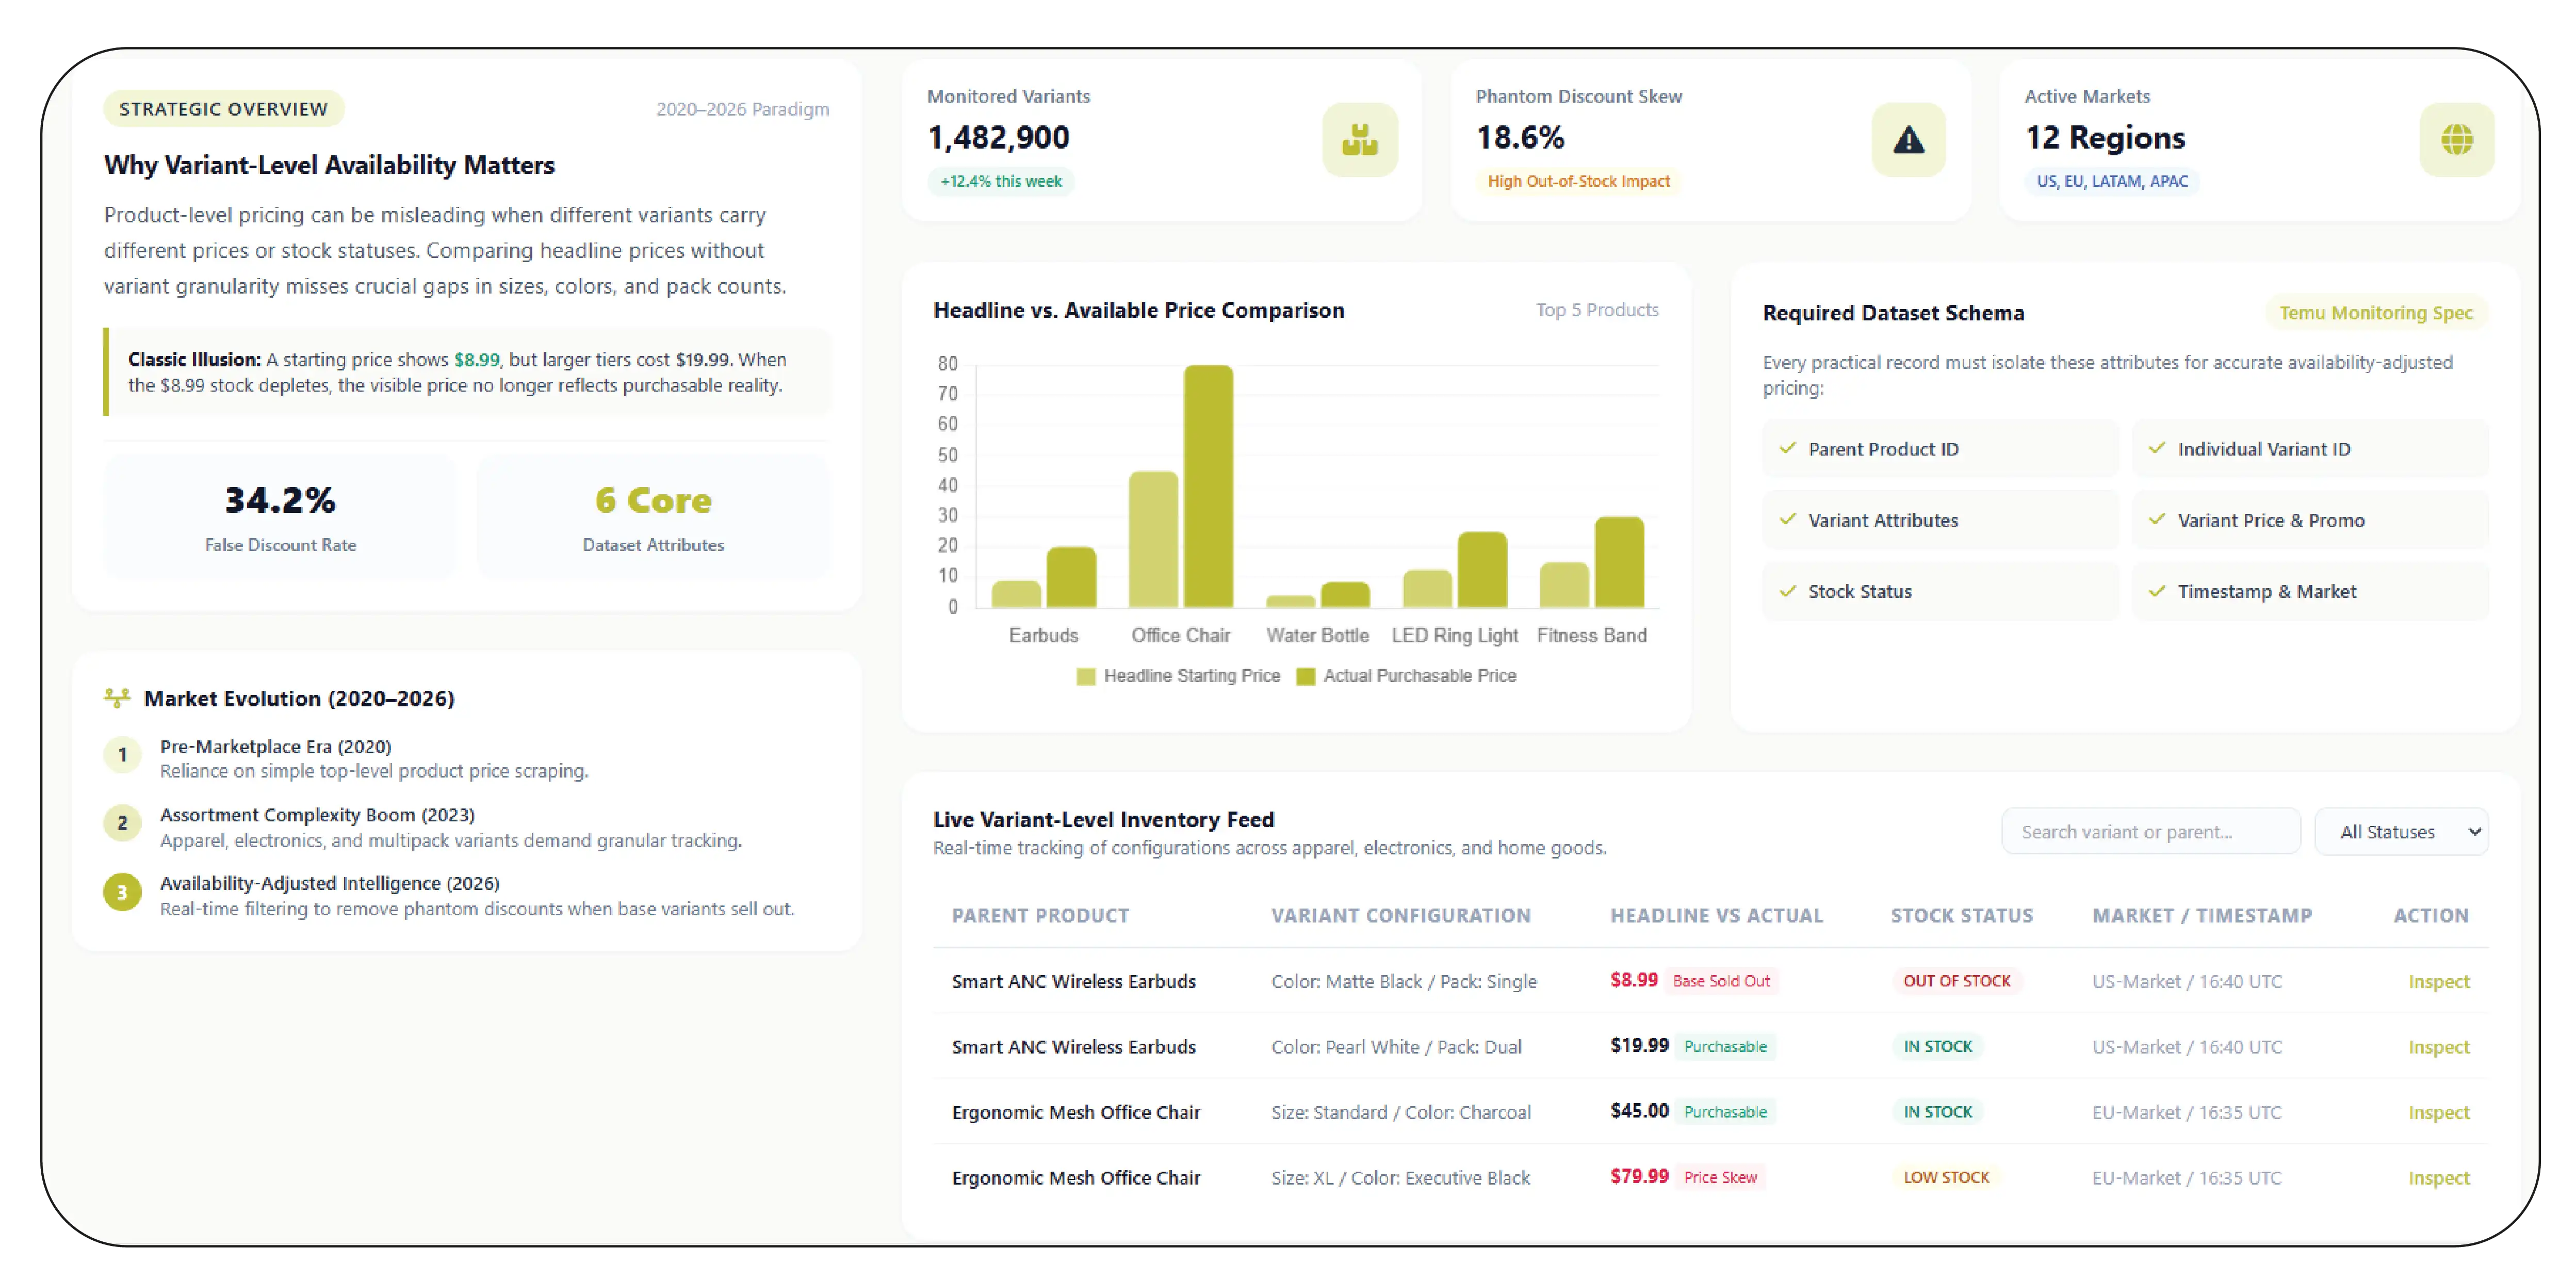
Product-level pricing can be misleading when different variants carry different prices or availability statuses. A retailer comparing only the headline product price may miss significant differences between sizes, colors, pack counts, or configurations.
Variant-level records should ideally contain a product identifier, variant identifier or name, variant attributes, price, promotional price when available, stock status, and collection timestamp for effective Temu Product Availability Monitoring.
For example, a single product may display a starting price of $8.99 while larger configurations cost $14.99 or $19.99. If the $8.99 variant becomes unavailable, the visible starting price may no longer represent the purchasable assortment.
This makes variant-level monitoring important for pricing teams that want to understand the price actually associated with available inventory.
2020–2026 Evolution
Before large-scale marketplace competition, many pricing programs focused primarily on product-level prices. As assortment complexity increased, variant-level information became more important for apparel, electronics, home goods, beauty, and multipack products.
A practical dataset should therefore distinguish:
- Parent product
- Individual variant
- Variant price
- Variant availability
- Promotional status
- Timestamp
- Geographic market
This structure makes it possible to calculate availability-adjusted pricing and identify situations where a competitor appears cheaper only because its lowest-priced variant is unavailable.
How Can Daily Automation Turn Price Changes Into Pricing Decisions?
The commercial value of recurring collection comes from comparison. One observation tells a retailer what a competitor charged. Hundreds of observations reveal how that competitor behaves.
A daily workflow can compare the newest observation with previous records and classify changes as price increases, price decreases, new discounts, availability changes, or unchanged conditions to support Demand Trend Intelligence.
For example:
| Signal |
Example observation |
Potential business response |
| Price decrease |
$29.99 → $25.99 |
Review competitive gap |
| Price increase |
$25.99 → $29.99 |
Reassess internal price position |
| Discount introduced |
10% → 25% |
Monitor promotional pressure |
| Product unavailable |
In stock → Out of stock |
Recalculate competitive availability |
| New variant |
3 → 5 variants |
Review assortment expansion |
| Repeated price cuts |
4 reductions in 30 days |
Investigate category pressure |
2020–2026 Trend
Automated pricing intelligence has increasingly shifted from periodic reporting toward continuous monitoring. The reason is operational: historical data becomes substantially more useful when every observation has the same structure and collection cadence.
For retailers, daily data can support price-gap calculations, discount-frequency analysis, category volatility scores, competitor benchmarking, and exception alerts.
The goal should not be to change prices automatically whenever a competitor moves. Instead, automation should surface meaningful changes through Catalog Enrichment Services, so pricing managers can evaluate them alongside margin, inventory, demand, and business rules.
How Does Availability Monitoring Strengthen Price Analysis?
Price without availability can produce misleading conclusions. A competitor may advertise an extremely low price, but if the relevant product or variant is unavailable, the commercial comparison is incomplete.
Availability monitoring should therefore be stored alongside every price observation. Useful states include in stock, unavailable, limited availability, variant unavailable, or other source-specific statuses where reliably detectable.
A historical availability dataset allows retailers to calculate metrics such as:
- Availability rate
- Out-of-stock frequency
- Average days unavailable
- Price during available periods
- Discount frequency while available
- Variant-level availability
- Category-level availability
2020–2026 Market Context
| Year |
Strategic focus |
Recommended monitoring |
| 2020 |
Digital purchasing growth |
Product price + availability |
| 2021 |
Marketplace expansion |
Competitor assortment |
| 2022 |
Temu launch |
Baseline marketplace observations |
| 2023 |
International expansion |
Country-level availability |
| 2024 |
Increasing marketplace competition |
Price + promotion + stock |
| 2025 |
Broader global reach |
Variant and regional monitoring |
| 2026 |
Continuous pricing intelligence |
Integrated price and availability signals |
PDD Holdings states that Temu connects buyers, merchants, manufacturers, and brands globally and works with logistics vendors and fulfillment partners. Its 2025 annual report also notes that Temu remained at an early stage of development with a limited operating history, reinforcing the importance of treating marketplace changes as an evolving dataset rather than assuming historical patterns will remain stable. (SEC)
Why Choose Product Data Scrape?
A strong marketplace data program needs more than extraction. It needs consistent schemas, historical storage, validation, normalization, and business-ready delivery.
Product Data Scrape can help retailers build Temu category-level product scraping workflows around defined categories, product groups, variants, markets, and pricing fields. The approach can also support recurring collection schedules and structured historical datasets.
For pricing teams, Daily Temu price Data scraping can provide the recurring observations required to calculate price gaps, discount frequency, availability changes, and category-level volatility.
The focus should remain on actionable intelligence: identifying meaningful movements, reducing manual research, and giving analysts clean records that can be used in dashboards, reports, databases, and pricing workflows.
Conclusion
Marketplace pricing changes quickly, but retailers can make better decisions when those changes are captured consistently and compared historically. A structured daily monitoring framework can reveal price movements, discounts, variant changes, availability shifts, and category-level competitive patterns.
For businesses operating in fast-moving e-commerce categories, Temu Product Data Scraping can provide the historical foundation needed for competitor benchmarking and pricing analysis. The most valuable workflow combines product, price, variant, promotion, and availability observations rather than treating price as an isolated field.
Partner with Product Data Scrape to build a scalable pricing intelligence workflow that turns recurring marketplace observations into actionable competitive insights!
FAQs
1. What is daily Temu price monitoring?
It is a recurring process that captures product prices and related fields at scheduled intervals, creating historical records that retailers can use for competitor benchmarking and pricing decisions.
2. Which fields should retailers collect?
Core fields include product name, product ID, price, original price, discount, variant, availability, category, URL, currency, rating, and collection timestamp.
3. Why monitor variants separately?
Variants can have different prices and stock statuses. Separating them prevents headline prices from creating misleading comparisons when the cheapest option is unavailable.
4. How does historical pricing improve decisions?
Historical records reveal recurring discounts, price volatility, competitor behavior, and category trends. These patterns provide more context than a single current-price observation.
5. Can Product Data Scrape support recurring monitoring?
Yes. Product Data Scrape can support structured recurring marketplace data workflows designed around defined products, categories, markets, fields, validation rules, and delivery requirements.


 Singapore
 EMAIL
EMAIL
 PHONE
PHONE

















.webp)






