Introduction
Businesses can Scrape Lulu hypermarket target daily pricing data to build structured, timestamped records of grocery prices, discounts, SKUs, pack sizes, brands, categories, and promotional changes. This gives retailers, CPG brands, marketplaces, and analysts a repeatable way to monitor pricing instead of relying on manual checks.
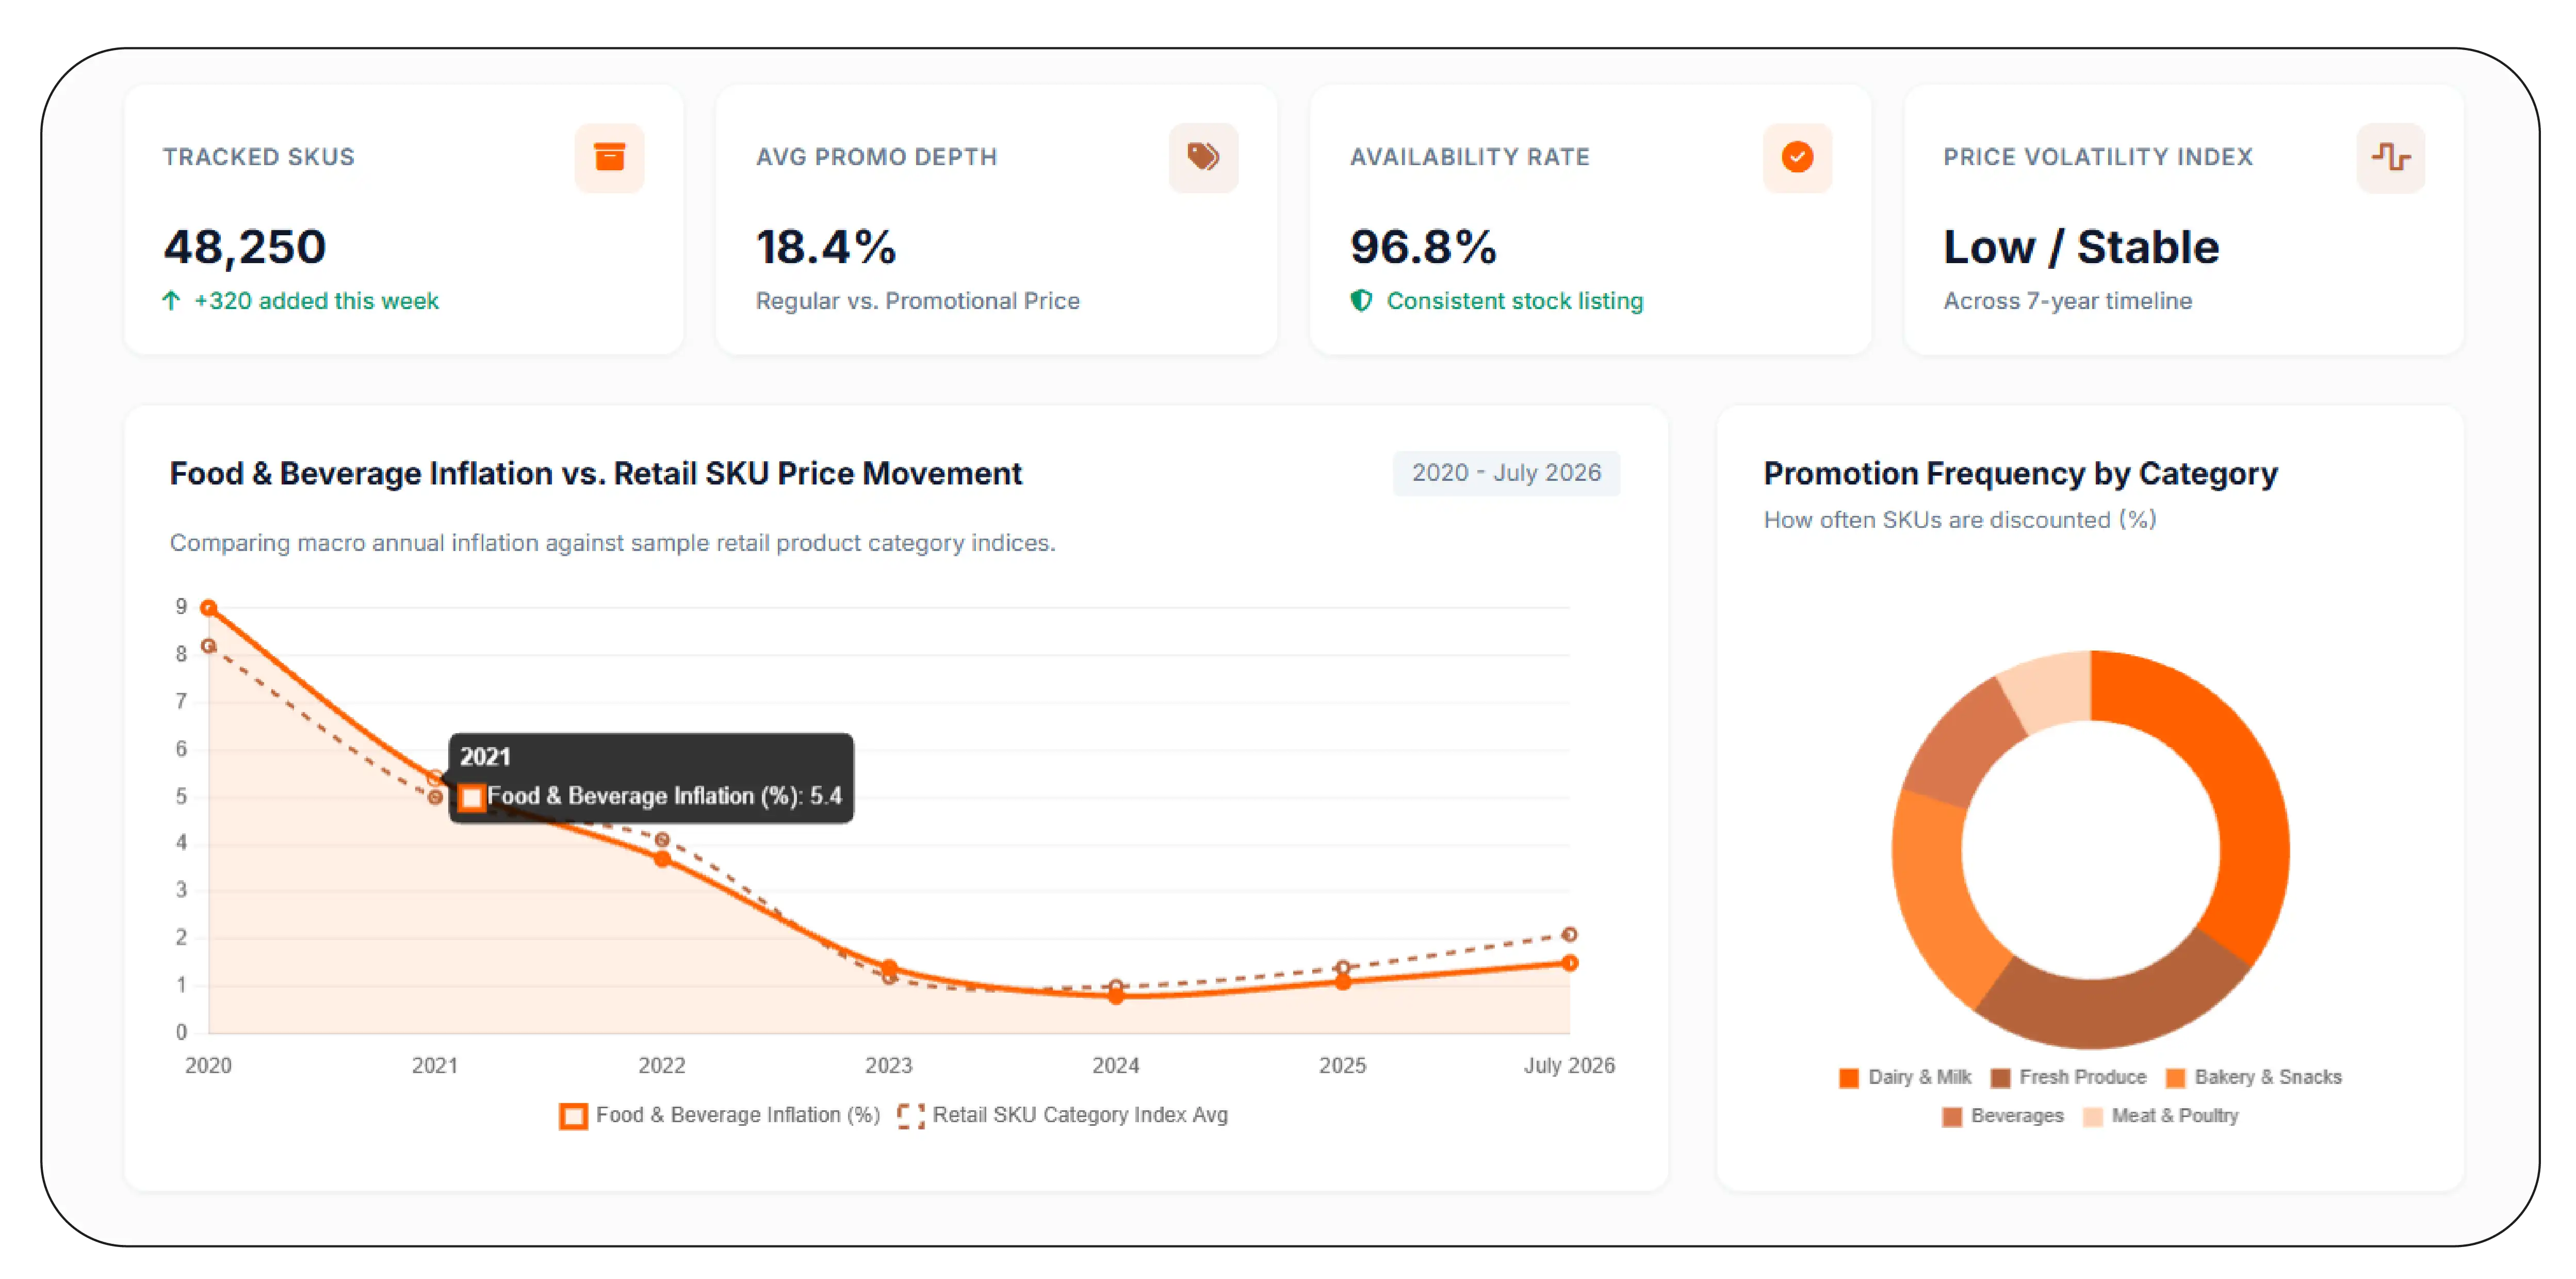
Saudi Arabia's food market has experienced meaningful price changes over the past several years. GASTAT reported that food and beverage prices increased 9.0% in 2020, 5.4% in 2021, 3.7% in 2022, 1.4% in 2023, and 0.8% in 2024. In 2025, the annual food-and-beverages index increased 1.1%.
This makes Saudi Arabia Grocery Pricing Data particularly valuable for businesses that need to distinguish normal price movement from promotions, assortment changes, and competitor reactions.
The practical challenge is scale. A pricing team may need to monitor hundreds or thousands of SKUs across grocery categories. Prices can change while products remain identical, and promotional prices can temporarily replace regular prices. Without historical observations, it becomes difficult to understand whether a price change is temporary or part of a broader trend.
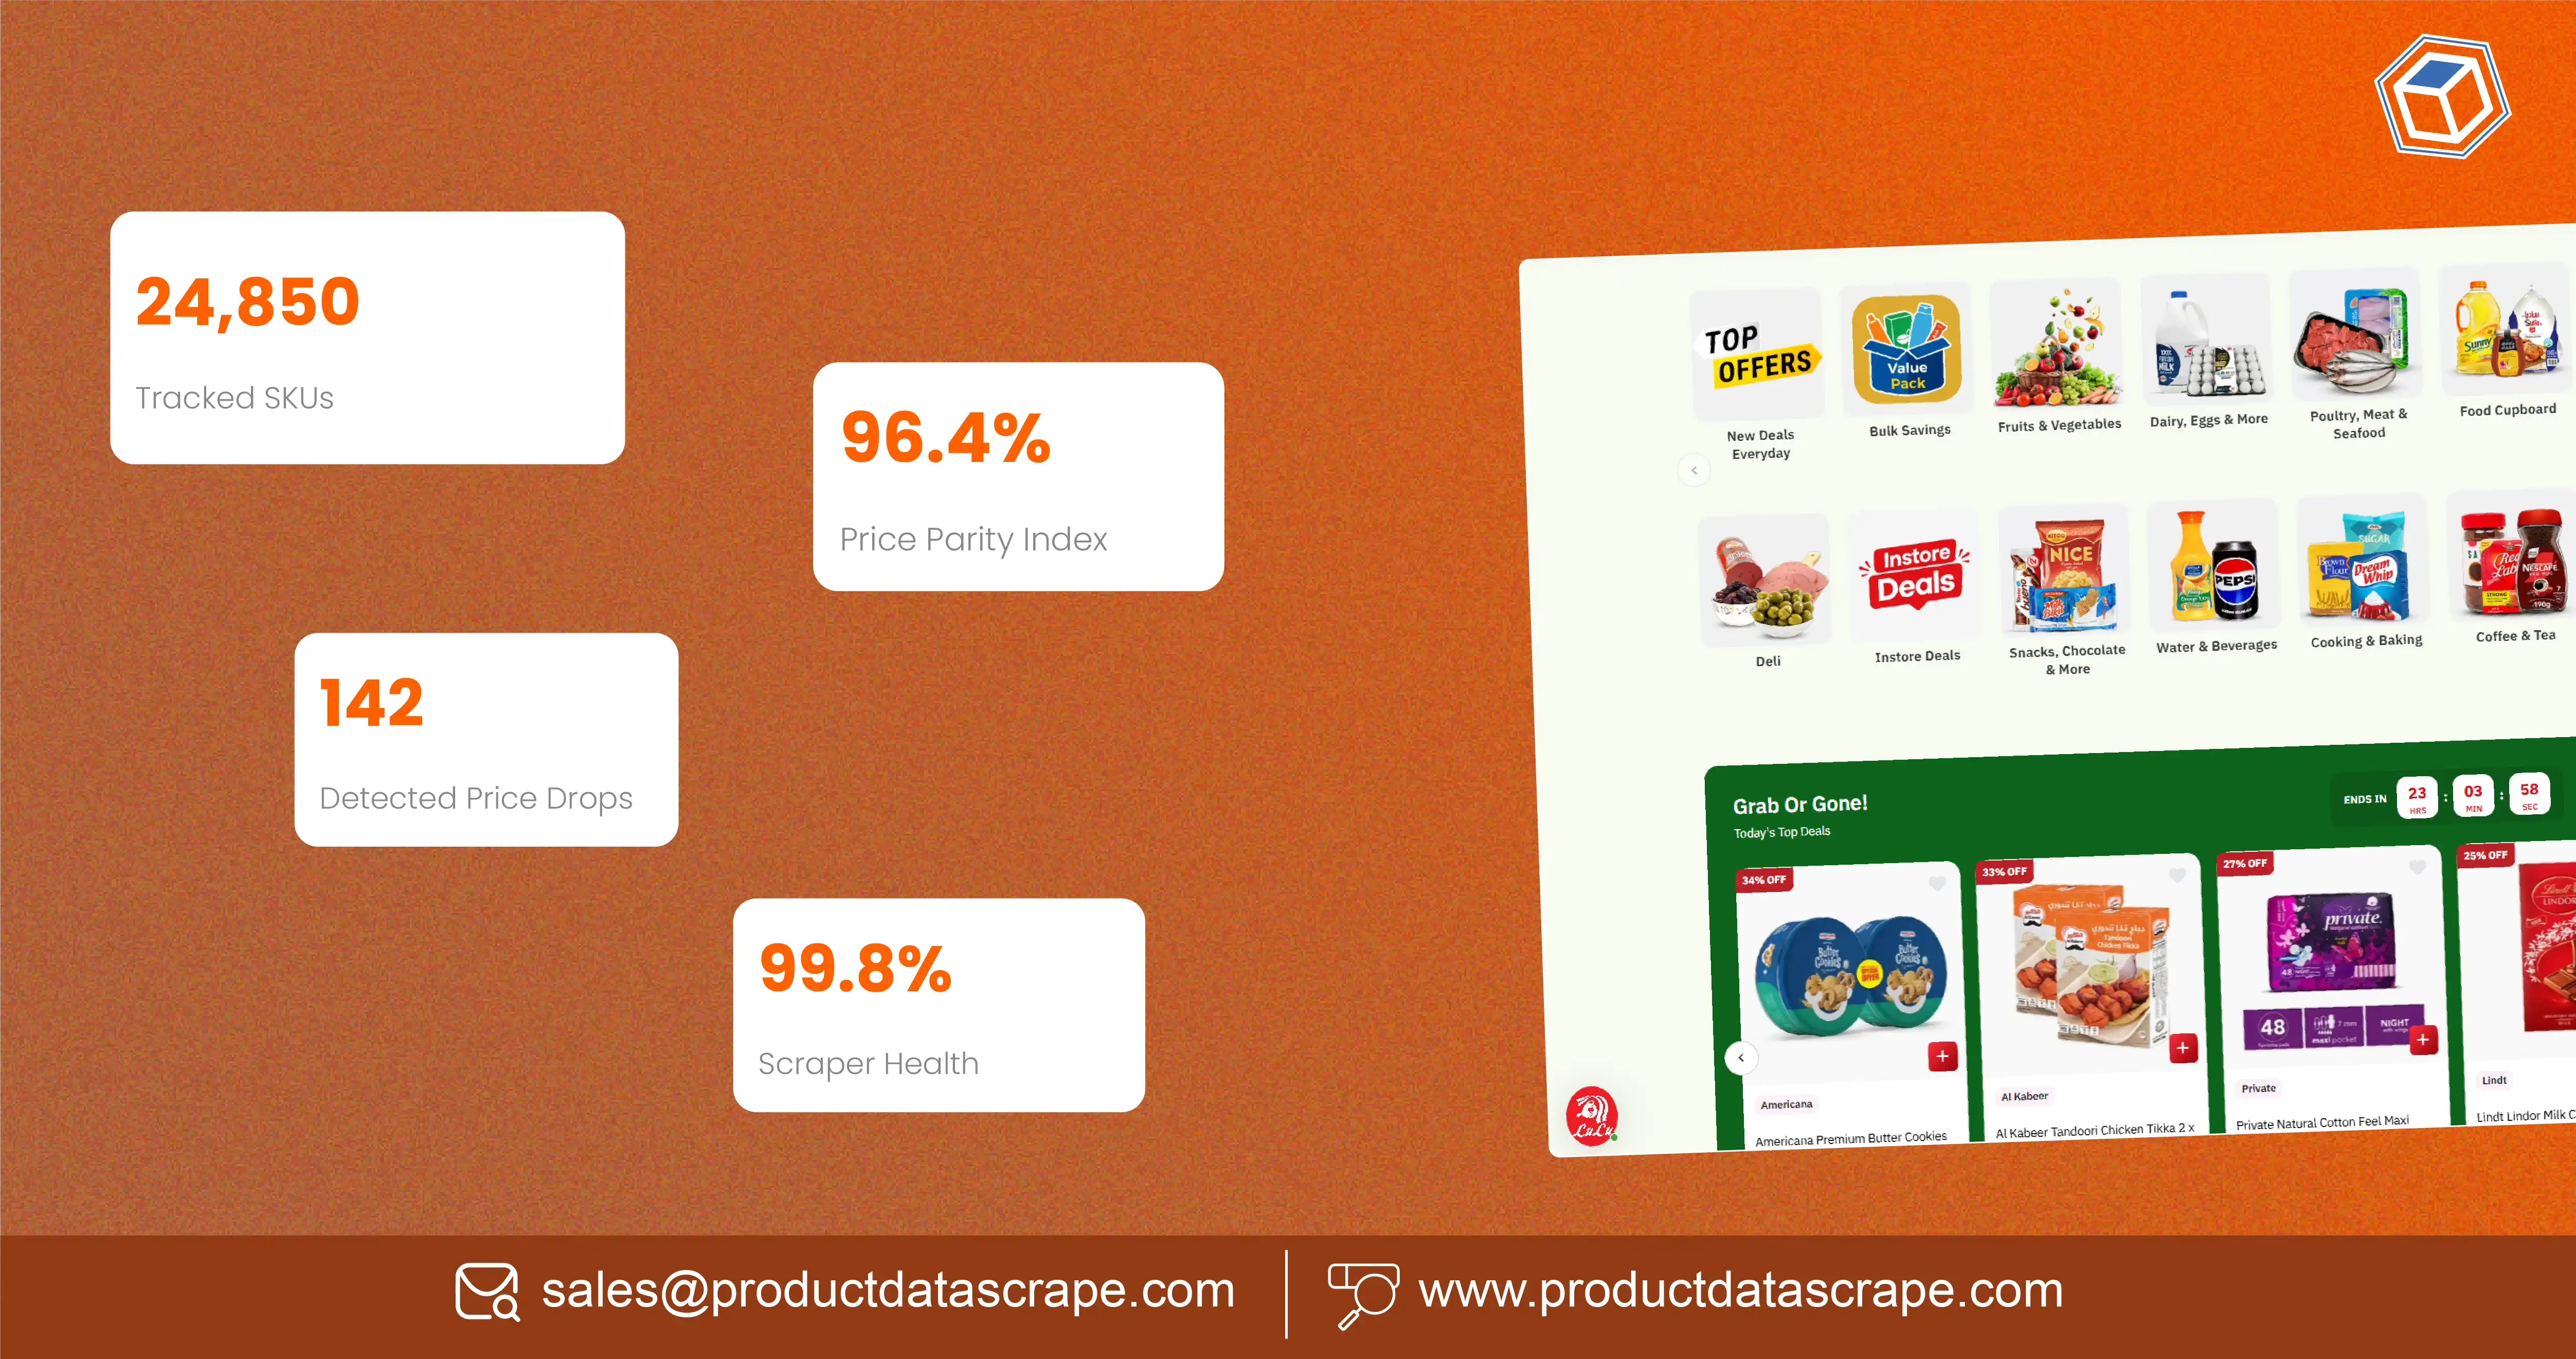
LuLu Hypermarket's Saudi online store currently displays grocery and fresh-food products with attributes such as product names, pack sizes, current prices, previous prices, and discount percentages. Its online catalog also provides category-level product listings.
A structured data strategy can turn these changing observations into an analytics-ready dataset.
What Should a Daily Retail Price Monitoring System Capture?
Lulu Hypermarket Daily Price Tracking is most useful when every observation is stored with its product identity and collection timestamp. Businesses should avoid treating a price as an isolated number because the same product can have multiple price states over time.
Web Scraping LuLu Hypermarket Data can be designed around the fields that matter to pricing, category-management, and market-intelligence teams.
A practical dataset can contain:
| Data attribute |
Business use |
| Product name |
Product identification |
| SKU/product ID |
Persistent product matching |
| Brand |
Brand-level benchmarking |
| Category |
Category analysis |
| Pack size |
Quantity normalization |
| Regular price |
Baseline pricing |
| Sale price |
Promotion analysis |
| Discount percentage |
Offer-depth measurement |
| Product availability |
Assortment monitoring |
| Product URL |
Source reference |
| Retailer/location |
Market segmentation |
| Collection timestamp |
Historical tracking |
| Product status |
New, active, unavailable, or changed |
The historical context explains why this matters. Saudi Arabia's food and beverage inflation was particularly elevated in 2020, when the category increased 9.0%, while the overall CPI rose 3.4%. In 2021, food and beverages increased by approximately 5.4%, based on the annual index values reported by GASTAT.
By 2022, food and beverage prices increased 3.7%, with GASTAT identifying meat and poultry and vegetables among contributors to food-price growth.
| Year |
Saudi food & beverage price change |
Monitoring implication |
| 2020 |
+9.0% |
Establish a high-change baseline |
| 2021 |
+5.4% |
Track continuing price pressure |
| 2022 |
+3.7% |
Compare category-level movement |
| 2023 |
+1.4% |
Detect smaller price changes |
| 2024 |
+0.8% |
Monitor promotions and competitive gaps |
| 2025 |
+1.1% |
Continue historical benchmarking |
| 2026 |
+1.5% YoY in July |
Maintain current price visibility |
The 2026 figure above refers to the July year-over-year change in food and beverage prices reported by GASTAT.
For a pricing team, the important insight is that lower aggregate inflation does not mean individual products stop changing price. Product-level collection is therefore necessary to identify changes hidden by broad averages.
How Can an API-Based Approach Improve Competitive Price Intelligence?
Lulu Hypermarket Competitive Pricing Data API can provide businesses with a structured delivery layer for recurring product observations. Instead of manually downloading information and rebuilding spreadsheets, teams can integrate standardized records into dashboards, databases, pricing systems, or analytical workflows.
The key advantage is consistency.
A daily collection process can follow this structure:
Discover → Extract → Normalize → Validate → Timestamp → Store → Compare → Analyze
For example, a pricing team can maintain a master SKU list and compare each new observation with the previous observation. This enables automated identification of:
- Price increases
- Price decreases
- New discounts
- Expired promotions
- Product availability changes
- New product listings
- Removed products
- Pack-size changes
- Category-level price movement
LuLu's Saudi online catalog currently shows examples where current prices are displayed alongside previous prices and discount percentages. For instance, its offers pages include products with explicit sale prices and percentage discounts.
This structure can support a pricing intelligence model in which each observation becomes a row in a historical dataset.
| Event |
Previous state |
Current state |
Possible insight |
| Price increase |
SAR 20 |
SAR 22 |
Regular-price movement |
| Price decrease |
SAR 20 |
SAR 18 |
Competitive or promotional adjustment |
| New discount |
No offer |
20% off |
Promotion launched |
| Discount removed |
25% off |
Regular price |
Promotion ended |
| Availability change |
Available |
Unavailable |
Assortment/supply signal |
| New SKU |
Not listed |
Listed |
Assortment expansion |
For larger programs, API-ready delivery also reduces the friction between collection and analysis. Data can move into business intelligence platforms where teams calculate price indexes, promotional frequency, price gaps, and category trends.
This is especially valuable for brands that need daily rather than monthly visibility.
How Can Businesses Build a Clean SKU-Level Grocery Dataset?
Extract Lulu Hypermarket Product Price SKU Data becomes more useful when products are normalized before analysis. Simply collecting product titles and prices can create duplicate records because the same product may appear with different formatting, pack descriptions, or promotional labels.
Grocery data scraping should therefore capture enough metadata to create a stable product identity.
A recommended product schema includes:
| Layer |
Fields |
| Identity |
SKU, product ID, product name |
| Brand |
Brand name, private-label indicator |
| Classification |
Category, subcategory |
| Quantity |
Pack size, unit, count |
| Pricing |
Regular price, sale price, unit price |
| Promotion |
Discount percentage, offer status |
| Availability |
In-stock/out-of-stock status |
| Geography |
Country, city/store or service area where available |
| Source |
Product URL |
| Time |
Collection date and timestamp |
LuLu's current Saudi catalog demonstrates why this structure is useful. Its grocery pages expose products across multiple categories and show attributes such as brands, pack quantities, current prices, and offers.
A clean SKU dataset should also distinguish between product-level and offer-level changes.
For example:
Product: LuLu Salted Butter 500 g
Regular price: SAR 24.95
Observed price: SAR 20.99
Discount: 16%
Timestamp: Collection date/time
This is more informative than storing only "Butter = SAR 20.99."
Historical data becomes particularly important when comparing 2020–2026 market conditions. GASTAT's annual data shows that food and beverage inflation changed considerably during this period, from 9.0% in 2020 to 0.8% in 2024 and 1.1% in 2025.
Businesses can use the resulting dataset for:
- SKU-level price benchmarking
- Category price indexes
- Promotion monitoring
- Assortment analysis
- Private-label analysis
- Historical price trends
- Retail intelligence dashboards
The core principle is simple: preserve every observation instead of overwriting yesterday's price with today's price.
How Can Businesses Monitor Daily Target Prices?
Scrape Lulu Hypermarket Daily Target Prices can support a targeted monitoring model in which businesses define a specific product universe instead of collecting every available product.
This is useful when a business has a priority list containing:
- Top-selling products
- High-margin products
- Strategic SKUs
- Private-label products
- Frequently promoted items
- Competitor-sensitive products
- Products affected by seasonal demand
A targeted approach can reduce unnecessary data processing while increasing attention on commercially important SKUs.
For example, a grocery brand could classify its monitoring universe into three tiers:
| Monitoring tier |
Example |
Suggested purpose |
| Tier 1 |
Strategic SKUs |
High-frequency price monitoring |
| Tier 2 |
Core category products |
Regular competitive benchmarking |
| Tier 3 |
Long-tail products |
Periodic assortment and price checks |
The 2026 environment shows why such targeting can be useful. GASTAT's July 2026 data showed that food and beverage prices increased 1.5% year over year, while some individual commodities moved much more sharply. A separate report based on GASTAT data noted that local tomatoes increased 59.5% year over year in July, while some other food products declined.
This demonstrates a critical analytical point: aggregate food inflation does not describe every SKU.
A business monitoring only a national food-price index could miss substantial product-level variation.
Daily collection can identify:
- Which SKUs changed price.
- How large the change was.
- Whether the change involved a promotion.
- How long the change remained active.
- Whether the same SKU returned to its previous price.
- Whether multiple products within a category moved together.
That creates a foundation for dynamic pricing analysis without assuming that every price change has the same cause.
For pricing managers, the most useful output is often a daily exception report rather than a massive raw dataset.
What Can a Historical Product Dataset Reveal About Pricing?
Lulu Hypermarket Product Price Dataset can become a historical record of retail price behavior when every observation is retained with product and timestamp information.
The dataset can support both operational and strategic analysis.
At an operational level, teams can identify today's price changes. At a strategic level, they can study weekly, monthly, seasonal, and annual patterns.
| Metric |
Calculation |
Business question |
| Average price |
Mean observed price |
What is the typical price? |
| Price change % |
Current vs. previous price |
How quickly did price move? |
| Promotion frequency |
Number of promotional observations |
How often is the SKU discounted? |
| Discount depth |
Regular vs. promotional price |
How aggressive are promotions? |
| Price volatility |
Variation across observations |
How stable is pricing? |
| Availability rate |
Available observations / total observations |
How consistently is the SKU listed? |
| Category index |
Category average over time |
How is the category moving? |
The 2020–2026 period provides useful macro context. Food and beverage prices increased 9.0% in 2020, 5.4% in 2021, 3.7% in 2022, 1.4% in 2023, 0.8% in 2024, and 1.1% in 2025.
In July 2026, GASTAT reported food and beverage prices up 1.5% year over year.
| Period |
Food & beverage inflation |
What SKU data can add |
| 2020 |
9.0% |
Product-level historical baseline |
| 2021 |
5.4% |
Identify category differences |
| 2022 |
3.7% |
Track price normalization |
| 2023 |
1.4% |
Detect smaller competitive changes |
| 2024 |
0.8% |
Monitor promotions and price gaps |
| 2025 |
1.1% |
Compare current vs. historical pricing |
| July 2026 |
1.5% YoY |
Identify product-level exceptions |
The macro data should not be treated as a substitute for retailer-specific observations. Instead, it provides context for interpreting them.
For example, if a product rises 10% while the food-and-beverage category rises 1.5%, the business has a reason to investigate the product, category, promotion, or supply context rather than assuming the increase reflects general inflation.
That is where historical retail data becomes decision-support information.
How Can Retail Teams Turn Grocery Data Into Actionable Analytics?
Retail Analytics Using LuLu Hypermarket Grocery Data connects raw product observations with business questions.
A pricing team does not necessarily need thousands of charts. It needs clear answers to questions such as:
- Which products changed price today?
- Which categories have the largest price movements?
- Which products are being discounted most frequently?
- How deep are current promotions?
- Which SKUs have become unavailable?
- Which private-label products compete directly with branded products?
- Which products show unusual price volatility?
A practical dashboard can therefore contain four layers.
Layer 1: Daily Exceptions
Highlight products whose price changed beyond a defined threshold.
Layer 2: Promotion Intelligence
Track new offers, discount depth, promotion duration, and recurring promotional patterns.
Layer 3: Category Benchmarking
Compare average and unit-normalized prices across categories.
Layer 4: Historical Trends
Show weekly, monthly, and yearly price movements.
LuLu's current Saudi online catalog contains thousands of listed products across grocery and fresh-food categories, with product pages and category pages displaying prices, brands, pack sizes, and promotional information.
This breadth makes data normalization important.
A business should not calculate a category price index by simply averaging every displayed price. Products should first be grouped appropriately, comparable pack sizes should be normalized, and promotional prices should be separated from regular prices where possible.
The 2026 data also reinforces the need for product-level analysis. GASTAT data reported substantial differences between individual food commodities, even while the overall food-and-beverage category recorded a much smaller year-over-year increase.
The actionable workflow is therefore:
Collect → Validate → Normalize → Compare → Detect → Explain → Report
This allows pricing and category teams to move from "What changed?" to "Which products changed, by how much, and in what context?"
For CPG brands, the same information can support retail execution monitoring. For marketplaces, it can support assortment and pricing intelligence. For researchers, it can create a structured historical record for market analysis.
Why Choose Product Data Scrape?
A scalable grocery data program requires more than extracting visible prices. It requires consistent product matching, historical storage, validation, normalization, and analytics-ready delivery.
A specialist approach can structure product names, SKUs, categories, brands, pack sizes, regular prices, sale prices, discounts, availability, URLs, and timestamps into a repeatable dataset.
The Lulu Hypermarket Grocery Data Scraping API approach can support recurring collection and structured delivery for teams that need daily or scheduled observations.
The most useful implementation is tailored to the buyer's monitoring objectives. A CPG brand may prioritize strategic SKUs, while a retailer may need category-level price intelligence. A research team may require a broader historical dataset.
The result should be reliable data that can flow into dashboards, databases, pricing models, and business intelligence workflows.
Conclusion
A daily retail pricing strategy works best when businesses preserve product-level observations instead of relying on isolated snapshots. Lulu Hypermarket Grocery Product Dataset records can connect product identity, pricing, promotions, pack sizes, availability, and timestamps to create a historical view of retail behavior.
Saudi food-price statistics show why this context matters: food and beverage inflation moved from 9.0% in 2020 to 1.1% in 2025, while July 2026 recorded a 1.5% year-over-year increase.
A structured collection strategy can complement those macro indicators with SKU-level observations.
Work with Product Data Scrape to build scalable LuLu Hypermarket pricing datasets and transform daily grocery price changes into actionable retail intelligence!
FAQs
1. What does Scrape Lulu hypermarket target daily pricing data mean?
It means collecting product prices, discounts, SKUs, availability, pack sizes, and timestamps from LuLu's online retail catalog on a recurring schedule.
2. Why is Saudi Arabia Grocery Pricing Data useful for businesses?
It helps retailers and brands understand price movements, promotional activity, category trends, product-level differences, and changing competitive conditions across Saudi Arabia.
3. What is Lulu Hypermarket Daily Price Tracking used for?
It helps pricing teams identify daily price changes, promotions, product availability shifts, unusual movements, and historical trends across selected grocery SKUs.
4. How does Lulu Hypermarket Competitive Pricing Data API support analysis?
It can deliver structured, recurring observations into databases or analytics systems, enabling automated comparisons of prices, discounts, products, categories, and timestamps.
5. How can Product Data Scrape support LuLu pricing intelligence?
It can help businesses structure recurring product data into historical datasets suitable for competitive pricing, promotion monitoring, assortment analysis, and retail analytics.


 Singapore
 EMAIL
EMAIL
 PHONE
PHONE















.webp)






