Introduction
Businesses can Scrape Canada grocery price data Quebec 2026 to create structured, recurring records of product prices, promotions, availability, pack sizes, brands, and competitor offers. This helps retailers, CPG brands, marketplaces, and analysts understand price movements instead of relying on occasional manual checks.
The need for detailed grocery intelligence has increased as food prices have remained elevated. Statistics Canada reported that food purchased from stores increased 3.1% year over year in July 2026, while the all-items CPI increased 3.0%. (Statistics Canada)
At the same time, E-commerce data scraping in Canada can extend price research beyond static market reports by capturing the product-level information displayed by online retailers. A structured dataset can connect product names, SKUs, brands, categories, prices, discounts, stock status, pack sizes, URLs, locations, and timestamps.
For a Quebec-focused business, the objective is not simply to collect more data. The real objective is to convert frequent price observations into comparable common intelligence.
This is particularly useful for:
- Grocery retailers monitoring competitors
- CPG and FMCG brands tracking retail execution
- Pricing teams measuring promotional activity
- Market researchers studying category movements
- E-commerce businesses comparing online assortments
- Analysts building regional grocery price benchmarks
Statistics Canada also provides monthly average retail prices for selected food products and warns that differences in product quality, quantity, brands, and regional characteristics should be considered when comparing prices. (Statistics Canada)
A retailer-specific dataset therefore complements official statistics by adding the product, seller, promotion, and location context required for operational decisions.
What Can Businesses Learn From Quebec's Changing Grocery Market?
Quebec Grocery Market Intelligence 2026 becomes more useful when businesses combine market-level indicators with product-level observations. Official statistics can show broad inflation and retail trends, while structured collection can show how individual products and retailers are changing prices.
Statistics Canada reported that Quebec retail sales reached $16.16 billion in July 2026 on a seasonally adjusted basis, virtually unchanged from June and 3.9% higher than July 2025. Montréal retail sales reached $7.943 billion, up 4.1% year over year. (Statistics Canada)
The broader historical pattern also demonstrates why a multi-year dataset matters.
| Period |
Market signal |
Business implication |
| 2020 |
Store-food price growth ranged from 0.5% to 4.0% during the year |
Pandemic-era changes created unusual price and supply conditions |
| 2021 |
Store-food inflation moved from 0.1% in January to 5.7% in December |
Monitoring became more important as price pressure accelerated |
| 2022 |
Store-food inflation reached 11.4% in September |
Frequent competitive price observation became increasingly valuable |
| 2023 |
Annual average store-food prices increased 7.8% |
Category-level benchmarking became more important |
| 2024 |
Grocery inflation moderated substantially from 2023 levels |
Historical comparison became essential for identifying persistent changes |
| 2025 |
Food-price pressure strengthened again during several months |
Promotion and competitor monitoring regained importance |
| 2026 |
Store-food inflation was 3.1% in July |
Current product-level tracking can explain differences hidden by aggregate indexes |
Statistics Canada recorded store-food inflation at 11.4% in September 2022 and reported a 7.8% annual average increase in 2023. (Statistics Canada)
For businesses, the lesson is straightforward: a single monthly price is an observation, but a timestamped sequence of observations becomes intelligence.
A useful Quebec dataset should therefore preserve historical values rather than overwrite previous prices. This allows teams to identify sustained increases, temporary promotions, competitor reactions, and recurring seasonal patterns.
How Does Automated Collection Improve Grocery Price Visibility?
Quebec canada Grocery Price Data Scraping allows organizations to turn publicly displayed online grocery information into structured datasets that can be refreshed according to business requirements.
Manual monitoring is difficult when hundreds or thousands of products must be checked across multiple retailers. Product pages can also change frequently, making spreadsheets created from occasional checks unsuitable for continuous competitive intelligence.
A structured collection workflow can capture:
| Data field |
Example use |
| Product name |
Match equivalent products |
| Brand |
Compare branded and private-label items |
| SKU/product ID |
Maintain product identity |
| Category |
Analyze category-level pricing |
| Regular price |
Establish baseline |
| Sale price |
Measure promotional discount |
| Discount percentage |
Compare promotion depth |
| Pack size |
Normalize unit economics |
| Availability |
Detect stock changes |
| Retailer |
Build competitor comparisons |
| Location/pincode |
Identify regional differences |
| Product URL |
Maintain source traceability |
| Timestamp |
Build historical price series |
From 2020 through 2026, grocery pricing moved through very different market conditions. Store-food inflation was only 0.5% in December 2020, reached 5.7% by December 2021, and climbed to 11.0% in December 2022. (Statistics Canada)
That progression illustrates why historical collection matters. If businesses retain only today's price, they lose the context required to determine whether a change is structural, promotional, seasonal, or temporary.
For Quebec operations, automated collection can also be designed around regional requirements. Teams can define retailer lists, product categories, geographic areas, refresh frequency, and required attributes before delivery.
The result is a repeatable data pipeline rather than a one-time spreadsheet exercise.
How Can Businesses Benchmark Comparable Grocery Products?
Quebec canada Grocery Product Benchmarking helps businesses answer a practical question: how does the price of an equivalent or comparable product differ across retailers, brands, pack sizes, and locations?
Benchmarking becomes difficult when products are not normalized. A 500-gram package cannot be compared directly with a 750-gram package without adjusting for quantity. Similarly, promotional pricing should not automatically be treated as the standard market price.
A useful benchmarking model should therefore separate:
- Regular price
- Promotional price
- Unit price
- Pack size
- Brand
- Product variant
- Retailer
- Collection date
- Geographic market
- Availability status
What does historical benchmarking reveal?
| Year |
Key development |
Benchmarking value |
| 2020 |
Grocery pricing changed amid pandemic disruptions |
Establishes an unusual baseline |
| 2021 |
Price growth accelerated toward year-end |
Shows transition into stronger inflation |
| 2022 |
Store-food inflation reached double digits |
Highlights the importance of frequent checks |
| 2023 |
Annual store-food inflation averaged 7.8% |
Supports category and competitor comparisons |
| 2024 |
Inflation moderated |
Helps distinguish normalization from price cuts |
| 2025 |
Grocery inflation accelerated again during parts of the year |
Shows why historical tracking should continue |
| 2026 |
Inflation remained positive |
Reinforces the value of current competitive observations |
Statistics Canada reported that store-food prices rose 7.8% on an annual average basis in 2023, following a 9.8% increase in 2022. (Statistics Canada)
The most actionable insight is that benchmarking should be based on normalized products rather than product names alone. Businesses can create product-matching rules that account for brand, size, variant, unit of measure, and product category.
This makes the dataset more suitable for pricing dashboards, competitor monitoring, assortment analysis, and category management.
Why Is Continuous Price Analysis More Useful Than One-Time Research?
Quebec Grocery Price Analysis becomes significantly more actionable when price observations are collected continuously. A one-time snapshot can identify the current market price, but it cannot explain how that price was reached or whether it is likely to change again.
For example, suppose a retailer lists a product at $4.99. Without historical information, a business cannot determine whether $4.99 is the normal price, a weekend promotion, a seasonal discount, or a response to a competitor.
A time-series dataset solves this problem.
| Analysis metric |
What it can reveal |
| Average price |
Typical market positioning |
| Minimum price |
Lowest observed competitive offer |
| Maximum price |
Highest observed market price |
| Price spread |
Difference between retailers |
| Discount depth |
Promotional intensity |
| Price-change frequency |
Pricing volatility |
| Availability rate |
Product supply visibility |
| Unit-price difference |
Normalized competitiveness |
The 2020–2026 period demonstrates the value of this approach. Food purchased from stores experienced relatively modest price growth in parts of 2020 and early 2021, followed by a sharp acceleration in 2022 and elevated growth through 2023. (Statistics Canada)
By 2026, Statistics Canada reported 3.1% year-over-year growth for food purchased from stores in July. (Statistics Canada)
These changes show why businesses should retain historical observations. Current prices can be interpreted correctly only when analysts understand the baseline.
For pricing teams, the ideal workflow is:
Collect → Normalize → Match → Compare → Track → Analyze → Act
That workflow transforms raw product information into a repeatable decision-support system.
How Can Retailers Detect Competitor Pricing Changes?
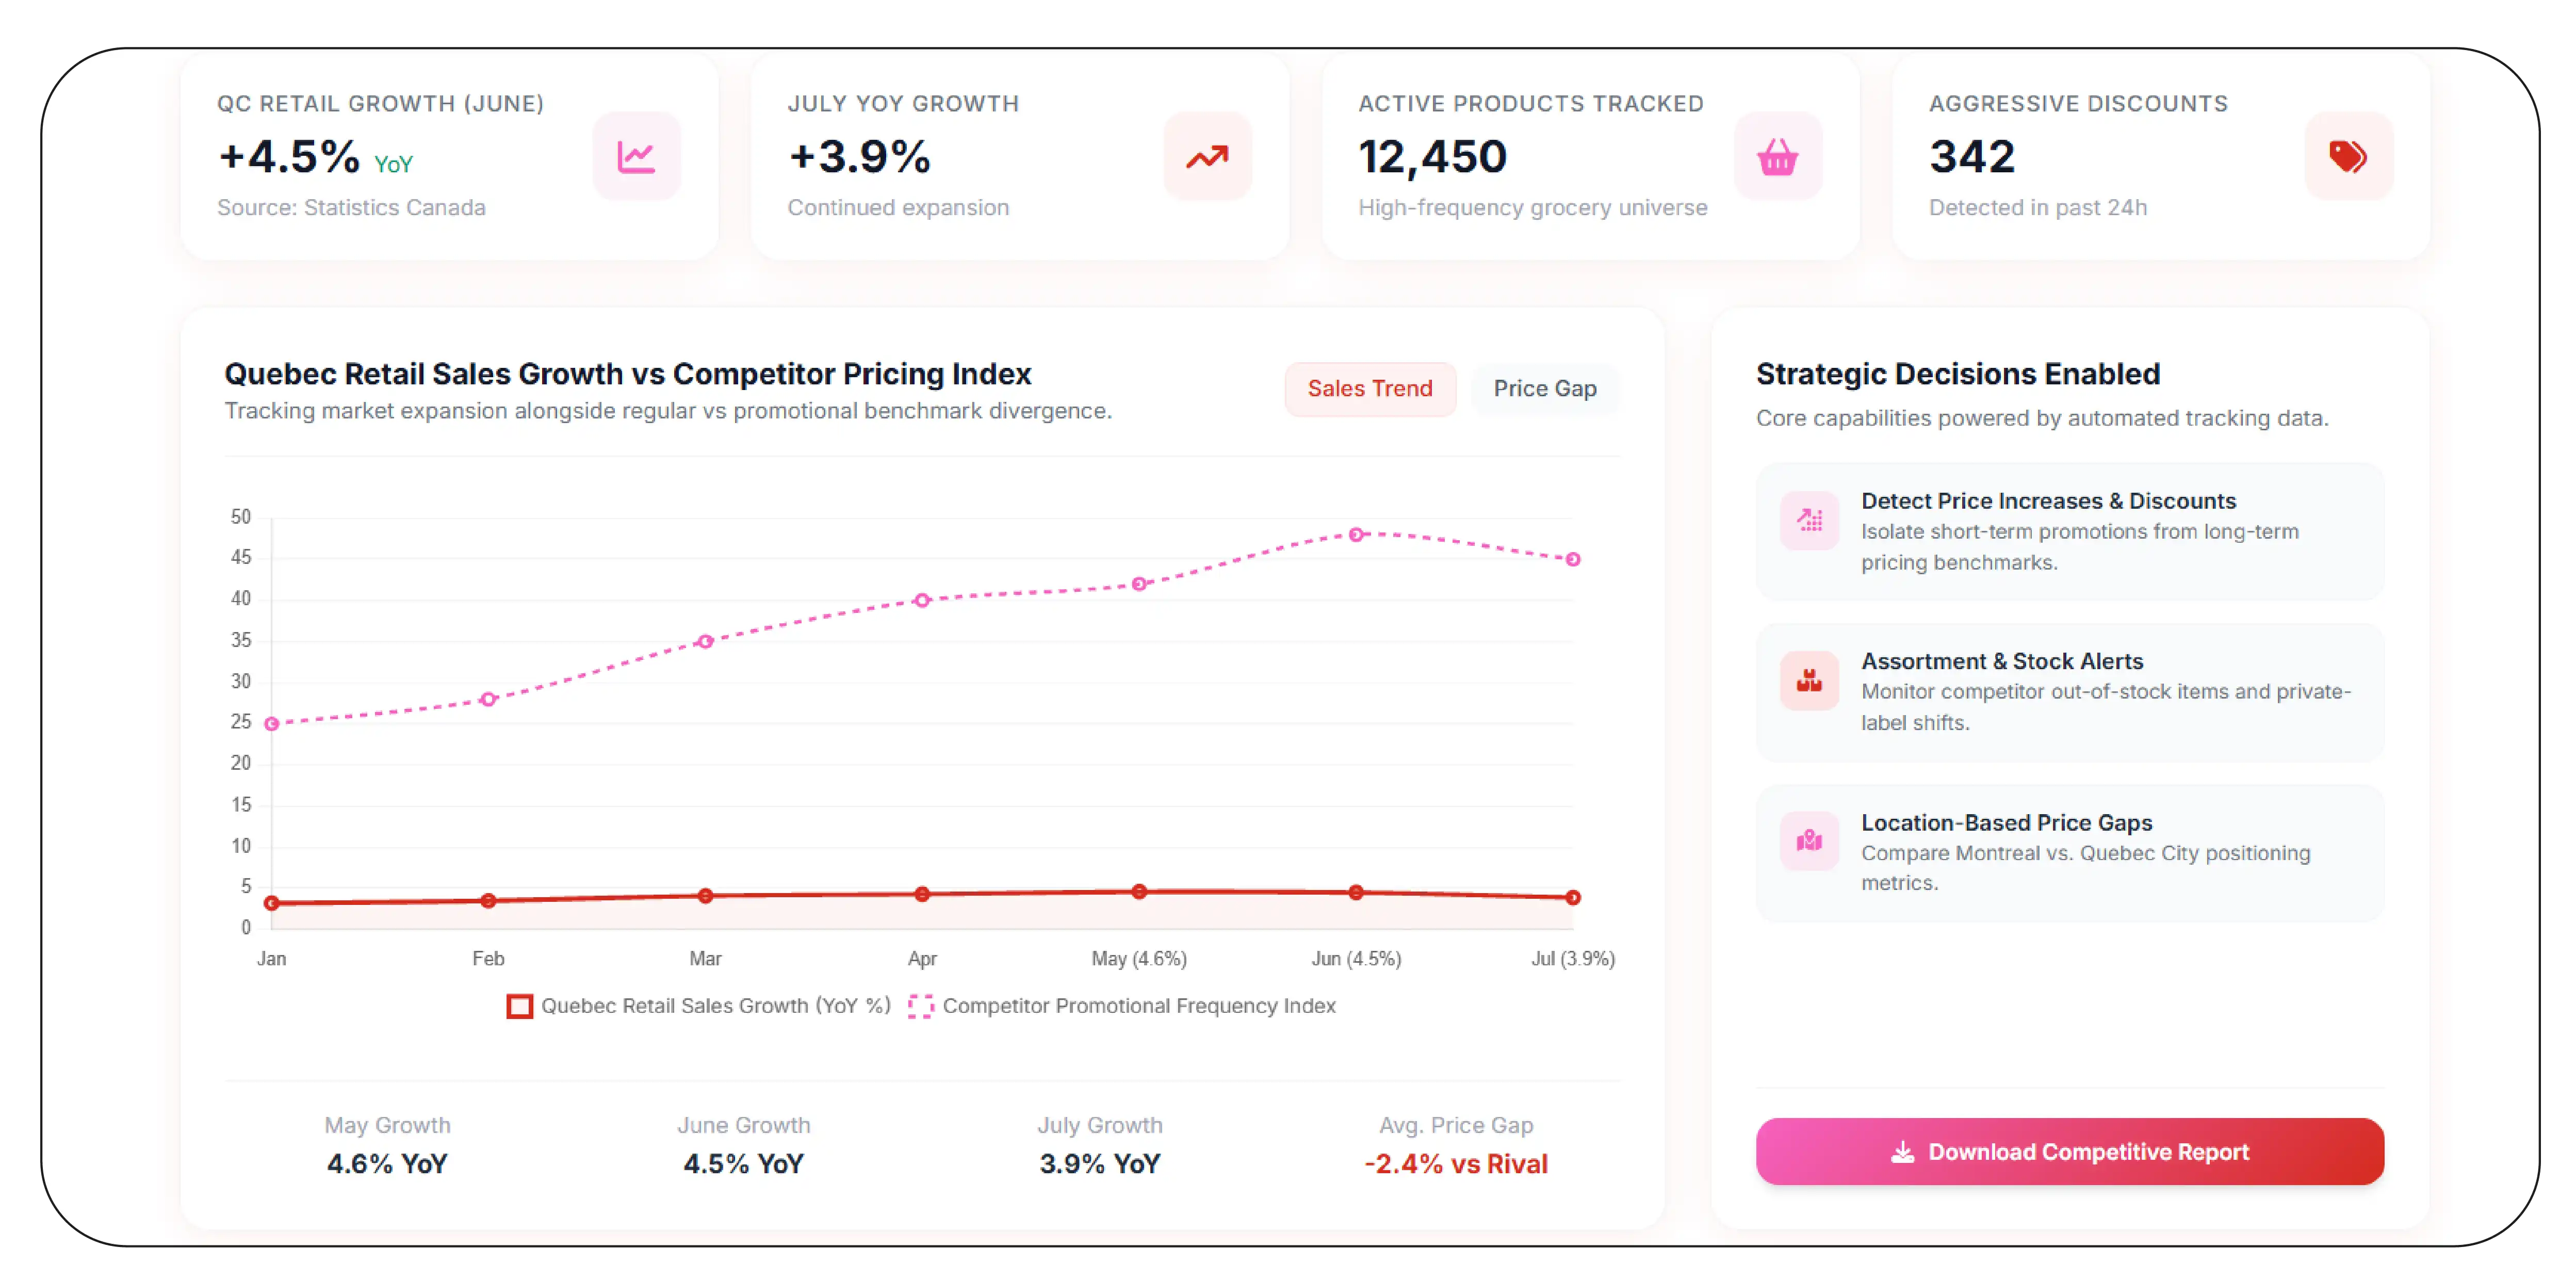
Quebec Grocery Store Price Tracking gives retailers and brands a way to monitor how competitors position similar products across time.
Competitive price monitoring is particularly valuable for high-frequency categories where prices, promotions, and availability can change quickly. Instead of manually checking selected products, businesses can define a product universe and monitor it on a recurring schedule.
The resulting competitive pricing data can support several business decisions:
- Detect competitor price increases
- Identify aggressive discounts
- Compare private-label and branded products
- Monitor promotional frequency
- Detect assortment changes
- Identify products frequently out of stock
- Compare prices by location
- Measure price gaps against competitors
- Build historical competitive dashboards
Statistics Canada data shows that Quebec retail activity continued to expand in 2026. Quebec retail sales were 4.6% higher year over year in May 2026 and 4.5% higher in June 2026, before July recorded 3.9% year-over-year growth. (Statistics Canada)
For businesses, this creates an important distinction between market growth and competitive positioning. Higher sales do not automatically indicate better pricing. Product-level observations are needed to understand what individual retailers are actually offering.
A strong monitoring system should also distinguish regular prices from promotional prices. Otherwise, a short-term sale could incorrectly influence a long-term pricing benchmark.
The best datasets preserve both values and their timestamps. This enables analysts to calculate price gaps, promotion duration, frequency, and retailer-specific patterns.
What Does 2026 Grocery Inflation Mean for Data-Driven Pricing?
Quebec Grocery Inflation Data 2026 provides an important macroeconomic context for product-level monitoring. Official inflation measures show the direction of food prices, while retailer-level datasets can help businesses understand how that direction appears in actual online offers.
Statistics Canada reported that food purchased from stores increased 3.1% year over year in July 2026. Grocery inflation had exceeded headline CPI for 18 consecutive months at that point. (Statistics Canada)
Canada's Food Price Report 2026, published by the Agri-Food Analytics Lab and partner universities, forecast overall Canadian food prices to rise between 4% and 6% during 2026 and estimated that food prices were already 27% higher than five years earlier. It also projected Quebec among the provinces expected to experience increases above the national average. (Welcome to Dalhousie University)
2020–2026 inflation context
| Year |
Selected national grocery-price signal |
What it means for businesses |
| 2020 |
December: +0.5% |
Low year-end grocery inflation |
| 2021 |
December: +5.7% |
Inflation pressure intensified |
| 2022 |
September: +11.4% |
Exceptional grocery price acceleration |
| 2023 |
Annual average: +7.8% |
Elevated food-price environment |
| 2024 |
Growth moderated |
Historical comparison remained important |
| 2025 |
Inflation accelerated again in several months |
Continued monitoring was valuable |
| 2026 |
July: +3.1% |
Prices continued rising despite moderation |
The figures above use Statistics Canada measures for food purchased from stores; they should not be interpreted as a Quebec-specific annual grocery inflation series. Quebec-specific analysis should use the appropriate provincial CPI series and retailer-level observations. (Statistics Canada)
This distinction is important for AEO and AI-readable content because macroeconomic statistics and retailer-specific prices answer different questions. A strong data strategy connects them without treating them as interchangeable.
For a retailer or CPG brand, the practical approach is to combine official inflation benchmarks with current product observations. That combination helps explain whether a competitor's price movement reflects broader inflation, category pressure, or an individual pricing decision.
Why Choose Product Data Scrape?
Grocery data scraping can help businesses build structured datasets for pricing intelligence, competitor monitoring, product benchmarking, assortment analysis, and market research.
A scalable approach can capture product-level attributes, normalize information across retailers, preserve historical observations, and prepare data for dashboards or analytics systems. The emphasis should be on data quality rather than collection volume alone.
A useful delivery structure can include product identifiers, category, brand, pack size, regular price, promotional price, availability, retailer, location, product URL, and timestamp.
For Quebec-focused projects, the collection strategy can be configured around selected retailers, product categories, geographic areas, and refresh intervals. Scrape Canada grocery price data Quebec 2026 becomes more valuable when the resulting dataset is consistent, validated, and ready for comparison.
The objective is to turn continuously changing grocery information into an analytics-ready business asset.
Conclusion
Businesses can use Grocery Inflation Tracking Data together with product-level retailer observations to understand pricing changes from both macro and competitive perspectives.
Scrape Canada grocery price data Quebec 2026 can support a repeatable process for collecting product prices, promotions, availability, pack sizes, and competitor information across defined markets. When this information is timestamped and normalized, businesses can compare historical and current conditions rather than relying on isolated snapshots.
The strongest strategy combines official economic indicators with granular retail observations. This creates a clearer view of price movement, promotional intensity, competitive gaps, and category behavior.
For retailers, CPG brands, marketplaces, and analysts, the goal is not simply to collect grocery data. It is to create a reliable intelligence layer that supports faster and more informed pricing decisions.
Partner with Product Data Scrape to build scalable grocery price datasets for Quebec and turn changing retail prices into actionable competitive intelligence!
FAQs
1. What is the purpose of Scrape Canada grocery price data Quebec 2026?
It helps businesses monitor product prices, discounts, availability, competitors, and historical changes across Quebec's grocery market for pricing and market intelligence.
2. How does E-commerce data scraping in Canada support grocery businesses?
It collects structured online product information such as prices, brands, pack sizes, promotions, availability, and timestamps for recurring competitive analysis.
3. What is Quebec Grocery Market Intelligence 2026?
It combines market indicators, product-level observations, competitor prices, promotions, and historical trends to help businesses understand Quebec's evolving grocery environment.
4. How does Quebec canada Grocery Price Data Scraping improve pricing decisions?
It creates recurring product-level observations that businesses can normalize, compare, timestamp, and analyze across retailers, categories, locations, and periods.
5. How can Quebec canada Grocery Product Benchmarking be performed?
Businesses can normalize comparable products by brand, category, pack size, unit price, promotion, retailer, and location before calculating competitive price differences. Product Data Scrape can also help businesses structure these datasets for recurring monitoring and analytics.


 Singapore
 EMAIL
EMAIL
 PHONE
PHONE















.webp)






