Introduction
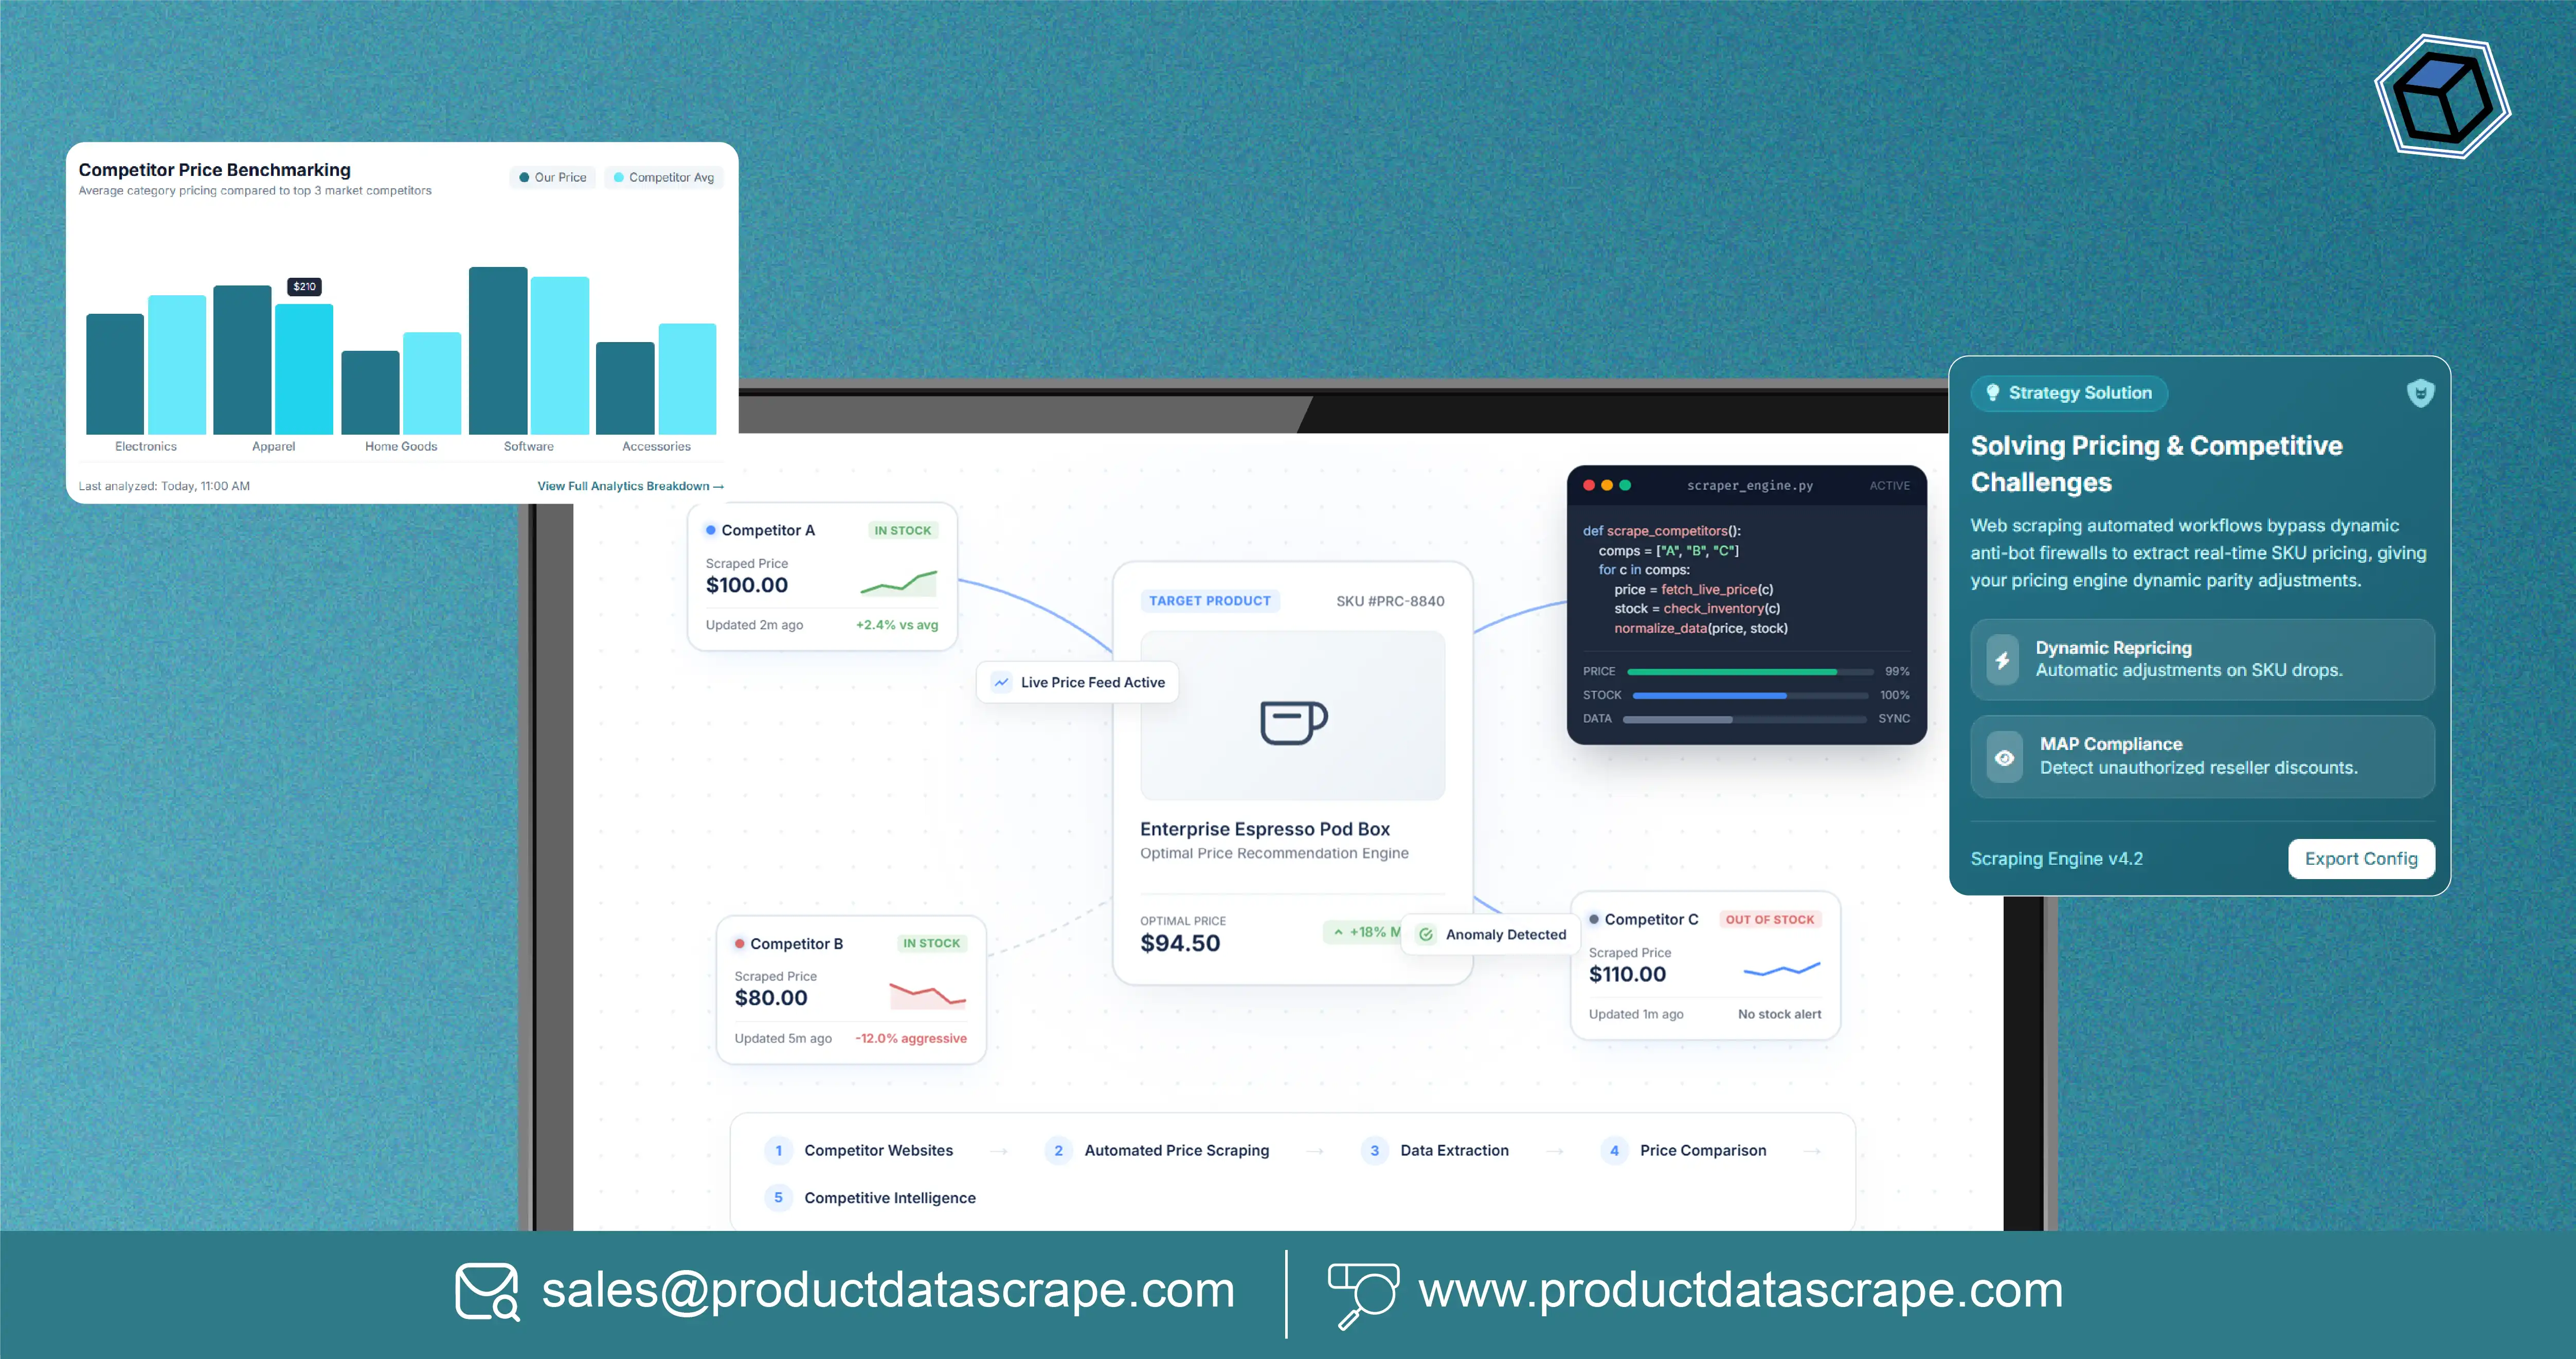
Businesses can solve pricing and competitive intelligence challenges by collecting competitor prices consistently, comparing equivalent products, and analyzing historical price movements. Scrape Competitor Prices data gives retailers, eCommerce brands, marketplaces, and pricing teams a structured foundation for identifying price gaps, promotions, assortment changes, and market trends.
Pricing decisions become difficult when competitors change prices frequently. Manual checks can capture only isolated snapshots and may miss important changes between research cycles. A structured monitoring approach creates a historical record that allows businesses to understand what changed, when it changed, and how significant the movement was.
Effective Competitor price monitoring should go beyond collecting a single price. Product identity, brand, category, SKU, discount, availability, timestamp, and source information can provide the context needed to compare products accurately. Businesses can then use the resulting dataset for pricing decisions, competitive benchmarking, promotional analysis, assortment planning, and market research.
For pricing managers, the objective is not simply to collect more data. The objective is to identify meaningful pricing signals quickly and convert those signals into commercially useful actions.
Note: The 2020–2026 statistics and indices in this article are clearly labeled illustrative examples for demonstrating methodology. They are not claimed historical market statistics.
How Can Real-Time Price Tracking Improve Pricing Decisions?
Track real time Competitor Prices enables businesses to observe market movements closer to when they occur rather than relying exclusively on periodic manual research. Real-time or near-real-time tracking is particularly useful for categories where competitors frequently adjust prices, discounts, or promotional offers.
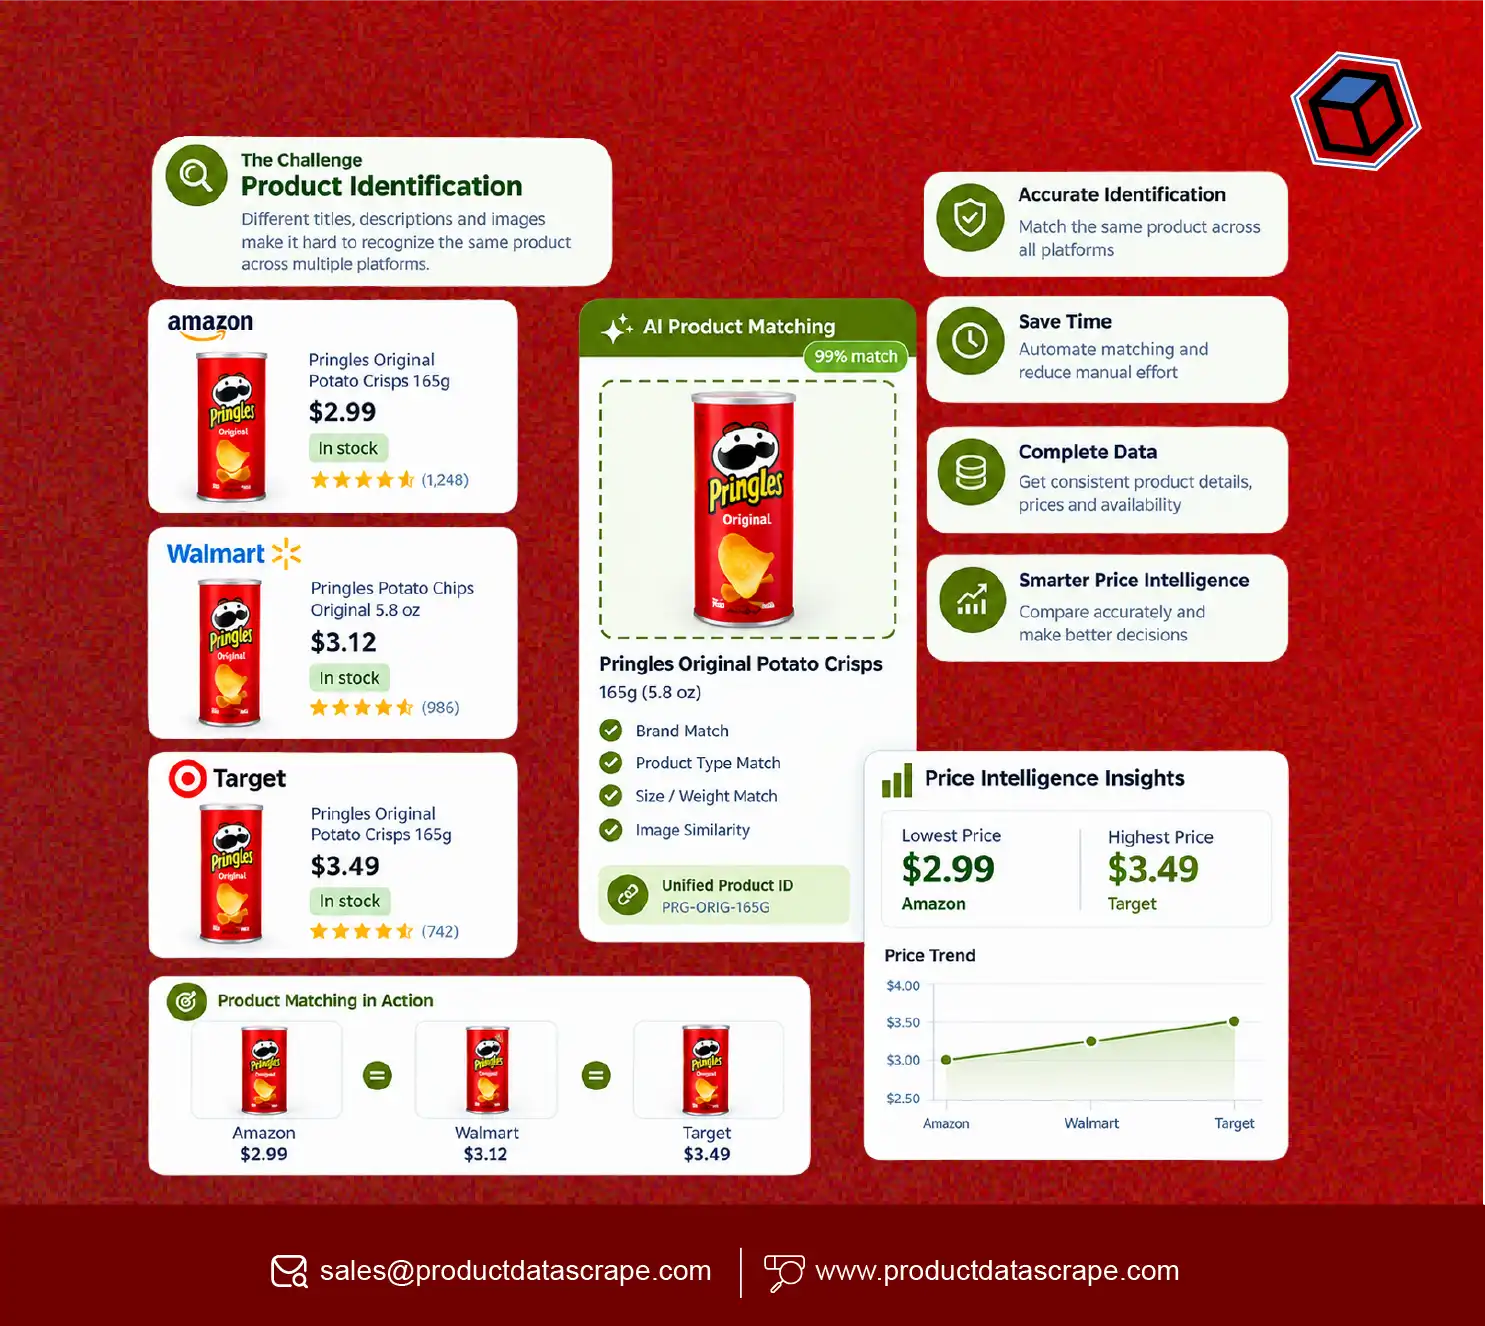
A useful system begins by defining comparable products. Product matching should consider SKU, brand, model, size, pack quantity, variant, and other relevant attributes. Without proper matching, a pricing dashboard may compare products that appear similar but have different specifications.
Once comparable products are identified, price changes can be calculated against previous observations. A business might classify movements as minor, moderate, or significant based on its own commercial thresholds. This allows pricing teams to prioritize products requiring investigation.
Pricing strategy services can use these structured observations to support price benchmarking, promotional planning, and competitive positioning. Instead of reacting to every small movement, teams can establish rules that highlight material changes.
Illustrative Price Intelligence Development
| Year |
Illustrative Price Intelligence Index* |
Primary Capability |
| 2020 |
100 |
Manual price research |
| 2021 |
109 |
Product-level comparison |
| 2022 |
121 |
Competitor benchmarking |
| 2023 |
135 |
Historical price analysis |
| 2024 |
151 |
Automated change detection |
| 2025 |
170 |
Real-time dashboards |
| 2026 |
190 |
Advanced pricing intelligence |
*Illustrative index only.
The business value comes from speed and context. If a competitor reduces a comparable product by 8%, the pricing team can investigate the movement while it is commercially relevant. Combining price data with availability and promotion indicators can also prevent incorrect conclusions.
Real-time monitoring does not necessarily mean collecting every product every minute. The appropriate frequency depends on category volatility, business objectives, source accessibility, and the cost-benefit of additional collection cycles.
How Can Weekly Monitoring Reveal Competitive Price Trends?
Scrape Competitor Prices Weekly when a business needs consistent historical visibility without requiring extremely frequent monitoring. Weekly tracking can be suitable for categories where prices change regularly but not minute-by-minute.
A weekly dataset creates comparable snapshots across time. Businesses can calculate week-over-week price changes, identify products with repeated movements, and determine whether competitors are maintaining stable price positions or frequently adjusting their offers.
The key advantage is trend identification. One price reduction may be temporary, but repeated reductions across several weeks can indicate a broader competitive movement. Similarly, repeated promotions may reveal a competitor's recurring commercial strategy.
Illustrative Weekly Monitoring Trend
| Year |
Weekly Tracking Index* |
Example Business Use |
| 2020 |
100 |
Periodic manual checks |
| 2021 |
108 |
Weekly SKU comparison |
| 2022 |
119 |
Category benchmarking |
| 2023 |
133 |
Price trend analysis |
| 2024 |
148 |
Promotion comparison |
| 2025 |
166 |
Automated weekly reporting |
| 2026 |
184 |
Trend-driven pricing workflows |
*Illustrative index only.
Weekly monitoring can also help businesses build price histories. Historical records allow analysts to calculate average prices, minimum and maximum observed prices, median positioning, and percentage movements.
For example, if a product's price changes from ₹1,000 to ₹950 and then ₹900 across successive weekly observations, the business can identify a sustained downward movement rather than treating each change as an isolated event.
This approach is useful for retailers and brands with large catalogs because it balances monitoring coverage with analytical practicality. Businesses can prioritize high-value products, important categories, strategic competitors, or products with historically volatile prices.
The dataset can also support management reporting. Instead of presenting thousands of raw product records, dashboards can highlight the largest weekly increases, largest decreases, products entering promotional periods, and categories showing the greatest price volatility.
Why Does Daily Monitoring Matter for Fast-Changing Categories?
Daily Competitor Price Monitoring is valuable when pricing and promotional conditions can change rapidly. Online retailers may update prices, discounts, inventory status, or promotional messaging frequently, creating gaps between manual research cycles.
Daily collection provides a higher-resolution historical record. It enables businesses to identify changes that may disappear before a weekly or monthly review. This is particularly relevant for high-volume eCommerce categories, promotional events, electronics, consumer goods, travel-related products, and other dynamic markets.
Daily monitoring should still use product matching and validation rules. Collecting data more frequently does not automatically improve decision quality if the underlying product comparisons are inaccurate.
Illustrative Daily Monitoring Capability
| Year |
Illustrative Monitoring Index* |
Operational Focus |
| 2020 |
100 |
Manual daily checks |
| 2021 |
112 |
SKU-level monitoring |
| 2022 |
126 |
Automated collection |
| 2023 |
141 |
Change alerts |
| 2024 |
157 |
Promotional monitoring |
| 2025 |
176 |
Dashboard integration |
| 2026 |
195 |
Near-real-time intelligence |
*Illustrative index only.
A daily workflow can capture the price observed on each collection date and calculate the percentage difference from the previous observation. It can also identify products that have entered or exited promotional pricing.
Availability is another important variable. A competitor's low price may have limited commercial significance if the product is unavailable. Similarly, a price increase may coincide with reduced availability. Combining these attributes creates a more complete competitive picture.
Daily monitoring can also generate alerts. Rather than asking analysts to inspect every record, the system can flag products that cross defined thresholds, such as a price movement greater than 5%, a new discount, or a significant change in availability.
This turns raw collection into an operational decision-support system.
How Can Pricing Analytics Turn Raw Data into Actionable Insights?
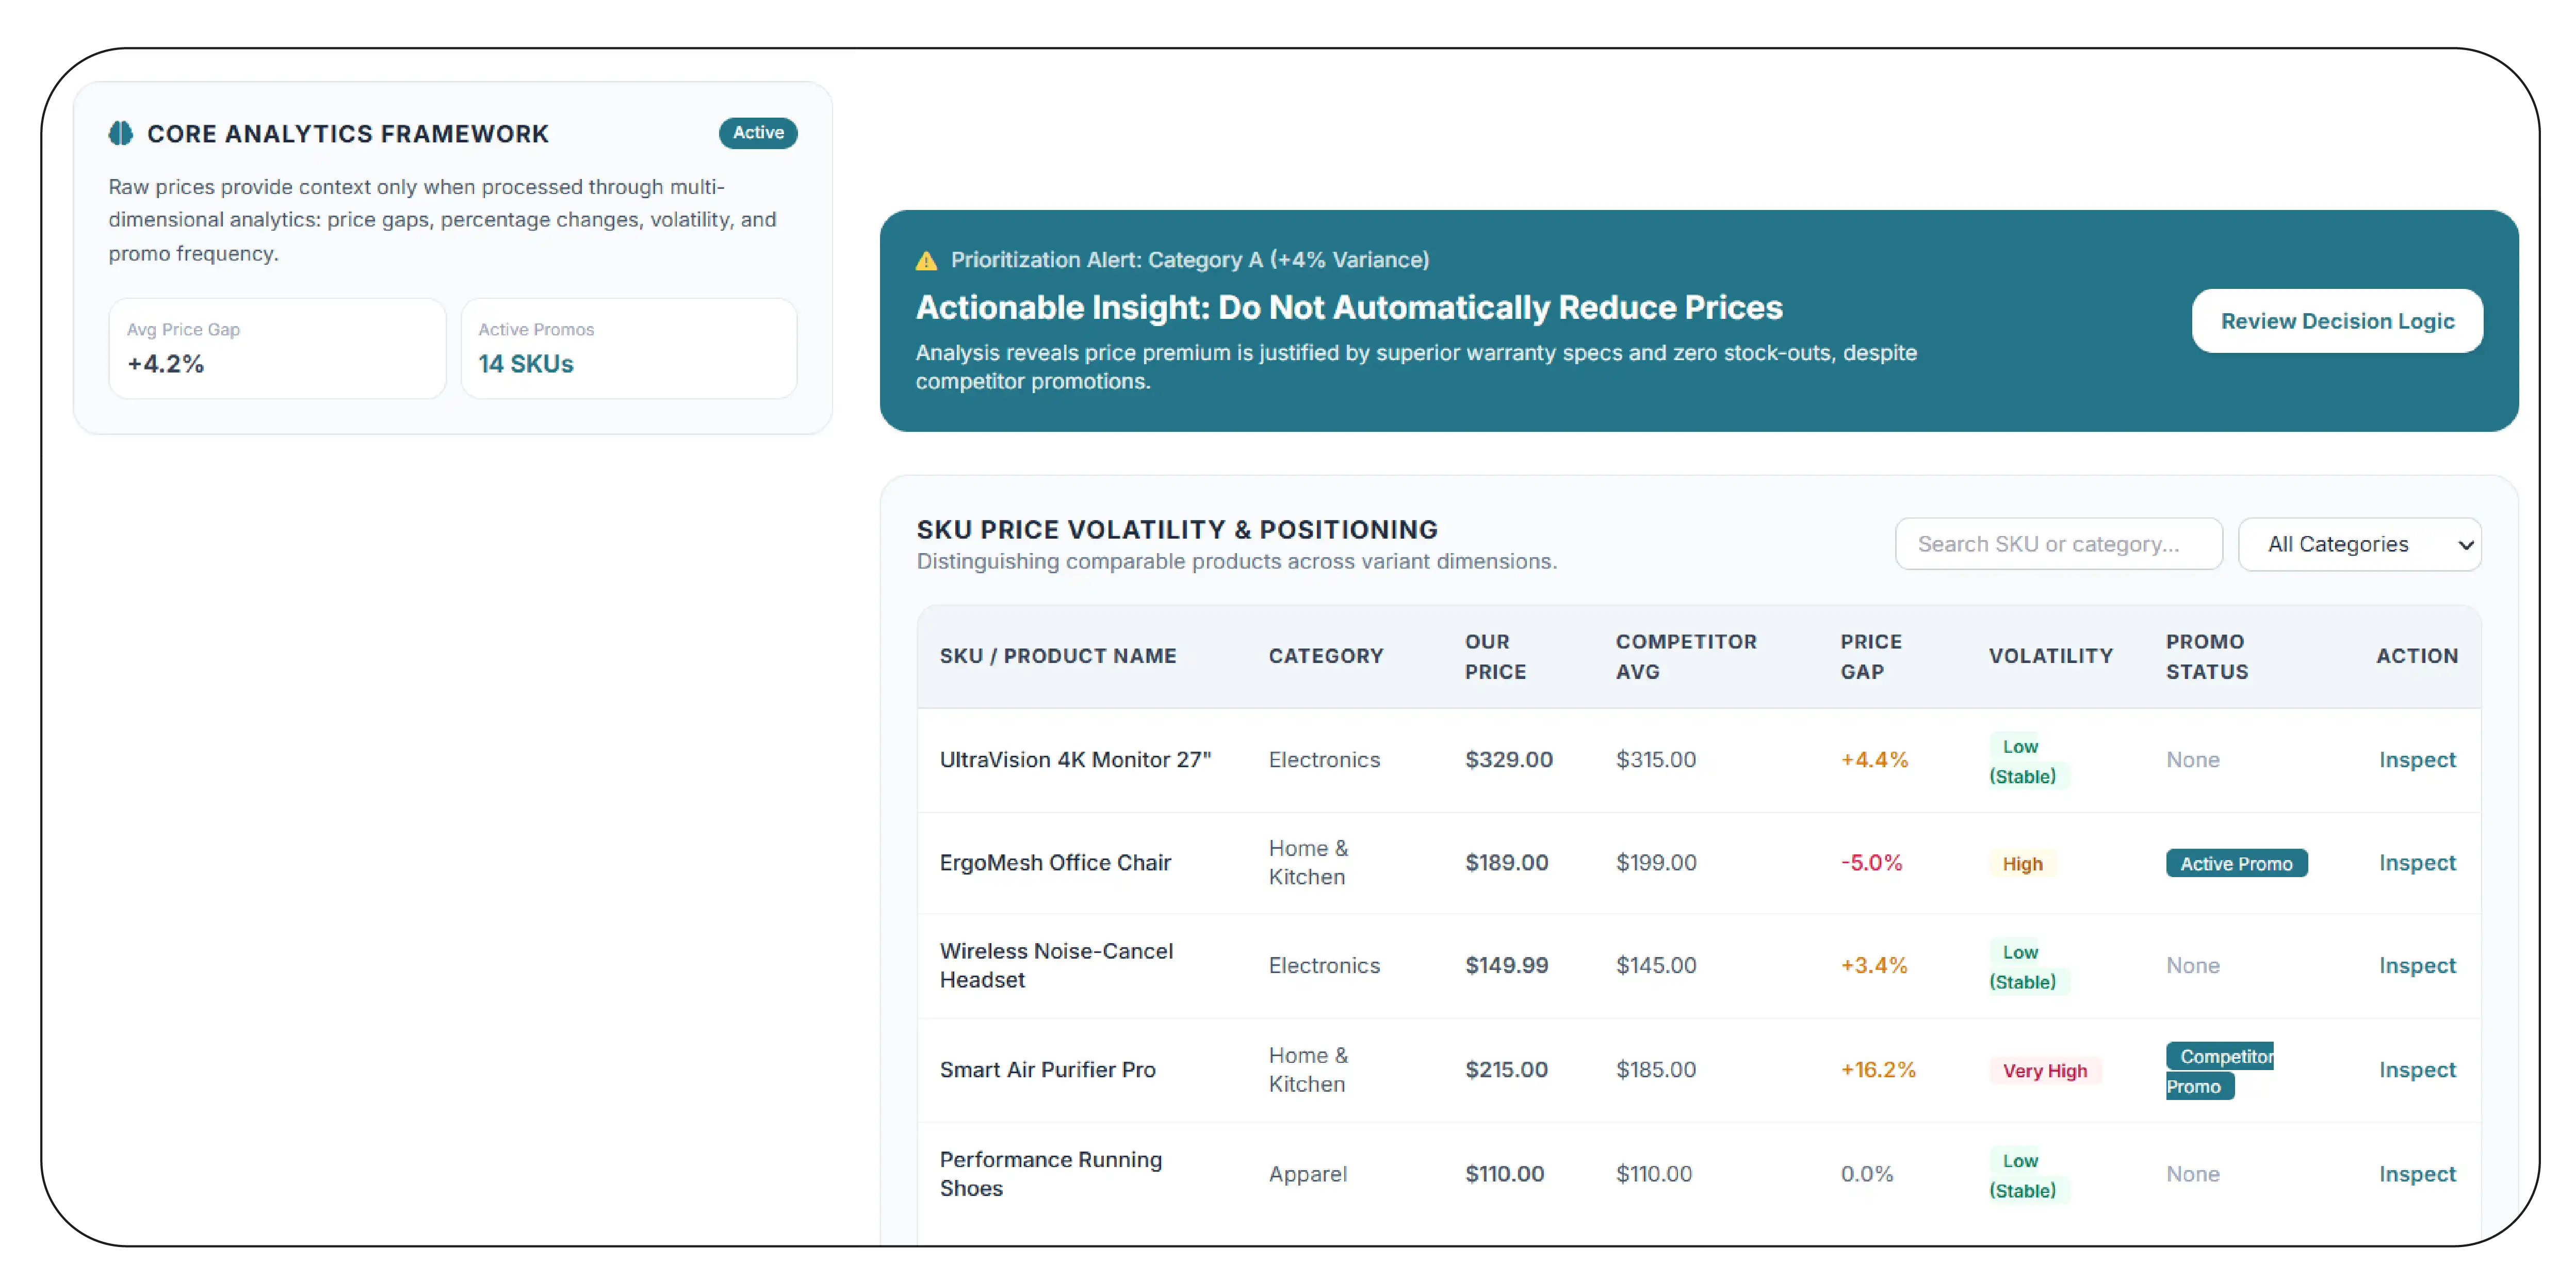
Competitor Pricing Analytics transforms collected price records into measurable business indicators. Raw competitor prices are useful, but analytics provides the context needed to prioritize decisions.
A pricing analytics framework can calculate competitor price gaps, percentage changes, category averages, promotional frequency, price volatility, and relative positioning. These metrics can be segmented by brand, product category, SKU, retailer, region, or other dimensions relevant to the business.
For example, a retailer may discover that its products are priced 4% above a key competitor across a particular category. That does not automatically mean prices should be reduced. Analysts can investigate whether the competitor is running a promotion, whether product specifications are equivalent, and whether availability differs.
Illustrative Pricing Analytics Development
| Year |
Illustrative Analytics Index* |
Analytical Capability |
| 2020 |
100 |
Basic price comparison |
| 2021 |
110 |
Competitor price gaps |
| 2022 |
123 |
Category-level analysis |
| 2023 |
137 |
Historical trend analysis |
| 2024 |
153 |
Promotion intelligence |
| 2025 |
173 |
Automated dashboards |
| 2026 |
192 |
Advanced decision intelligence |
*Illustrative index only.
Another useful indicator is price volatility, which measures how frequently or substantially a product's observed price changes. High volatility can justify more frequent monitoring, while stable products may require less frequent collection.
Pricing analytics should always distinguish between comparable products. Pack size, model, specification, variant, and promotion status can materially affect the validity of a comparison.
The ultimate objective is prioritization. Analytics should help teams determine which products require attention instead of overwhelming them with undifferentiated data.
How Can Automation Make Competitive Price Tracking More Scalable?
Automated Competitor Price Tracking allows businesses to establish repeatable workflows for collecting, validating, processing, and analyzing competitor pricing information. Automation is particularly valuable for large catalogs where manual monitoring becomes difficult to maintain.
An automated workflow can begin with a defined list of competitor websites, marketplaces, categories, or products. The collection layer captures relevant product attributes, while a processing layer normalizes names, prices, identifiers, and other fields.
A validation layer can check for missing values, unexpected price changes, duplicate products, and other anomalies. Historical storage then preserves each observation for trend analysis.
Illustrative Automation Maturity
| Year |
Illustrative Automation Index* |
Workflow Stage |
| 2020 |
100 |
Spreadsheet-based tracking |
| 2021 |
114 |
Semi-automated collection |
| 2022 |
129 |
Scheduled scraping |
| 2023 |
145 |
Automated validation |
| 2024 |
162 |
Change alerts |
| 2025 |
181 |
API and dashboard integration |
| 2026 |
200 |
Intelligent monitoring workflows |
*Illustrative index only.
Automation can also reduce repetitive operational work. Analysts do not need to manually visit every competitor page whenever a scheduled collection can gather the required information.
However, automation should not be treated as a substitute for data quality. Product matching, source changes, missing fields, and unusual values still require appropriate validation rules.
A scalable workflow can support different frequencies for different products. Strategic SKUs may be monitored daily, while lower-priority products can be checked weekly. This creates a more efficient allocation of collection resources.
Automated alerts can further improve responsiveness. Teams can receive notifications when a competitor crosses a specified price threshold, launches a promotion, changes availability, or introduces a new product.
The result is a monitoring system designed around business priorities rather than a simple data collection process.
How Can eCommerce Brands Use Competitor Pricing to Strengthen Market Positioning?
eCommerce Brand Track Competitor Prices workflows help brands understand how their products are positioned relative to relevant competitors. For brands operating across multiple retailers and marketplaces, this visibility can become increasingly important as product catalogs expand.
A brand may need to monitor the same SKU across several competitors while accounting for product variants, pack sizes, promotions, and availability. A structured dataset can consolidate these observations into a single analytical view.
This enables teams to identify products where competitors are consistently cheaper, products where the brand maintains a price advantage, and categories with frequent competitive movements.
Illustrative Brand Monitoring Progress
| Year |
Illustrative Brand Intelligence Index* |
Primary Business Outcome |
| 2020 |
100 |
Basic competitor research |
| 2021 |
111 |
SKU benchmarking |
| 2022 |
124 |
Cross-retailer comparison |
| 2023 |
139 |
Promotional monitoring |
| 2024 |
155 |
Assortment intelligence |
| 2025 |
175 |
Automated competitive alerts |
| 2026 |
194 |
Integrated pricing intelligence |
*Illustrative index only.
Brands can also combine pricing information with assortment and availability data. A competitor may offer a lower price but have limited stock, while another competitor may have a broader assortment at a different price point. These differences can materially change the competitive interpretation.
The resulting dataset can support pricing reviews, retailer negotiations, assortment decisions, promotional planning, and market research.
A useful operating model is to create priority tiers. High-revenue products, strategic SKUs, highly competitive categories, and products with frequent price movements can receive more frequent monitoring. Stable, lower-priority products can be monitored less frequently.
This approach allows eCommerce brands to scale competitive intelligence without treating every SKU as equally important.
Why Choose Product Data Scrape?
A strong competitor pricing program requires more than collecting product prices. Assortment and availability monitoring adds essential context by showing whether a competitor's product is actually visible and available when the observed price is recorded. This helps businesses avoid interpreting price movements without understanding the surrounding market conditions.
A structured workflow can combine product identification, price history, discount information, availability, timestamps, and competitor references into a reusable dataset. Validation and normalization improve comparison quality, while automated collection supports recurring monitoring.
The approach can be adapted to different industries, catalog sizes, monitoring frequencies, and analytical objectives. Businesses can then use the resulting intelligence for pricing reviews, competitive benchmarking, promotional analysis, assortment planning, and market research.
Conclusion
Businesses can build stronger competitive pricing strategies by combining consistent collection, accurate product matching, historical tracking, and actionable analytics. Demand & Trend Intelligence adds another layer by helping teams understand how pricing movements interact with broader product and market changes.
Scrape Competitor Prices data to identify price gaps, promotional movements, competitor positioning, and changing market conditions. The most effective approach is not simply to collect the maximum amount of information but to monitor the products and competitors that matter most to business performance.
A scalable workflow can combine daily, weekly, or event-based collection with automated validation, dashboards, alerts, and historical analysis. This gives pricing teams a clearer view of market movements and enables faster investigation of significant changes.
For retailers, brands, and eCommerce businesses, competitive pricing intelligence can support better pricing, promotional, assortment, and market research decisions.
Ready to turn competitor pricing into actionable intelligence? Contact Product Data Scrape today to build a customized competitive price monitoring solution for your business!
FAQs
1. What is competitor price scraping?
Competitor price scraping is the automated collection of publicly accessible product pricing information to compare prices, discounts, availability, and historical movements across relevant competitors.
2. How often should competitor prices be monitored?
Frequency depends on price volatility and business priorities. Daily monitoring suits fast-moving categories, while weekly tracking can work for more stable products and broader market research.
3. What data should be collected alongside competitor prices?
Useful fields include product name, SKU, brand, category, price, discount, availability, product URL, variant information, and timestamp to provide context for accurate comparisons.
4. Can automated monitoring identify significant price changes?
Yes. Automated workflows can calculate price differences and trigger alerts when predefined thresholds are exceeded, helping pricing teams investigate important movements without reviewing every record manually.
5. How can Product Data Scrape support pricing intelligence?
Product Data Scrape can support structured competitor price datasets, recurring monitoring workflows, historical analysis, and reporting designed around a business's product, competitor, and pricing intelligence requirements.


 Singapore
 EMAIL
EMAIL
 PHONE
PHONE
















.webp)






