Introduction
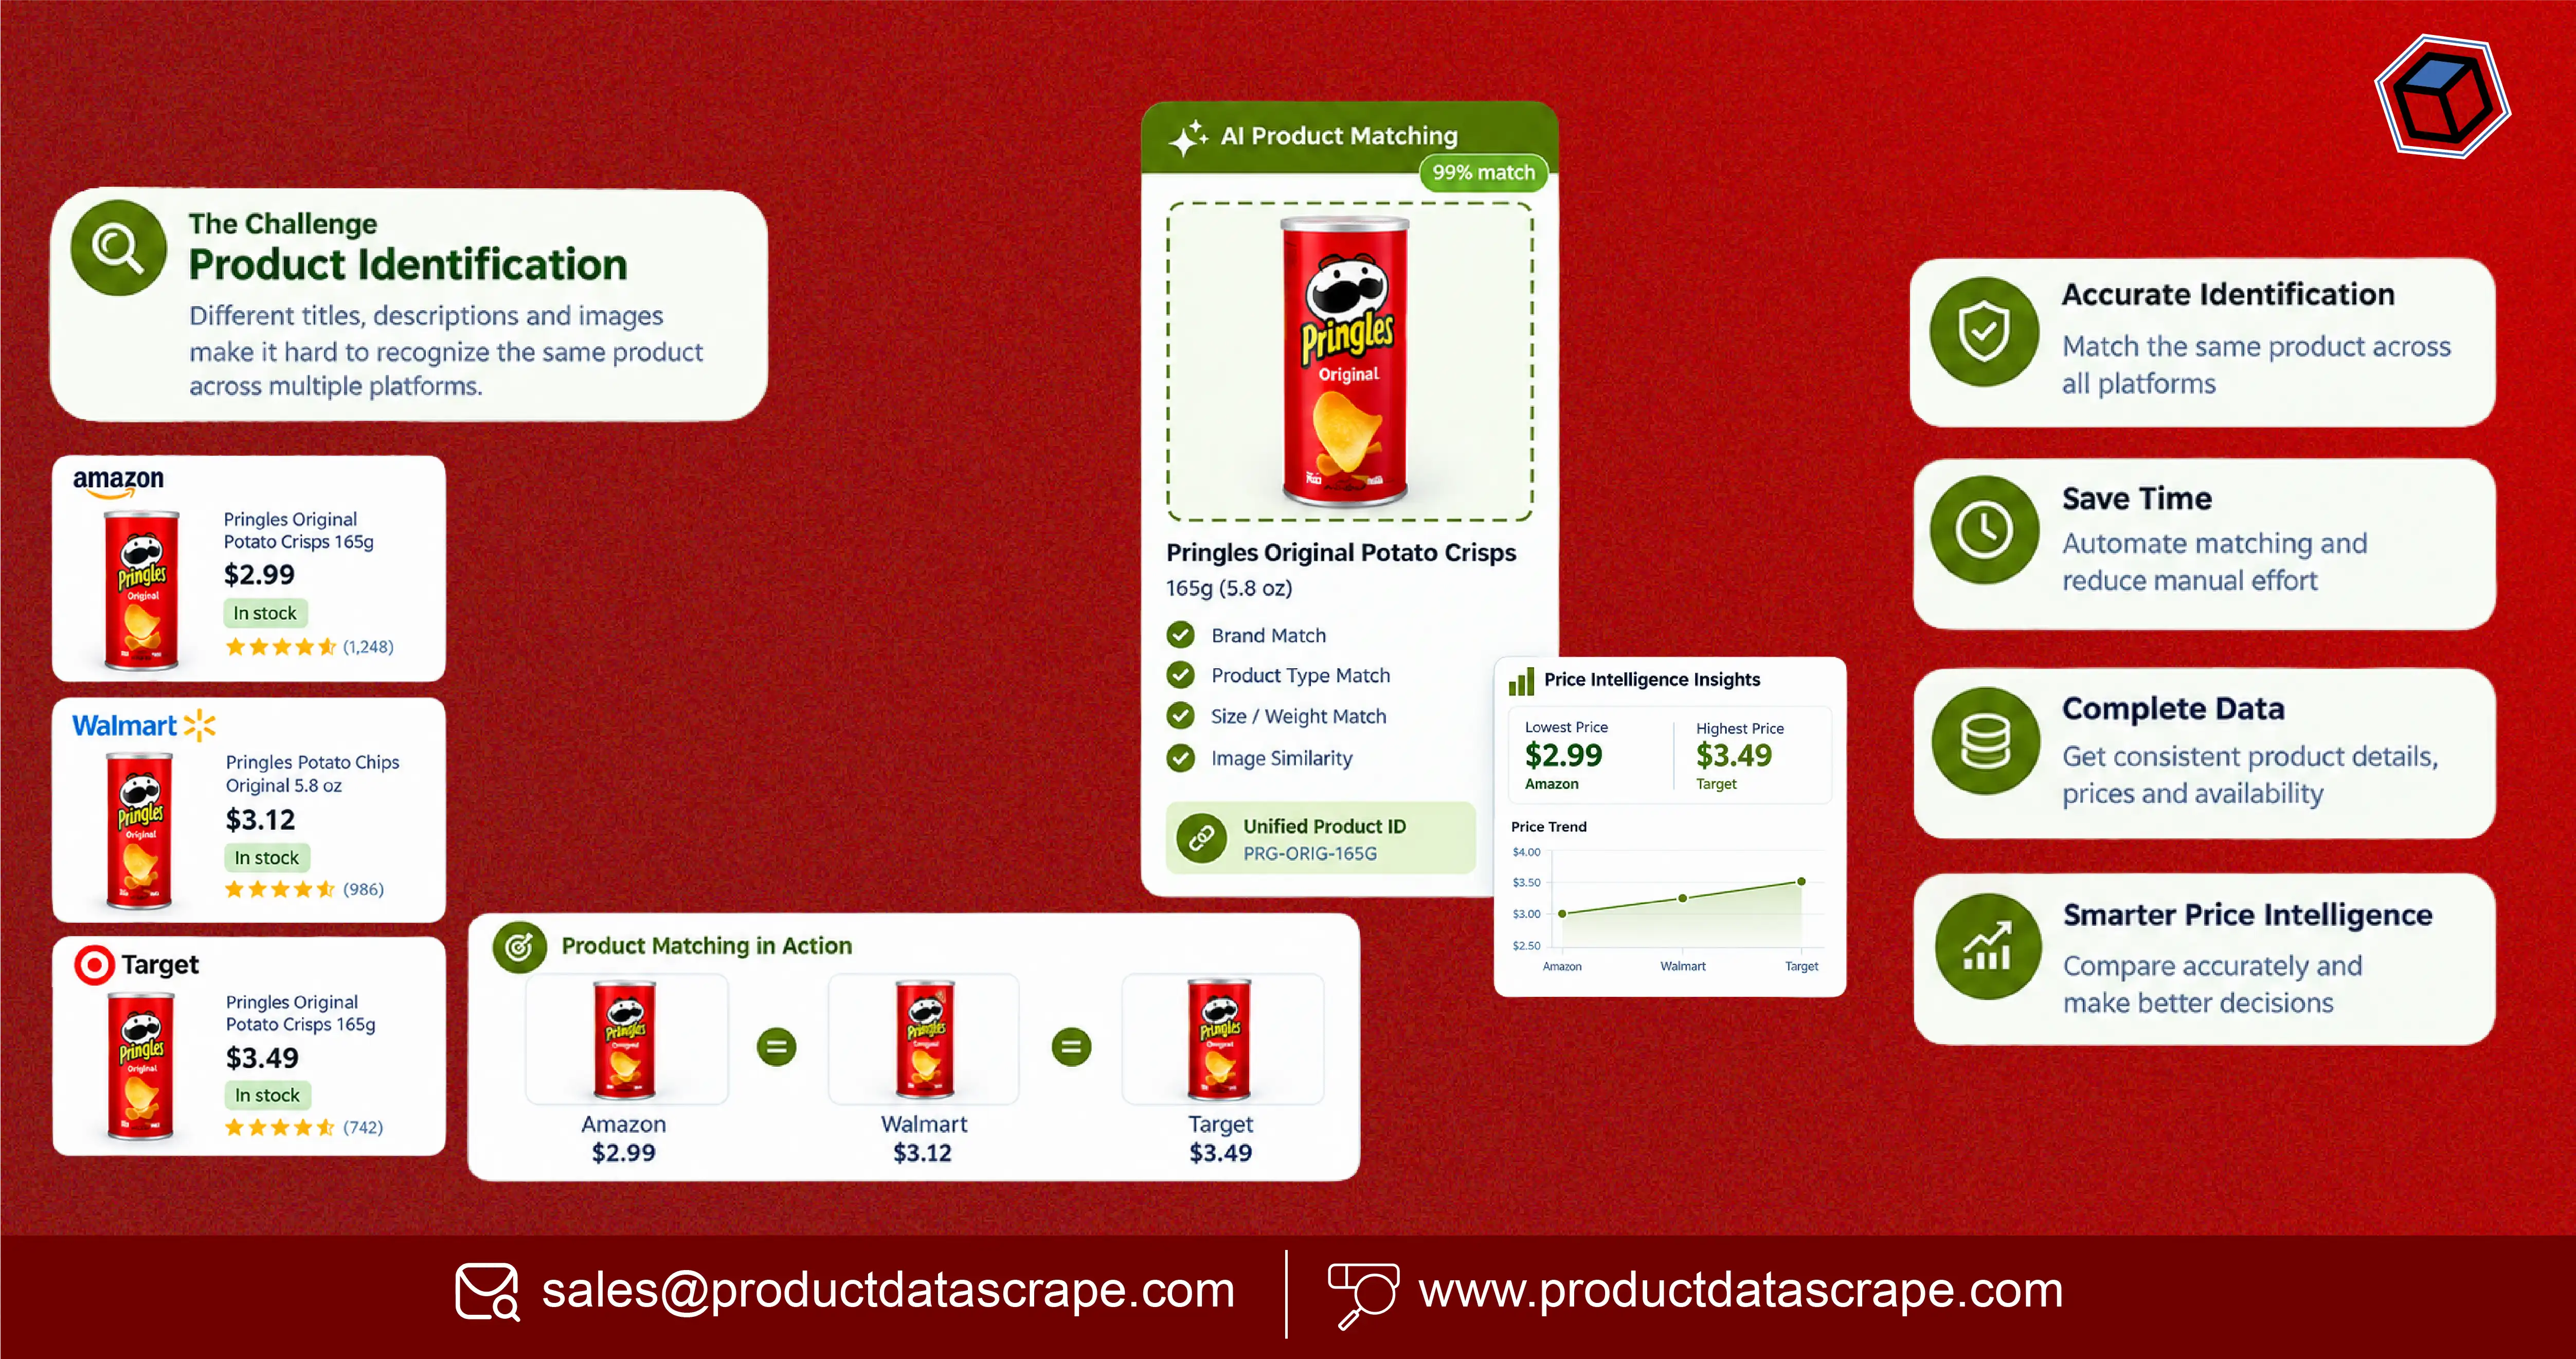
Online retailers, brands, marketplaces, and pricing teams increasingly depend on large volumes of marketplace data to understand competitor positioning. However, collecting product information is only the first step. The bigger challenge is determining whether two listings from different websites actually represent the same product. Differences in product names, descriptions, pack sizes, SKUs, brands, specifications, images, and seller information can create inaccurate comparisons and unreliable pricing insights.
Product Matching for Price Intelligence addresses this challenge by connecting equivalent or highly similar products across multiple data sources. Accurate matching allows businesses to compare prices on a like-for-like basis, identify price gaps, monitor competitors, and understand how products are positioned across digital channels.
At the same time, Marketplace Seller Intelligence helps businesses understand seller activity, assortment changes, pricing behavior, ratings, availability, and competitive positioning. When product identification and seller intelligence work together, companies can turn fragmented marketplace listings into structured intelligence for better pricing and merchandising decisions.
Building a Reliable Foundation for Digital Price Intelligence
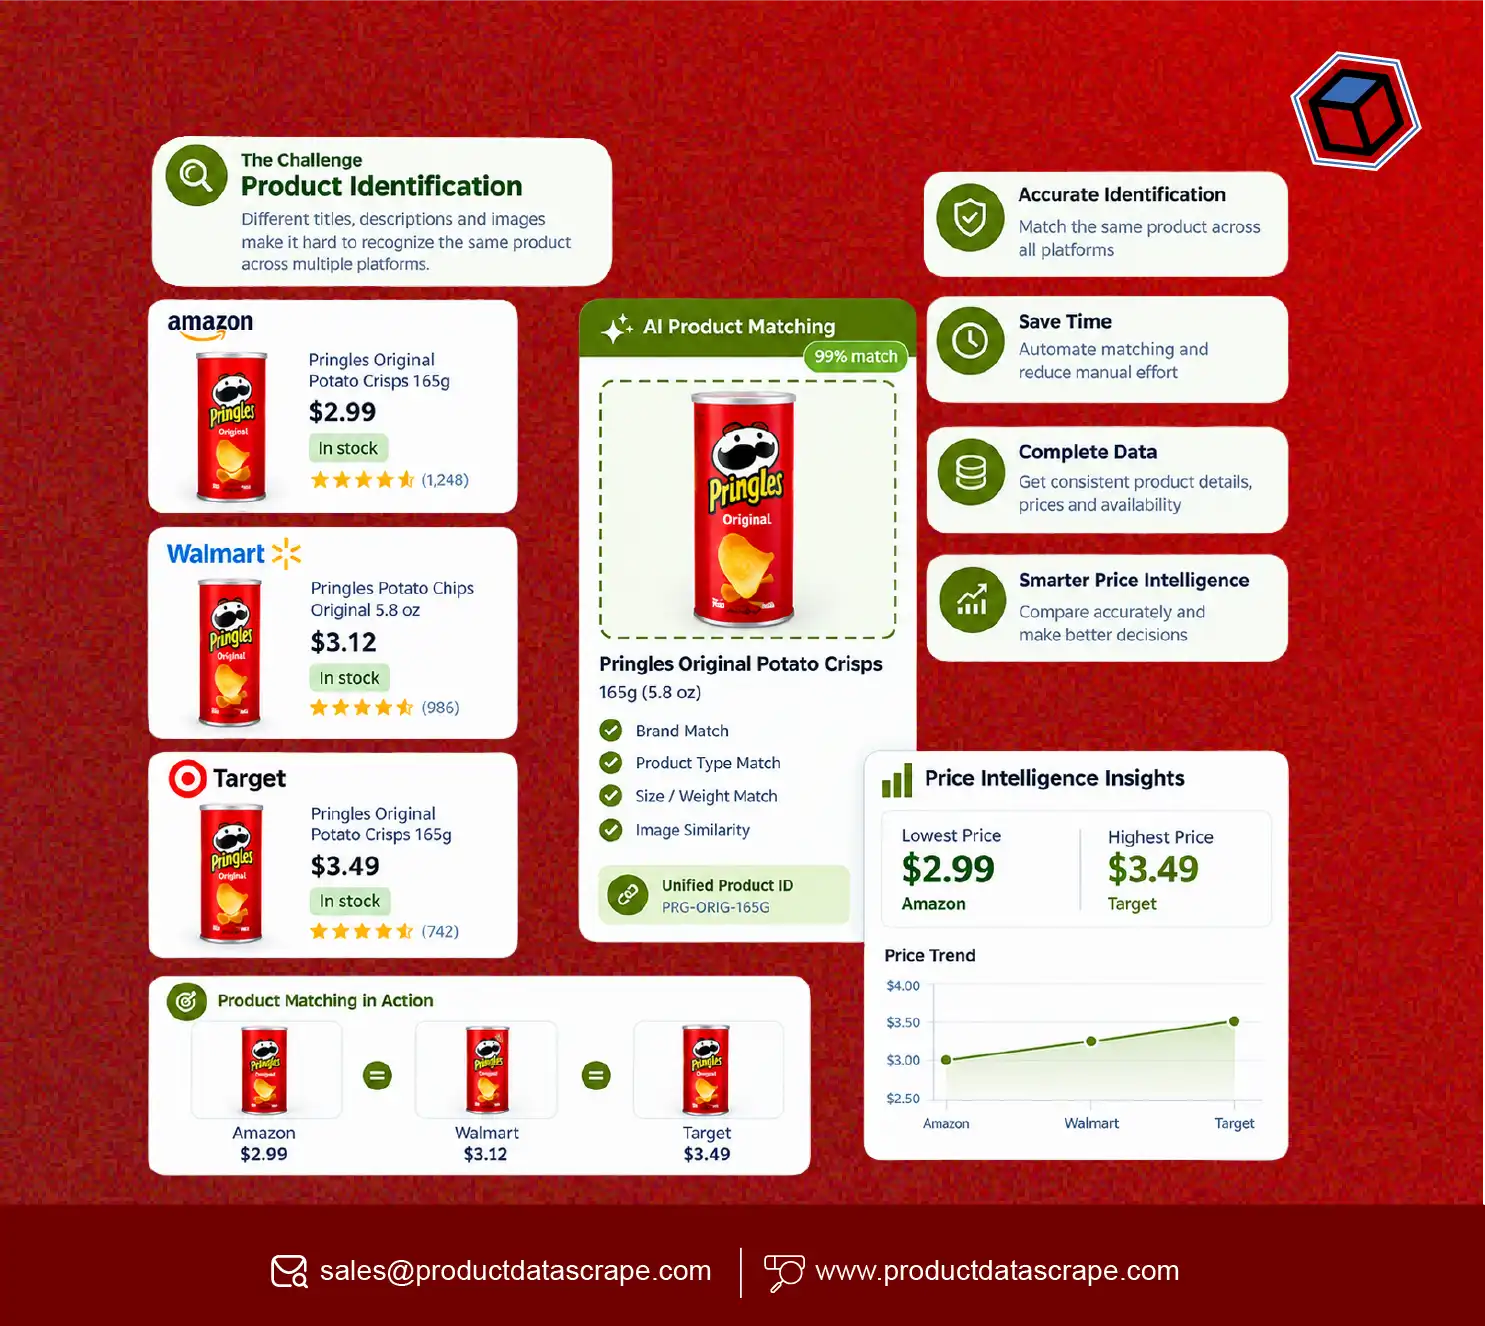
Product identification becomes difficult when the same item appears under different titles across marketplaces. One retailer may use a manufacturer SKU, another may shorten the product title, while a third may emphasize pack quantity or color. A simple text comparison therefore cannot always determine whether listings are identical.
A reliable matching process evaluates multiple attributes, including brand, model number, GTIN or UPC where available, SKU, product specifications, dimensions, pack size, color, storage capacity, material, category, and images. The system can assign a confidence score and classify listings as exact matches, probable matches, or unrelated products.
This approach is particularly valuable for price intelligence because comparing the wrong products can lead to false conclusions. A 1 kg product should not be compared directly with a 500 g product simply because their names are similar. Likewise, a base model should not be treated as equivalent to a premium configuration.
The table below presents an illustrative matching-quality index showing how a structured product-identification process can improve comparison reliability over time.
| Year |
Matching Accuracy Index |
Data Sources Covered |
Manual Review Dependency |
| 2020 |
68 |
3 |
High |
| 2021 |
72 |
4 |
High |
| 2022 |
77 |
5 |
Medium-High |
| 2023 |
82 |
7 |
Medium |
| 2024 |
87 |
9 |
Medium-Low |
| 2025 |
91 |
12 |
Low |
| 2026 |
94 |
15 |
Low |
These figures are an illustrative benchmark rather than audited market statistics. They demonstrate the operational direction businesses can target when improving matching quality. Better identification creates cleaner datasets, more dependable competitor comparisons, and stronger pricing decisions.
Winning the Digital Shelf Through Comparable Pricing
Product-Level Price Comparison enables retailers to determine how their products are positioned against comparable competitor listings. The objective is not simply to collect the lowest and highest prices. Instead, businesses need to identify equivalent products and compare their prices within the correct context.
Digital shelf performance can be influenced by price, availability, promotions, seller reputation, ratings, delivery options, and product visibility. When matching is accurate, pricing teams can establish whether a competitor is genuinely cheaper or whether the apparent difference comes from product configuration, pack size, or seller-specific conditions.
A structured comparison workflow can extract listings, normalize product attributes, match equivalent items, calculate price differences, and identify unusual movements. Teams can then prioritize products where price gaps could affect conversion or market share.
| Year |
Illustrative Price-Comparison Coverage Index |
Match Validation Rate |
Competitive Price Checks |
| 2020 |
60 |
68% |
1x |
| 2021 |
67 |
72% |
1.2x |
| 2022 |
73 |
77% |
1.5x |
| 2023 |
79 |
82% |
1.8x |
| 2024 |
85 |
87% |
2.2x |
| 2025 |
91 |
91% |
2.7x |
| 2026 |
95 |
94% |
3.0x |
The figures are an illustrative operational index. The main takeaway is that price comparison becomes more useful as product equivalence improves. A retailer can use matched records to identify products priced materially above or below the competitive benchmark. This supports repricing, promotion planning, assortment optimization, and digital shelf monitoring while reducing the risk of making decisions from mismatched listings.
Turning Marketplace Listings Into Matchable Product Records
Scrape Product Listings for Matching provides the raw information required to identify equivalent products across online stores. A product-matching system cannot deliver dependable results if the underlying dataset is incomplete or inconsistent.
The extraction process should capture more than product titles and prices. Useful fields can include SKU, brand, model number, product URL, category, attributes, specifications, pack quantity, images, seller information, ratings, reviews, availability, discounts, and timestamps. These fields create multiple signals for matching.
Data normalization is equally important. Brand names may appear with different capitalization, punctuation, abbreviations, or spelling variations. Product titles can contain marketing language that does not contribute to identification. Pack sizes may be expressed in different units. Normalizing these differences allows matching algorithms to focus on meaningful product attributes.
| Year |
Illustrative Listing Data Completeness |
Attribute Normalization |
Matchable Records |
| 2020 |
64% |
58% |
62% |
| 2021 |
69% |
64% |
67% |
| 2022 |
75% |
71% |
73% |
| 2023 |
81% |
78% |
80% |
| 2024 |
87% |
84% |
86% |
| 2025 |
92% |
89% |
91% |
| 2026 |
95% |
93% |
94% |
Again, these are illustrative benchmarks rather than external market statistics. The progression highlights why extraction quality matters. Better listing coverage means more product attributes are available for comparison, while normalization reduces false mismatches. Businesses can combine rule-based identifiers with similarity scoring to create a repeatable process that supports price tracking across large product catalogs.
Scaling Identification Across Large Catalogs
Product Matching at Scale becomes essential when a business monitors thousands or millions of marketplace records. Manual comparison may work for a small catalog, but it becomes inefficient as the number of products and marketplaces increases.
A scalable matching architecture can combine deterministic rules with probabilistic techniques. Exact identifiers such as GTIN, UPC, EAN, manufacturer part numbers, or model numbers can provide high-confidence matches. When identifiers are missing, additional signals such as brand, normalized title, specifications, dimensions, pack size, and image similarity can contribute to a confidence score.
Product Matching for Price Intelligence becomes especially valuable when businesses need to connect these matched records with historical prices. Once a product has a stable internal identity, pricing teams can monitor its movement over time instead of treating every scraped listing as a new product.
| Year |
Illustrative Catalog Scale Index |
Automated Matching Share |
Exception Queue Share |
| 2020 |
1.0x |
35% |
65% |
| 2021 |
1.3x |
42% |
58% |
| 2022 |
1.7x |
50% |
50% |
| 2023 |
2.2x |
61% |
39% |
| 2024 |
2.8x |
72% |
28% |
| 2025 |
3.5x |
82% |
18% |
| 2026 |
4.2x |
89% |
11% |
The figures are illustrative and show a potential operating model rather than measured industry performance. Scaling requires efficient pipelines, consistent schemas, deduplication, confidence thresholds, and exception handling. High-confidence matches can move automatically into the pricing system, while ambiguous records can be routed for review. This approach balances automation with accuracy and makes large-scale competitive monitoring practical.
Reducing Manual Work With Intelligent Matching Workflows
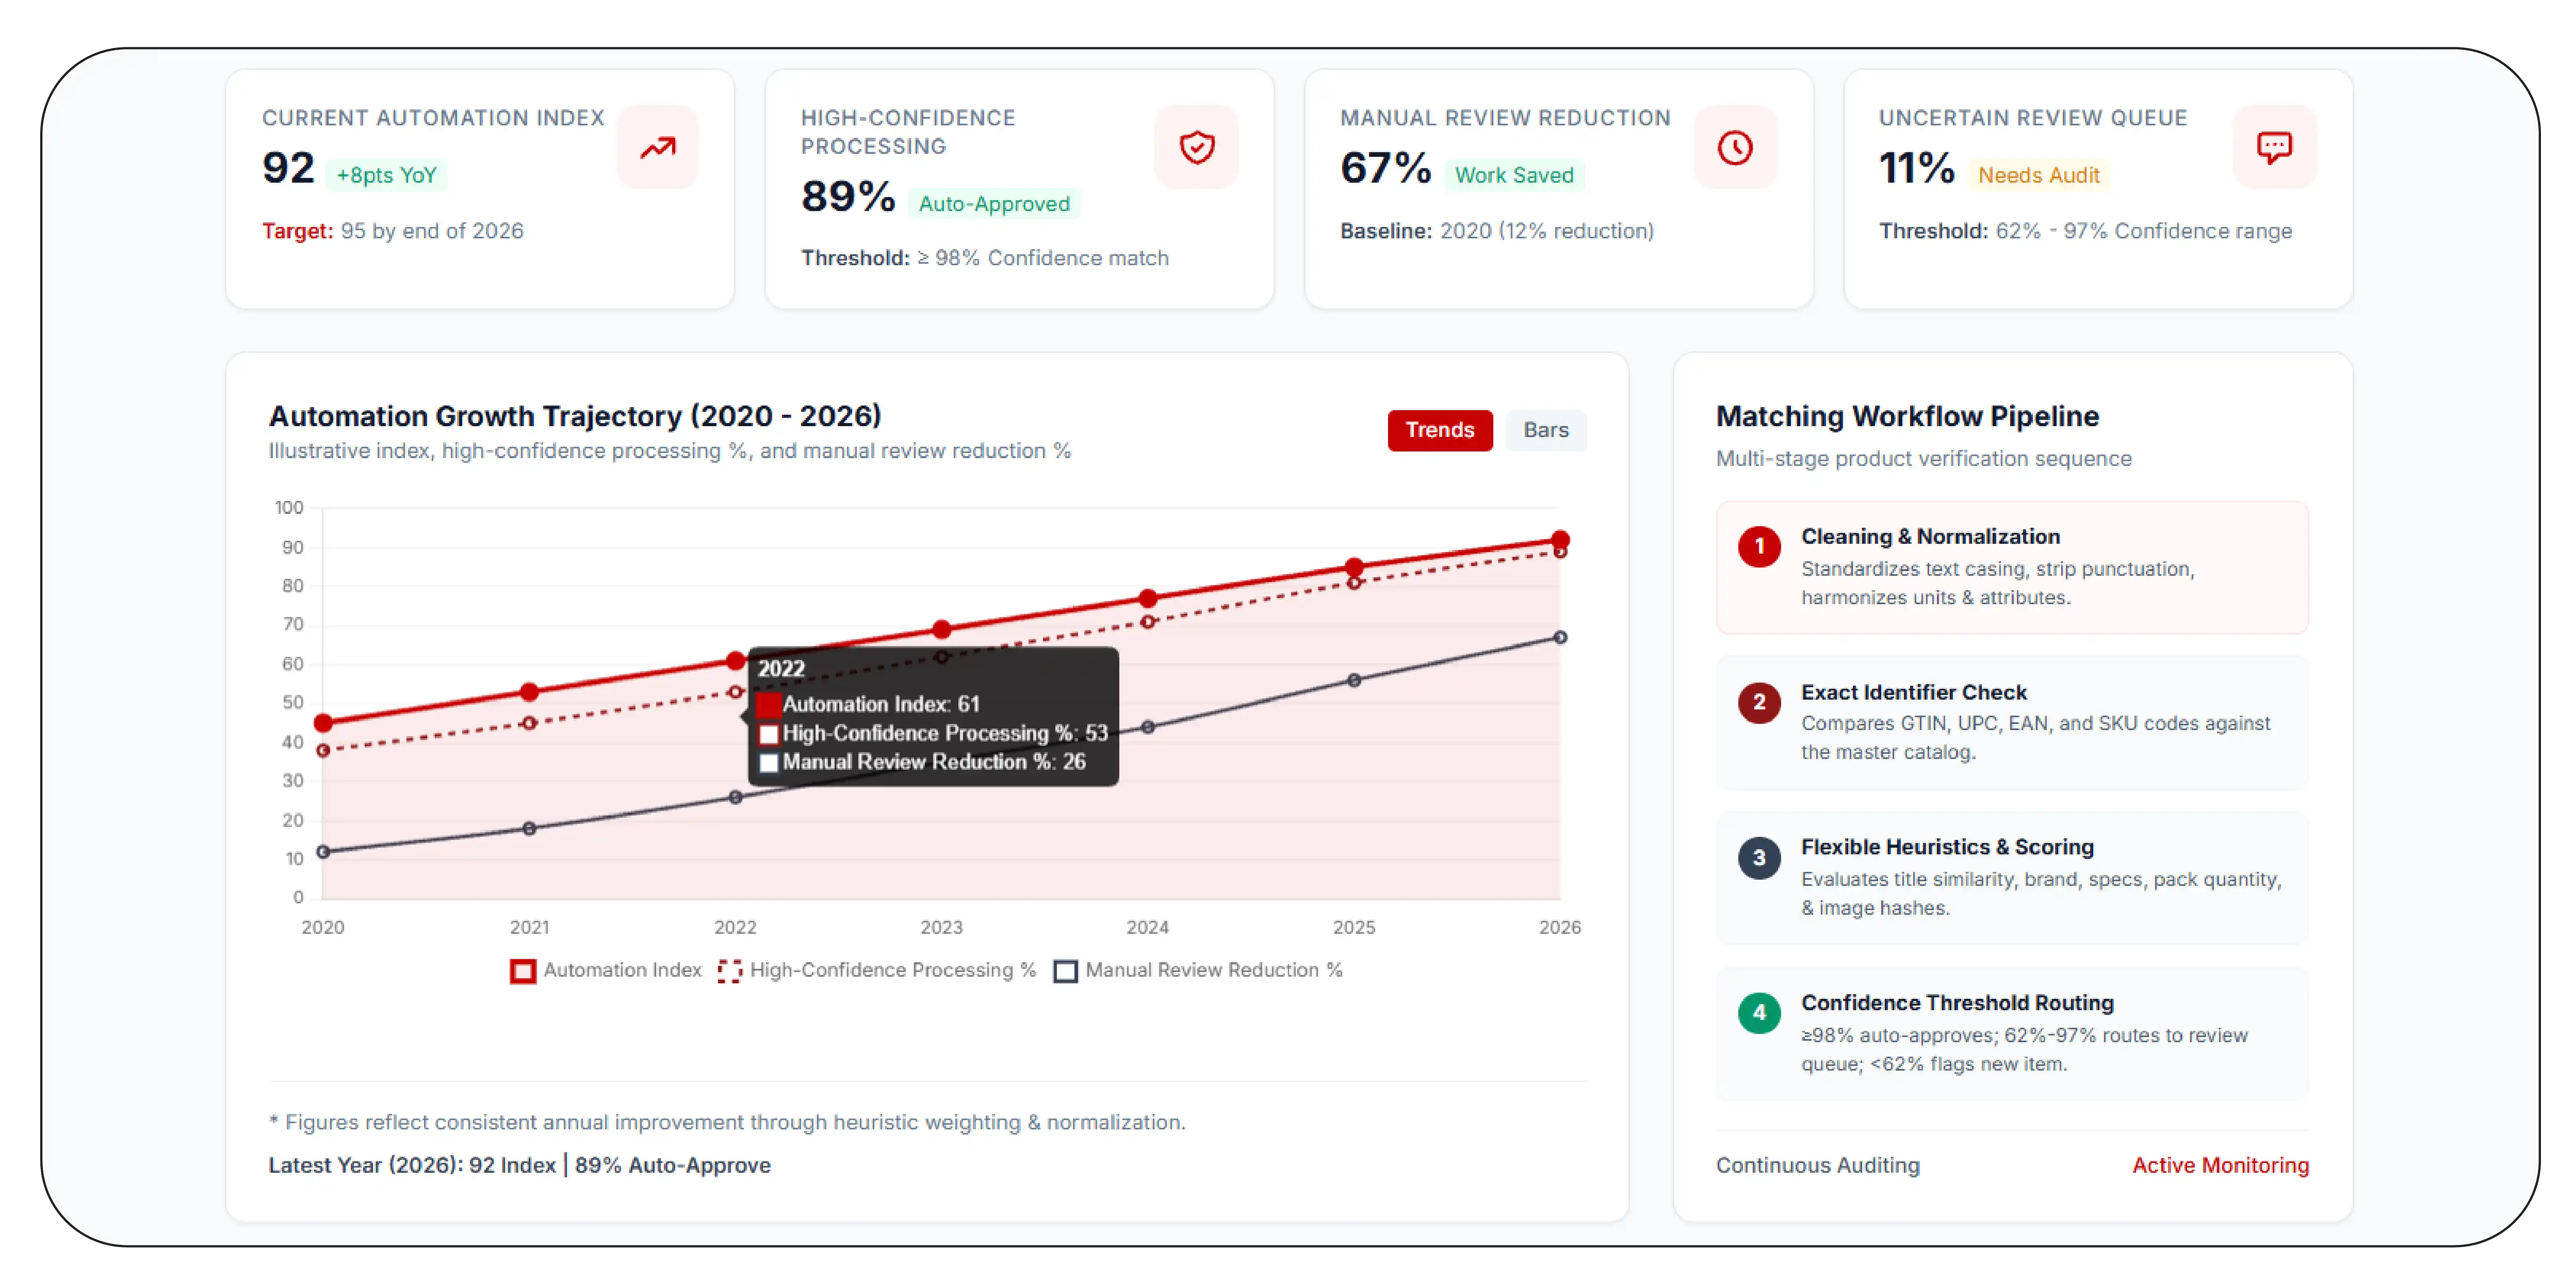
Automated Product Matching data allows businesses to process new marketplace listings without manually checking every record. Automation can compare incoming products with an existing master catalog and determine whether each listing represents an existing product or a new item.
An effective workflow usually begins with data cleaning and normalization. The system then checks exact identifiers before applying increasingly flexible matching methods. Title similarity, brand alignment, model attributes, specifications, pack quantity, and image information can be used to strengthen or weaken a match.
Confidence thresholds are important. A 98% confidence match can generally be treated differently from a 62% confidence match. High-confidence records may be automatically approved, while uncertain records can enter a review queue. This prevents aggressive automation from creating widespread false matches.
| Year |
Illustrative Automation Index |
High-Confidence Processing |
Manual Review Reduction |
| 2020 |
45 |
38% |
12% |
| 2021 |
53 |
45% |
18% |
| 2022 |
61 |
53% |
26% |
| 2023 |
69 |
62% |
35% |
| 2024 |
77 |
71% |
44% |
| 2025 |
85 |
81% |
56% |
| 2026 |
92 |
89% |
67% |
These figures are illustrative. The business benefit is the ability to process repeated marketplace updates without increasing manual workload at the same rate. Automated workflows can also maintain audit trails, preserve historical matches, and trigger alerts when previously matched products change substantially. This makes matching a continuous data process rather than a one-time catalog-cleaning exercise.
Creating Consistent Product Views Across Digital Channels
Product Matching Across Marketplaces helps retailers and brands create a unified view of products sold through different channels. Amazon, Walmart, eBay, specialist retailers, regional marketplaces, and direct-to-consumer stores may all represent the same item differently.
Without cross-marketplace matching, a pricing team could interpret multiple listings as separate products and calculate misleading competitive benchmarks. With a standardized product identity, every marketplace listing can be connected to a common record containing product attributes, sellers, prices, promotions, and availability.
This unified view can support several use cases. Pricing teams can identify the lowest comparable price, merchandising teams can monitor assortment gaps, category managers can evaluate competitor coverage, and analysts can study historical pricing patterns.
| Year |
Illustrative Marketplace Coverage Index |
Cross-Channel Match Rate |
Unified Product View |
| 2020 |
55 |
61% |
Limited |
| 2021 |
62 |
67% |
Emerging |
| 2022 |
70 |
73% |
Developing |
| 2023 |
78 |
80% |
Established |
| 2024 |
85 |
86% |
Advanced |
| 2025 |
91 |
91% |
Mature |
| 2026 |
96 |
95% |
Highly Mature |
The table is an illustrative benchmark. In practice, results depend on product category, marketplace structure, identifier availability, catalog complexity, and data quality. The critical objective is consistency. Once products have stable identities, businesses can combine pricing, seller, availability, and review information into a single analytical framework.
Improving Accuracy Through Continuous Product Identification
Product matching should be treated as an ongoing process because marketplace catalogs constantly change. New products appear, sellers modify titles, specifications are updated, bundles are introduced, and discontinued products may remain visible for extended periods.
A strong system therefore monitors match quality continuously. Historical matches can be re-evaluated when important attributes change. New listings can be compared with existing master records. Low-confidence matches can be reviewed, and confirmed decisions can improve future matching rules.
Businesses can also establish category-specific matching logic. Electronics may rely heavily on model numbers and technical specifications, while grocery products may require pack size, weight, flavor, and quantity. Fashion catalogs may depend more on brand, style, size, color, and variant information.
| Year |
Illustrative Match Quality Index |
Revalidation Frequency |
Exception Resolution |
| 2020 |
63 |
Quarterly |
48% |
| 2021 |
68 |
Quarterly |
54% |
| 2022 |
74 |
Monthly |
61% |
| 2023 |
80 |
Monthly |
69% |
| 2024 |
86 |
Weekly |
77% |
| 2025 |
91 |
Weekly |
85% |
| 2026 |
95 |
Continuous |
92% |
These figures are illustrative. Continuous validation helps prevent stale product relationships from damaging price intelligence. It also allows organizations to maintain a clean product master while adapting to changing marketplace structures. The result is a more dependable foundation for competitor analysis, dynamic pricing, assortment intelligence, and long-term market research.
Why Choose Product Data Scrape?
Product Data Scrape helps businesses build structured datasets that support product identification, competitor monitoring, pricing analysis, and marketplace intelligence. The approach can combine product attributes, seller details, prices, availability, ratings, reviews, specifications, and other relevant listing information into organized datasets. A matching workflow can then normalize these records and connect comparable products across multiple sources. This reduces duplicate records, improves price-comparison accuracy, and supports scalable analysis. Businesses can use the resulting intelligence for pricing strategy, assortment planning, competitive benchmarking, and market research. A structured data pipeline also makes it easier to refresh information regularly and maintain consistent historical records for trend analysis.
Conclusion
Accurate product identification is the foundation of dependable competitive pricing analysis. Product Matching APIs can connect marketplace listings, normalize product information, and create consistent product identities that pricing teams can use for monitoring and analysis. Product Matching for Price Intelligence enables businesses to compare equivalent products, identify pricing gaps, track competitors, and reduce errors caused by mismatched listings.
For companies handling large marketplace catalogs, automation can make the process faster, more consistent, and easier to scale. The key is combining reliable extraction, normalization, matching logic, confidence scoring, and continuous validation.
Partner with Product Data Scrape to build scalable product-matching and price-intelligence data pipelines that turn marketplace listings into actionable competitive insights!
FAQs
1. What is product matching for price intelligence?
Product matching identifies equivalent products across marketplaces so businesses can compare prices accurately. It considers identifiers, titles, brands, specifications, variants, pack sizes, and other attributes.
2. Why is product matching important for pricing?
It prevents businesses from comparing different products as though they were identical. Accurate matches create reliable competitive benchmarks and help pricing teams identify genuine price differences.
3. How does automated product matching work?
Automated matching typically combines exact identifiers with normalized attributes, similarity scoring, product specifications, and confidence thresholds to classify listings as matches, possible matches, or unrelated products.
4. How can Product Data Scrape support product matching?
Product Data Scrape can help businesses collect structured marketplace listing information that provides the product attributes needed to normalize, compare, match, and monitor products across competitive data sources.
5. Can product matching work across multiple marketplaces?
Yes. A centralized matching system can connect equivalent listings across multiple marketplaces using identifiers, product attributes, specifications, titles, brands, variants, and other relevant matching signals.


 Singapore
 EMAIL
EMAIL
 PHONE
PHONE
















.webp)






