Introduction
Quick commerce has changed the importance of product availability. In a traditional retail environment, a shopper may accept visiting another store when a product is unavailable. In quick commerce, an out-of-stock product can immediately cause a customer to substitute, remove the item from the basket, or switch platforms. This makes availability a critical commercial KPI alongside price, assortment, delivery speed, and promotions.
Q-Commerce OOS Tracking enables brands to continuously monitor whether products are visible, orderable, and available across quick-commerce platforms and locations. For brands operating across multiple cities, Scraping Map Every Dark Store can create a structured view of product availability by dark store, category, SKU, and time period. The importance of this capability has increased as India's quick-commerce infrastructure has expanded rapidly. CareEdge reports that the number of dark stores operated by the three major players increased from about 1,400 in FY2023 to 3,072 in FY2025.
This report examines six important applications of OOS monitoring from 2020 to 2026, including competitor availability, dark-store inventory, on-shelf availability, KPI measurement, assortment monitoring, and inventory intelligence.
Turning Competitor Availability Into a Strategic Signal
competitor OOS tracking for FMCG brands, Assortment and availability monitoring can reveal much more than whether a product is temporarily unavailable. Repeated stockouts can indicate strong demand, replenishment challenges, limited inventory allocation, or changes in assortment strategy. For FMCG brands, tracking competitor availability across locations can therefore provide an additional competitive signal.
The quick-commerce market expanded considerably during the 2020–2026 period. One market estimate puts India's q-commerce market at $0.91 billion in 2020 and $5.26 billion in 2025, illustrating the scale of the channel's development.
| Year |
Illustrative Market Development |
Availability Intelligence Priority |
| 2020 |
Q-commerce emerging |
Basic product visibility |
| 2021 |
Rapid consumer adoption |
SKU availability |
| 2022 |
Dark-store expansion |
Location-level monitoring |
| 2023 |
Wider assortment |
Competitor OOS tracking |
| 2024 |
Multi-category growth |
Store-level benchmarking |
| 2025 |
Large-scale networks |
Automated availability monitoring |
| 2026 |
Mature competition |
Predictive OOS intelligence |
These figures combine market context with an analytical framework and should not be interpreted as a single audited OOS dataset.
For brands, the objective is to determine whether a competitor's product is unavailable occasionally or repeatedly. A single OOS event may have limited meaning, while frequent unavailability across several dark stores could represent an important market signal. Brands can compare OOS rates by SKU, city, platform, category, and time period.
The same data can also help identify assortment gaps. If competing products disappear frequently while a brand's SKU remains consistently available, that may create an opportunity to improve visibility or promotional positioning. Conversely, if a brand experiences repeated OOS events while competitors remain available, the issue may require replenishment or inventory-allocation attention.
Building a Location-Level View of Inventory
dark store stock availability data gives brands a more granular view of quick-commerce inventory than platform-wide product monitoring. A product can appear available in one location while being unavailable only a few kilometres away. This makes geographic availability important for brands selling through dense micro-fulfilment networks.
CareEdge reports that India's major quick-commerce operators increased their combined dark-store count from approximately 1,400 in FY2023 to 1,800 in FY2024 and 3,072 in FY2025.
| Year |
Dark-Store Context |
Monitoring Requirement |
| 2020 |
Early micro-fulfilment models |
Platform-level checks |
| 2021 |
Network expansion |
City-level availability |
| 2022 |
More dark stores |
Store-level checks |
| 2023 |
Dense urban coverage |
SKU-location mapping |
| 2024 |
Rapid network growth |
Frequent stock checks |
| 2025 |
3,072 major-player stores* |
Automated store monitoring |
| 2026 |
Further network expansion |
Near-real-time visibility |
*CareEdge figure for the three major players in its methodology.
A location-level dataset can contain SKU, platform, dark-store identifier, city, timestamp, availability status, listed price, promotional status, and product category. Repeated observations create a historical availability record that can be analyzed for patterns.
This information can help brands identify geographic pockets where products consistently disappear from digital shelves. It can also support comparisons between high-demand locations and lower-velocity markets. Instead of treating availability as a single national metric, businesses can evaluate it as a network-level performance indicator.
For quick-commerce operators and brands, this approach can improve replenishment discussions, inventory allocation, assortment decisions, and distributor coordination. It also creates the foundation for identifying products that require higher monitoring frequency because they experience frequent availability changes.
Measuring What Customers Can Actually Order
dark store on-shelf availability tracking focuses on the customer-facing side of inventory. Physical inventory may exist somewhere within a fulfilment network, but the critical question for the customer is whether the product can actually be discovered and ordered from the relevant location.
This distinction becomes increasingly important as quick-commerce networks expand. Research from CareEdge shows that average revenue per major-player dark store increased from approximately ₹12 crore in FY2023 to ₹21 crore in FY2025, indicating the growing commercial importance of each fulfilment point.
| Year |
Availability Focus |
Example Measurement |
| 2020 |
Product visibility |
Listed / unavailable |
| 2021 |
Digital shelf presence |
Availability rate |
| 2022 |
Location coverage |
Store-level OSA |
| 2023 |
Assortment depth |
SKU availability |
| 2024 |
Frequent replenishment |
OOS duration |
| 2025 |
High-density networks |
Location-SKU OSA |
| 2026 |
Predictive operations |
OOS risk scoring |
On-shelf availability should therefore measure whether an SKU is displayed and purchasable under the customer's relevant location. A product can be listed but unavailable, available but limited, or completely absent from search results. Each state can represent a different operational condition.
Brands can calculate availability rates by SKU and location and then segment results into high-, medium-, and low-performing products. This makes it easier to identify whether OOS issues are concentrated around fast-moving products, particular cities, certain time windows, or specific platforms.
Historical OSA records can also reveal recurring patterns. A product might be consistently available during weekdays but frequently unavailable during weekends. Another SKU might show stock gaps during promotional periods. These patterns are difficult to identify through occasional manual checks but become visible when availability is monitored systematically.
Establishing a Consistent Measurement Framework
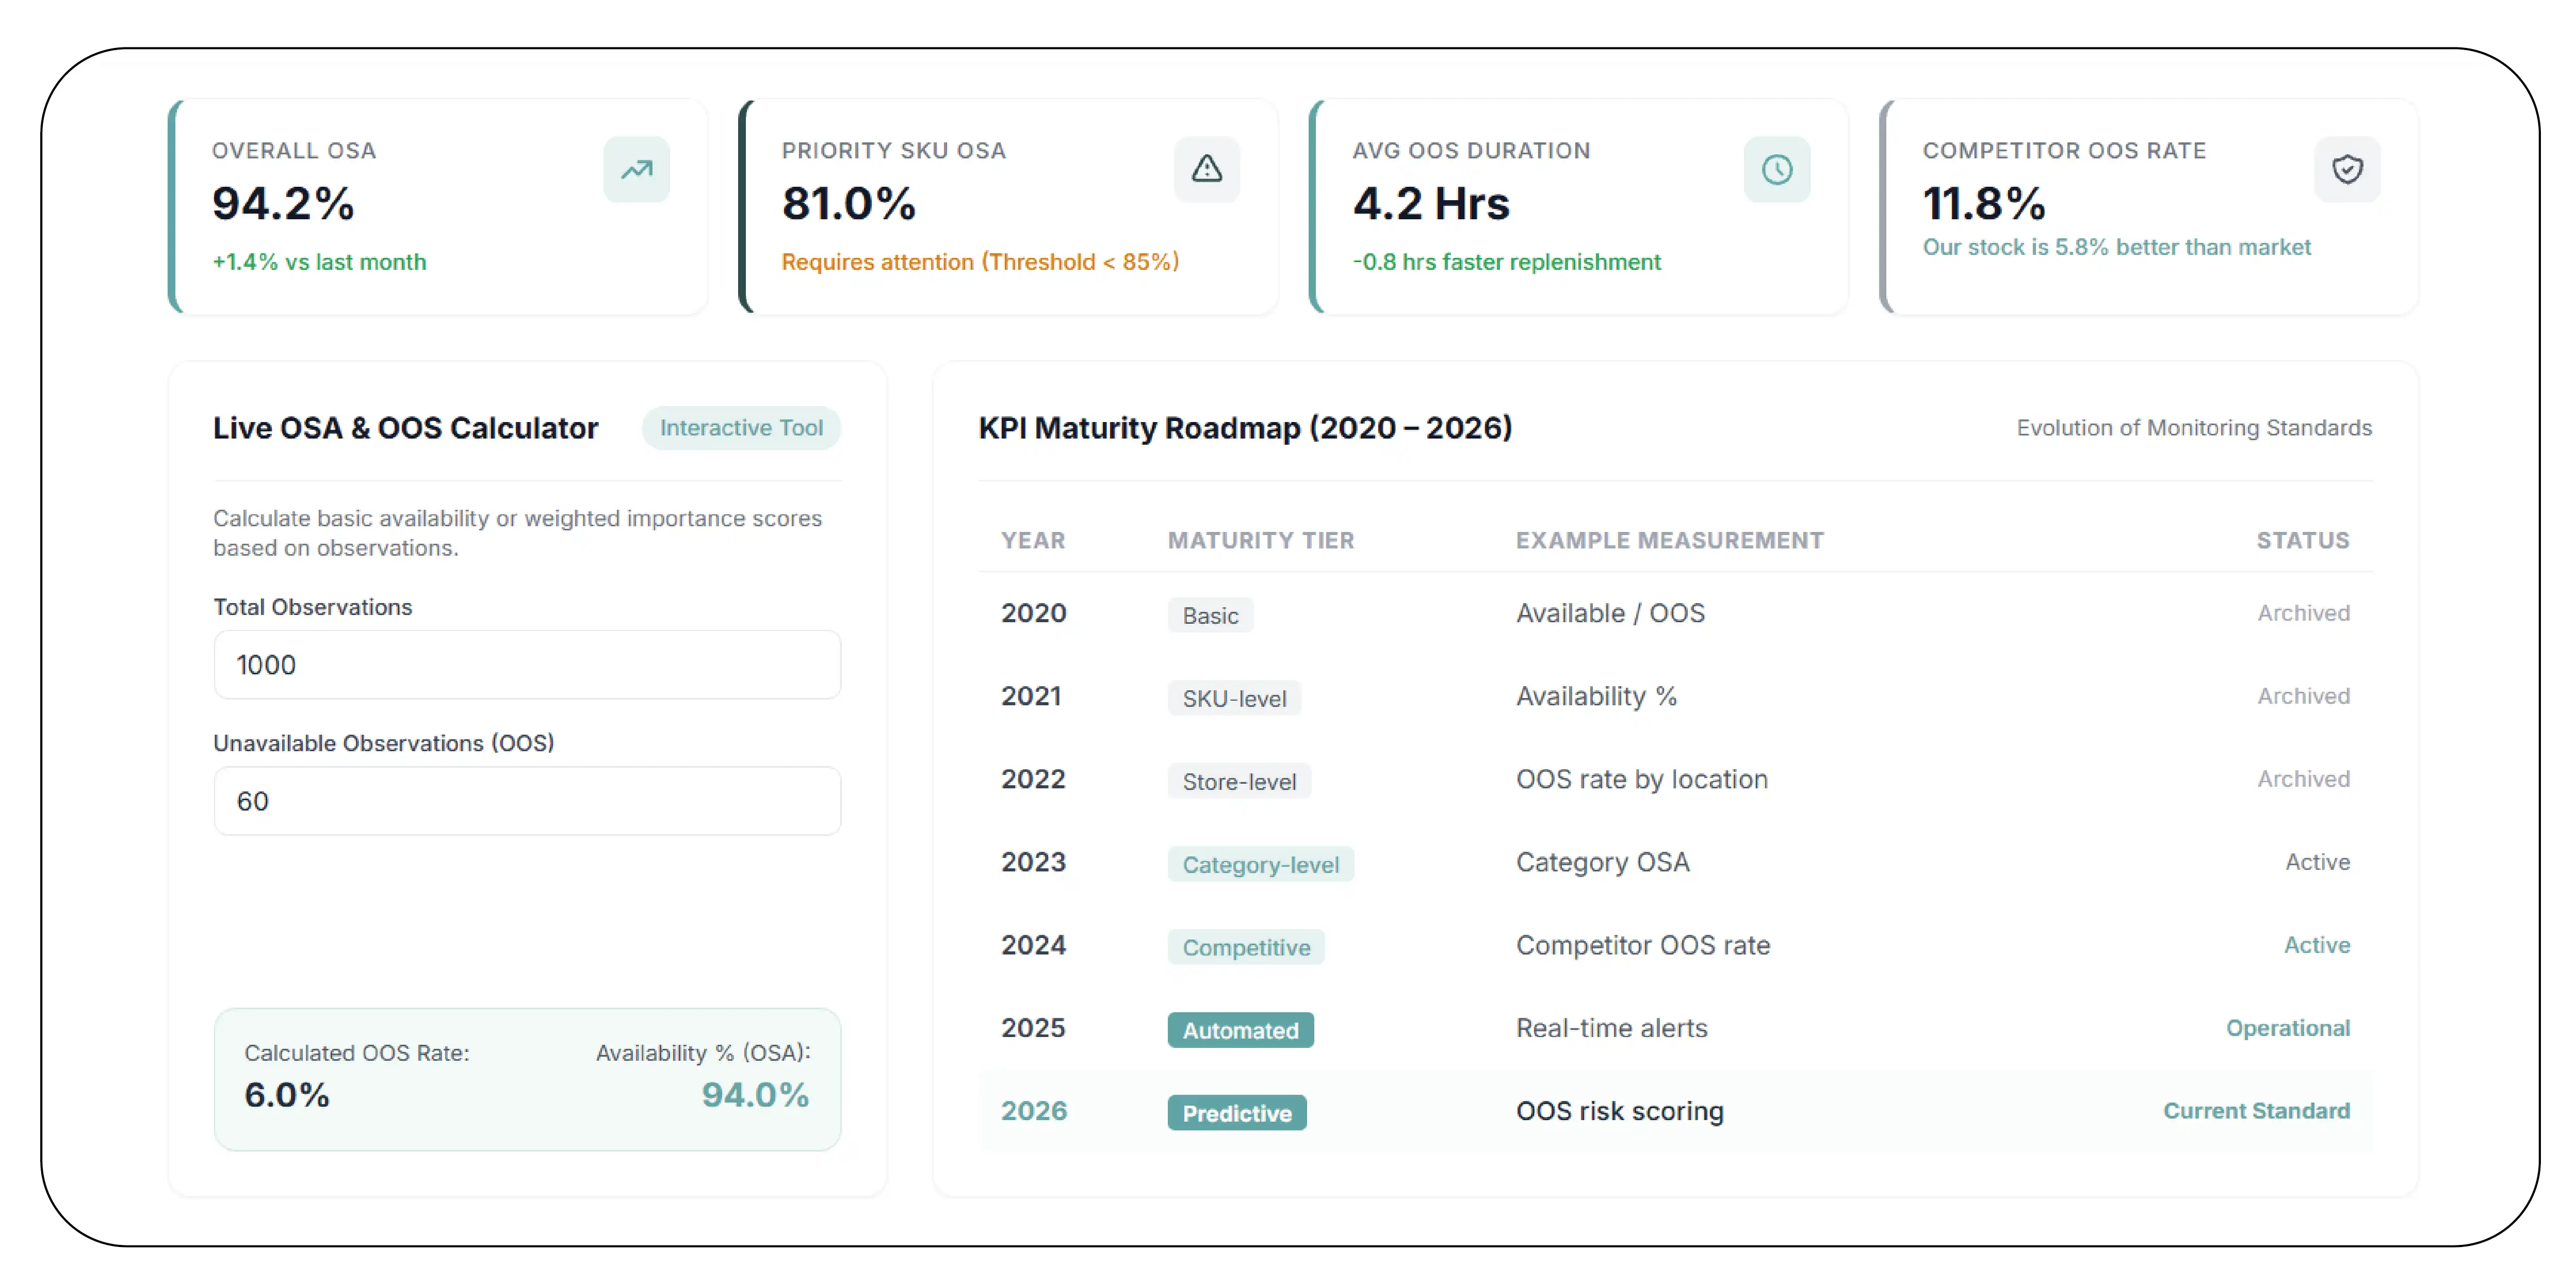
on-shelf availability KPI tracking turns raw availability observations into measurable performance indicators. Without standardized KPIs, teams may know that stockouts are occurring without understanding their frequency, duration, geographic concentration, or commercial impact.
A strong KPI framework can track OOS rate, availability percentage, average OOS duration, SKU coverage, store coverage, replenishment frequency, and competitor availability. The following framework illustrates how organizations can mature their KPI monitoring between 2020 and 2026.
| Year |
KPI Maturity |
Example Measurement |
| 2020 |
Basic |
Available / OOS |
| 2021 |
SKU-level |
Availability % |
| 2022 |
Store-level |
OOS rate by location |
| 2023 |
Category-level |
Category OSA |
| 2024 |
Competitive |
Competitor OOS rate |
| 2025 |
Automated |
Real-time alerts |
| 2026 |
Predictive |
OOS risk scoring |
A basic OOS rate can be calculated as the number of unavailable observations divided by total availability observations. Availability percentage is the inverse. More advanced analysis can calculate weighted OSA, giving greater importance to priority SKUs or high-volume locations.
KPI tracking becomes particularly valuable when combined with historical data. A brand can determine whether OOS performance is improving, deteriorating, or fluctuating seasonally. It can also compare performance across platforms and locations.
For example, if a brand maintains 94% availability overall but only 81% availability for its highest-selling products, the overall metric could conceal an important operational problem. Segmenting KPIs by SKU importance provides a more commercially useful picture.
The same framework can support management dashboards and automated alerts. When availability drops below a defined threshold, the relevant team can investigate the product, location, distributor, or replenishment cycle. This changes OOS monitoring from passive reporting into an operational decision-support mechanism.
Managing Assortment Across a Rapidly Expanding Channel
Q-commerce assortment availability tracking helps brands understand whether their intended assortment is consistently represented across quick-commerce platforms and locations. Availability is not only an inventory issue; it can also reflect deliberate assortment decisions, local demand, space constraints, and category strategy.
Quick commerce has expanded beyond traditional grocery into beauty, pharmacy, electronics accessories, gifting, household products, and other categories. Recent market research describes grocery as the leading product segment, while other categories continue to expand.
| Year |
Assortment Development |
Key Monitoring Need |
| 2020 |
Grocery-focused |
Core SKU availability |
| 2021 |
Wider grocery range |
SKU coverage |
| 2022 |
More categories |
Category expansion |
| 2023 |
Non-food growth |
Assortment benchmarking |
| 2024 |
Wider product mix |
Location-level assortment |
| 2025 |
Multi-category scaling |
SKU productivity |
| 2026 |
Broader q-commerce ecosystem |
Dynamic assortment intelligence |
For brands, assortment tracking can answer questions such as which products are available in the most locations, which SKUs are missing from specific cities, and whether competitors have broader category coverage. It can also reveal products that frequently appear and disappear, indicating possible replenishment or assortment-rotation issues.
Assortment data becomes more valuable when paired with price and promotional information. A brand may discover that a competitor offers a broader assortment but maintains higher prices, while another competitor has fewer SKUs but stronger availability. These differences can inform assortment, pricing, and promotional decisions.
Location-level assortment monitoring can also support expansion strategies. If a product performs well in one city but has limited availability in another, the brand can investigate whether the issue is demand, distribution, or platform assortment policy.
As quick-commerce platforms expand their product mix, systematic assortment intelligence can help brands understand where they are well represented and where opportunities remain.
Connecting Inventory Signals With Commercial Decisions
Dark-store inventory tracking provides the operational foundation for understanding availability movements across quick-commerce networks. Combined with Q-Commerce OOS Tracking, it can connect product visibility with broader inventory intelligence.
The scale of the channel makes this increasingly important. Sprout Research reported major dark-store expansion among Blinkit, Instamart, and Zepto, while CareEdge reported 3,072 combined dark stores for the three major players in FY2025.
| Year |
Inventory Intelligence Focus |
Example Output |
| 2020 |
Basic stock visibility |
OOS status |
| 2021 |
SKU monitoring |
Availability history |
| 2022 |
Store mapping |
Location-level inventory |
| 2023 |
Replenishment analysis |
OOS duration |
| 2024 |
Network benchmarking |
Store comparisons |
| 2025 |
Automated monitoring |
Alerts |
| 2026 |
Predictive intelligence |
OOS risk models |
Inventory intelligence can identify patterns that a simple OOS metric cannot. If a product repeatedly becomes unavailable shortly after a promotion begins, the issue could indicate demand exceeding replenishment capacity. If OOS events occur only at certain locations, local demand or distribution could be the cause.
Brands can also compare inventory signals with pricing. A competitor's price increase accompanied by reduced availability could indicate constrained inventory, while a price reduction combined with high availability may signal an aggressive promotional strategy.
For operators, the data can support replenishment and store-level planning. For brands, it can provide evidence for conversations with distributors and platform category managers. Historical observations can help determine whether an availability problem is temporary or recurring.
The strongest approach is therefore to combine inventory, availability, assortment, pricing, and promotional signals into one analytical framework. This creates a more complete picture of quick-commerce performance and helps businesses move toward proactive rather than reactive inventory management.
Why Choose Product Data Scrape?
Product Data Scrape provides a structured approach for brands that need to monitor fast-changing quick-commerce marketplaces across products, locations, categories, prices, and availability. The solution can be configured around priority SKUs, target cities, dark stores, competitors, and desired refresh frequencies.
With Scrape Real-Time Quick Commerce Data, brands can build recurring datasets that capture customer-facing product availability and other marketplace signals. This information can be standardized by SKU, location, platform, category, timestamp, price, promotion, and availability status.
The resulting Q-Commerce OOS Tracking framework can support dashboards, alerts, competitive intelligence, assortment planning, and inventory analysis. Historical snapshots allow brands to identify recurring stockout patterns rather than relying on isolated observations.
Product Data Scrape can also help organizations scale monitoring as quick-commerce networks expand. Instead of manually checking individual apps or locations, businesses can establish automated workflows designed around their specific data requirements.
The broader objective is to turn marketplace visibility into actionable retail intelligence. Brands can identify availability gaps, compare competitor performance, evaluate assortment coverage, and prioritize products or locations requiring attention. This makes OOS monitoring part of a broader data-driven approach to quick-commerce strategy.
Conclusion
Quick commerce has created a retail environment where product availability is closely connected to customer experience, conversion, revenue, and competitive positioning. The rapid expansion of dark stores has made location-level monitoring increasingly important. CareEdge's research indicates that the combined dark-store count of three major Indian quick-commerce operators reached 3,072 in FY2025, up from 1,400 in FY2023.
For brands, availability can no longer be evaluated through occasional manual checks. Quick Commerce Price Intelligence combined with availability, assortment, promotion, and competitor signals can provide a more complete picture of marketplace conditions. A product's price may look competitive, for example, but its commercial opportunity is limited if the SKU is consistently unavailable.
Q-Commerce OOS Tracking enables businesses to monitor these changes systematically across SKUs, platforms, cities, and dark stores. Historical data can reveal recurring OOS patterns, while frequent monitoring can surface emerging availability problems faster.
As quick commerce continues expanding across categories and geographies, brands that establish structured availability intelligence can make better decisions around replenishment, assortment, pricing, promotions, and competitive strategy.
Want to monitor quick-commerce availability, dark-store assortment, and competitor OOS patterns at scale? Connect with Product Data Scrape to build a real-time retail data solution tailored to your SKUs and target locations!


 Singapore
 EMAIL
EMAIL
 PHONE
PHONE















.webp)






