Introduction
Track Brand-Level Ice Cream Availability Study in India helps ice cream manufacturers, distributors, retailers, and FMCG teams understand whether products are actually visible and purchasable across digital retail channels. The core answer is simple: by tracking brand presence, SKU availability, stockouts, assortment depth, pricing, and pincode-level coverage, businesses can identify distribution gaps and improve retail execution.
India's ice cream category is becoming increasingly competitive and less dependent on seasonal purchases. Industry data shows the Indian ice cream market reached approximately ₹202.3 billion in 2024, with a 13.7% CAGR between 2022 and 2024. At the same time, quick commerce is becoming an important FMCG discovery and purchasing channel. In 2024, quick commerce represented more than two-thirds of India's e-grocery orders, according to a Bain-Flipkart report cited by Reuters. This rapid shift makes Grocery data scraping valuable for tracking product availability, pricing, assortment, and competitive visibility across India's digital grocery ecosystem.
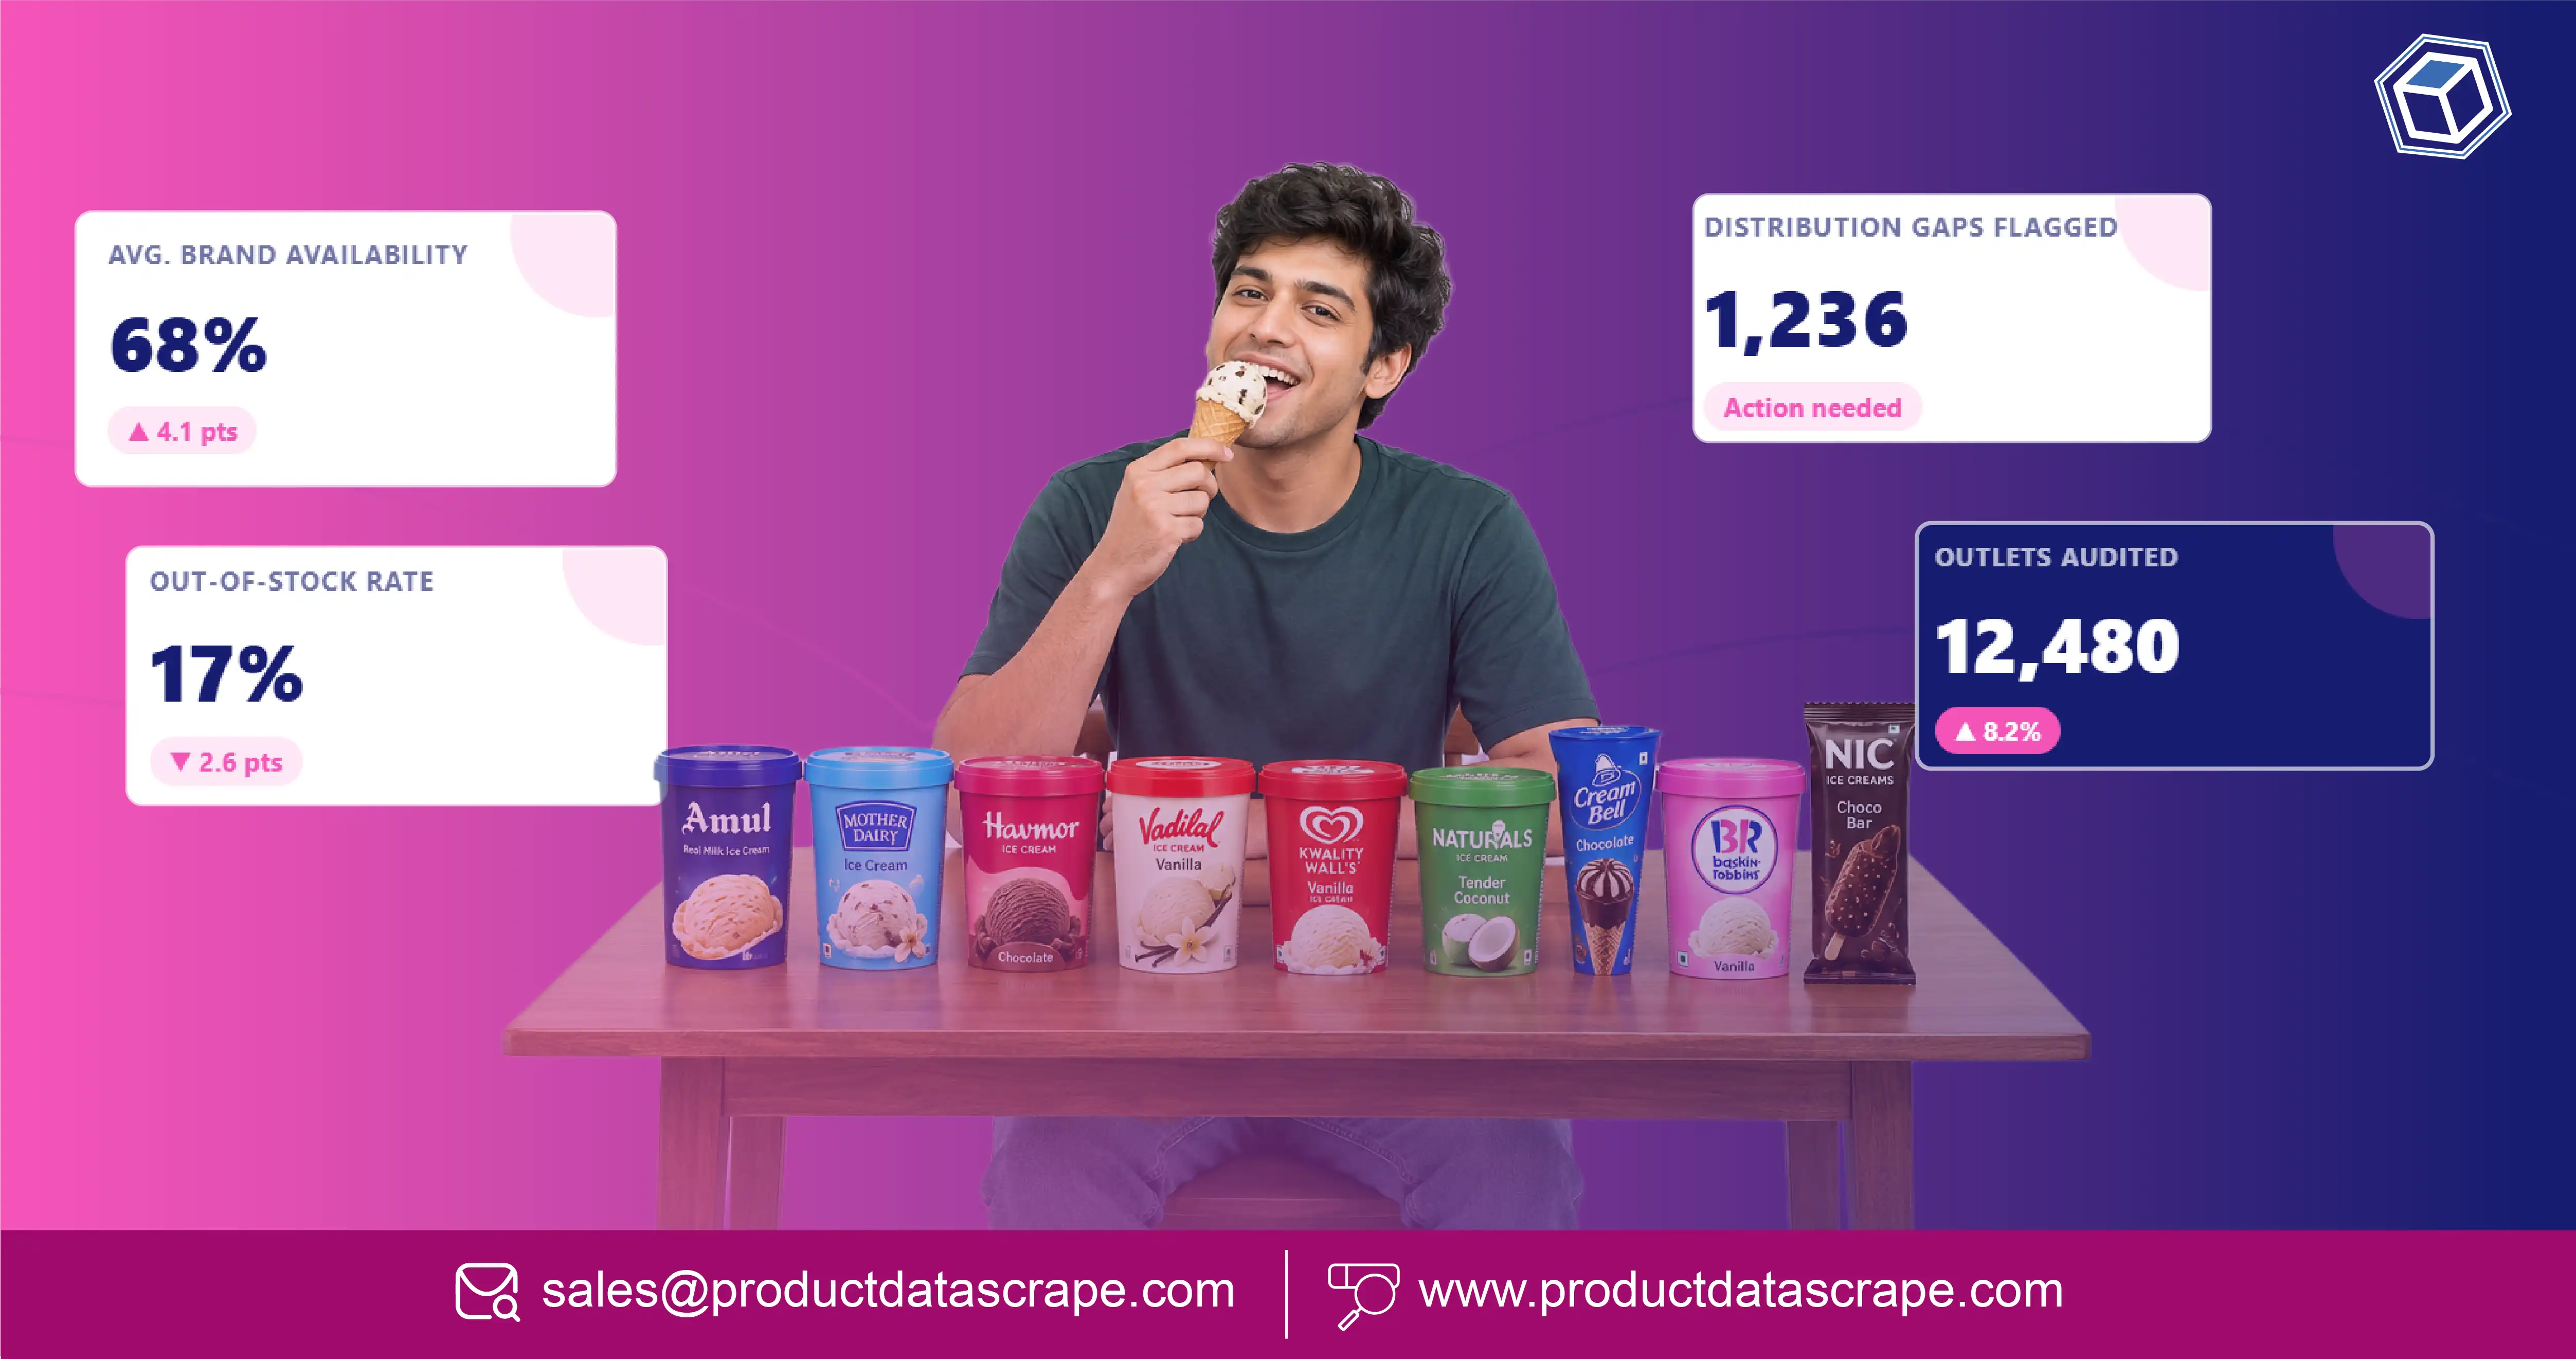
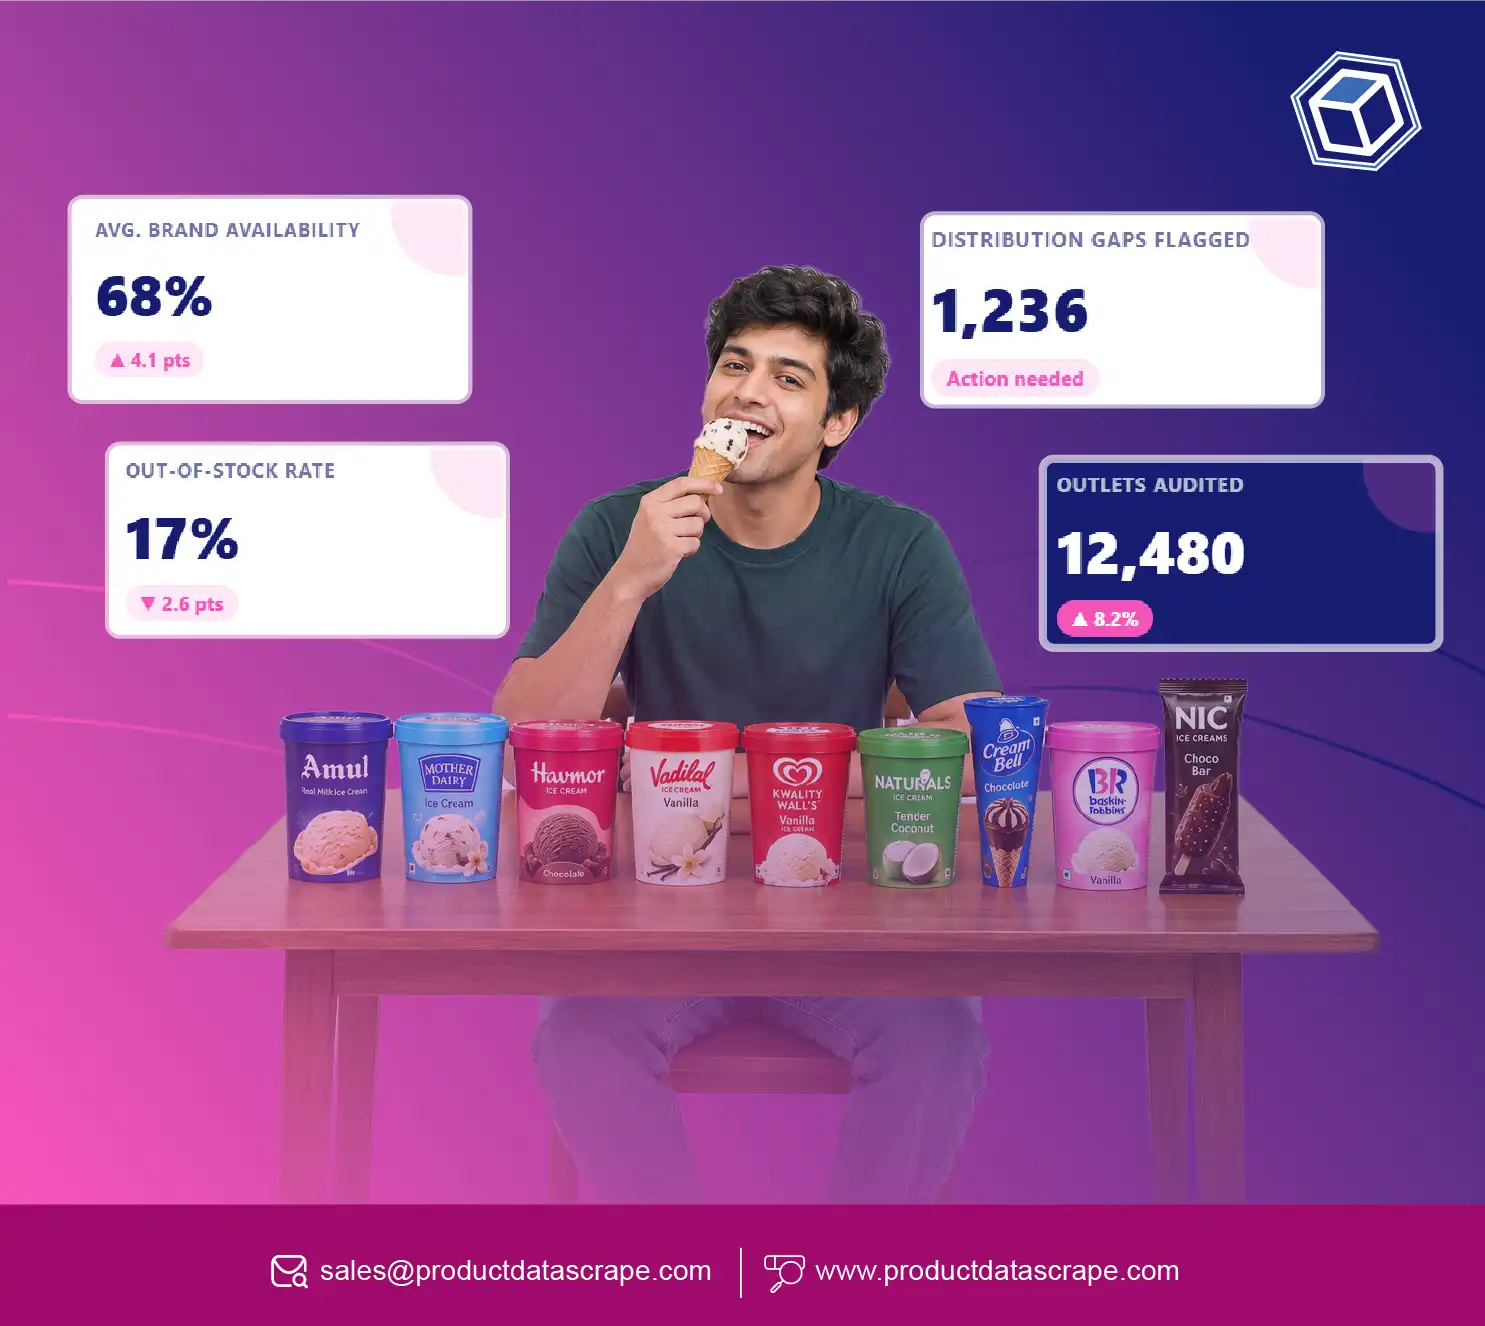
The study can compare leading brands such as Amul, Mother Dairy, Havmor, Vadilal, Kwality Wall's, Naturals Ice Cream, Cream Bell, Baskin-Robbins, and NIC Ice Creams. By monitoring their product listings across online grocery platforms and quick-commerce apps, businesses can assess which brands and flavours are available, compare pack sizes and prices, identify stockouts, and evaluate geographic coverage across Indian cities and pincodes.
For brands, this creates a critical question: Is a product truly available to consumers, or does the brand only appear to have distribution because it is listed somewhere online?
Availability monitoring answers that question using recurring marketplace-level and location-level data.
How can brands measure ice cream visibility across rapidly changing retail channels?
Ice cream availability is not simply about whether a product has a listing. A product may appear in search results but remain unavailable, have limited pincode coverage, disappear during peak demand, or be replaced by competing SKUs. This makes Brand Protection important for maintaining consistent product visibility, availability, and representation across digital retail channels.
ice cream brand availability quick commerce analysis helps businesses examine brand-level presence across platforms, categories, cities, and locations. When combined with Digital Shelf Analytics, the data can reveal how consistently brands are represented compared with competitors.
What should brands monitor?
| Metric |
What It Reveals |
Business Use |
| Brand availability rate |
Percentage of checked locations where products are available |
Distribution measurement |
| SKU availability |
Availability of individual products |
Assortment optimization |
| Brand visibility |
Presence in relevant searches/categories |
Digital retail execution |
| Stockout frequency |
How often products become unavailable |
Inventory planning |
| Pincode coverage |
Geographic reach |
Distribution expansion |
| Competitor presence |
Relative market visibility |
Competitive benchmarking |
The 2020-2026 evolution is important. In 2020, lockdown-driven changes increased dependence on digital grocery discovery and home delivery. During 2021, online grocery adoption strengthened as consumers became more comfortable with digital purchasing. In 2022, quick-commerce platforms accelerated their geographic expansion and started competing more directly for FMCG demand. By 2023, brands increasingly treated digital retail as an important visibility channel rather than simply another sales outlet. In 2024, quick commerce captured more than two-thirds of e-grocery orders, demonstrating its growing importance in online grocery. (Reuters) In 2025, online FMCG sales in India grew strongly, with quick commerce accounting for nearly one-third of online FMCG sales in the year ended May, according to Worldpanel data reported by Mint. (mint) By 2026, the infrastructure has expanded further: a July 2026 mapping study identified 5,625 dark stores across five major quick-commerce platforms and 408 cities. (QuickCommerceMap) This expansion makes recurring brand-level availability measurement increasingly valuable.
How can businesses identify availability gaps across quick-commerce platforms?
Monitor ice cream availability across quick-commerce apps to understand how consistently products are offered to shoppers on platforms such as Blinkit, Zepto, Swiggy Instamart, Flipkart Minutes, and BigBasket. Availability can vary significantly by city, pincode, store cluster, SKU, and time of day.
A strong Assortment and availability monitoring framework should therefore capture more than a simple in-stock/out-of-stock status.
Recommended data points
| Data Point |
Example Insight |
| Platform |
Blinkit, Zepto, Instamart, etc. |
| Brand |
Brand-level visibility |
| Product |
SKU and product name |
| Pack size |
100 ml, 500 ml, 1 litre, etc. |
| MRP |
Listed maximum retail price |
| Selling price |
Current consumer price |
| Discount |
Promotional intensity |
| Availability |
In stock/out of stock |
| Pincode |
Location-specific access |
| Timestamp |
Time-based availability |
| Product URL |
Listing traceability |
The 2020-2026 progression shows why this approach matters. In 2020, digital grocery availability was heavily affected by lockdown restrictions, localized delivery limitations, and changing consumer demand. In 2021, online grocery services became more operationally mature. In 2022, rapid-delivery models increasingly relied on localized inventory hubs. During 2023, consumers became more accustomed to using quick-commerce apps for routine and immediate purchases. In 2024, the channel reached a major scale milestone, accounting for more than two-thirds of e-grocery orders. (Reuters) In 2025, online FMCG adoption continued expanding, with urban FMCG e-commerce household penetration reaching 18% by May, compared with 9.6% in 2023 and 12.3% in 2024, according to Worldpanel data reported by Mint. (mint) In 2026, mapped quick-commerce infrastructure reached thousands of stores across hundreds of cities, making location-level monitoring more important than broad national availability assumptions. (QuickCommerceMap)
How does dark-store inventory data reveal competitive FMCG opportunities?
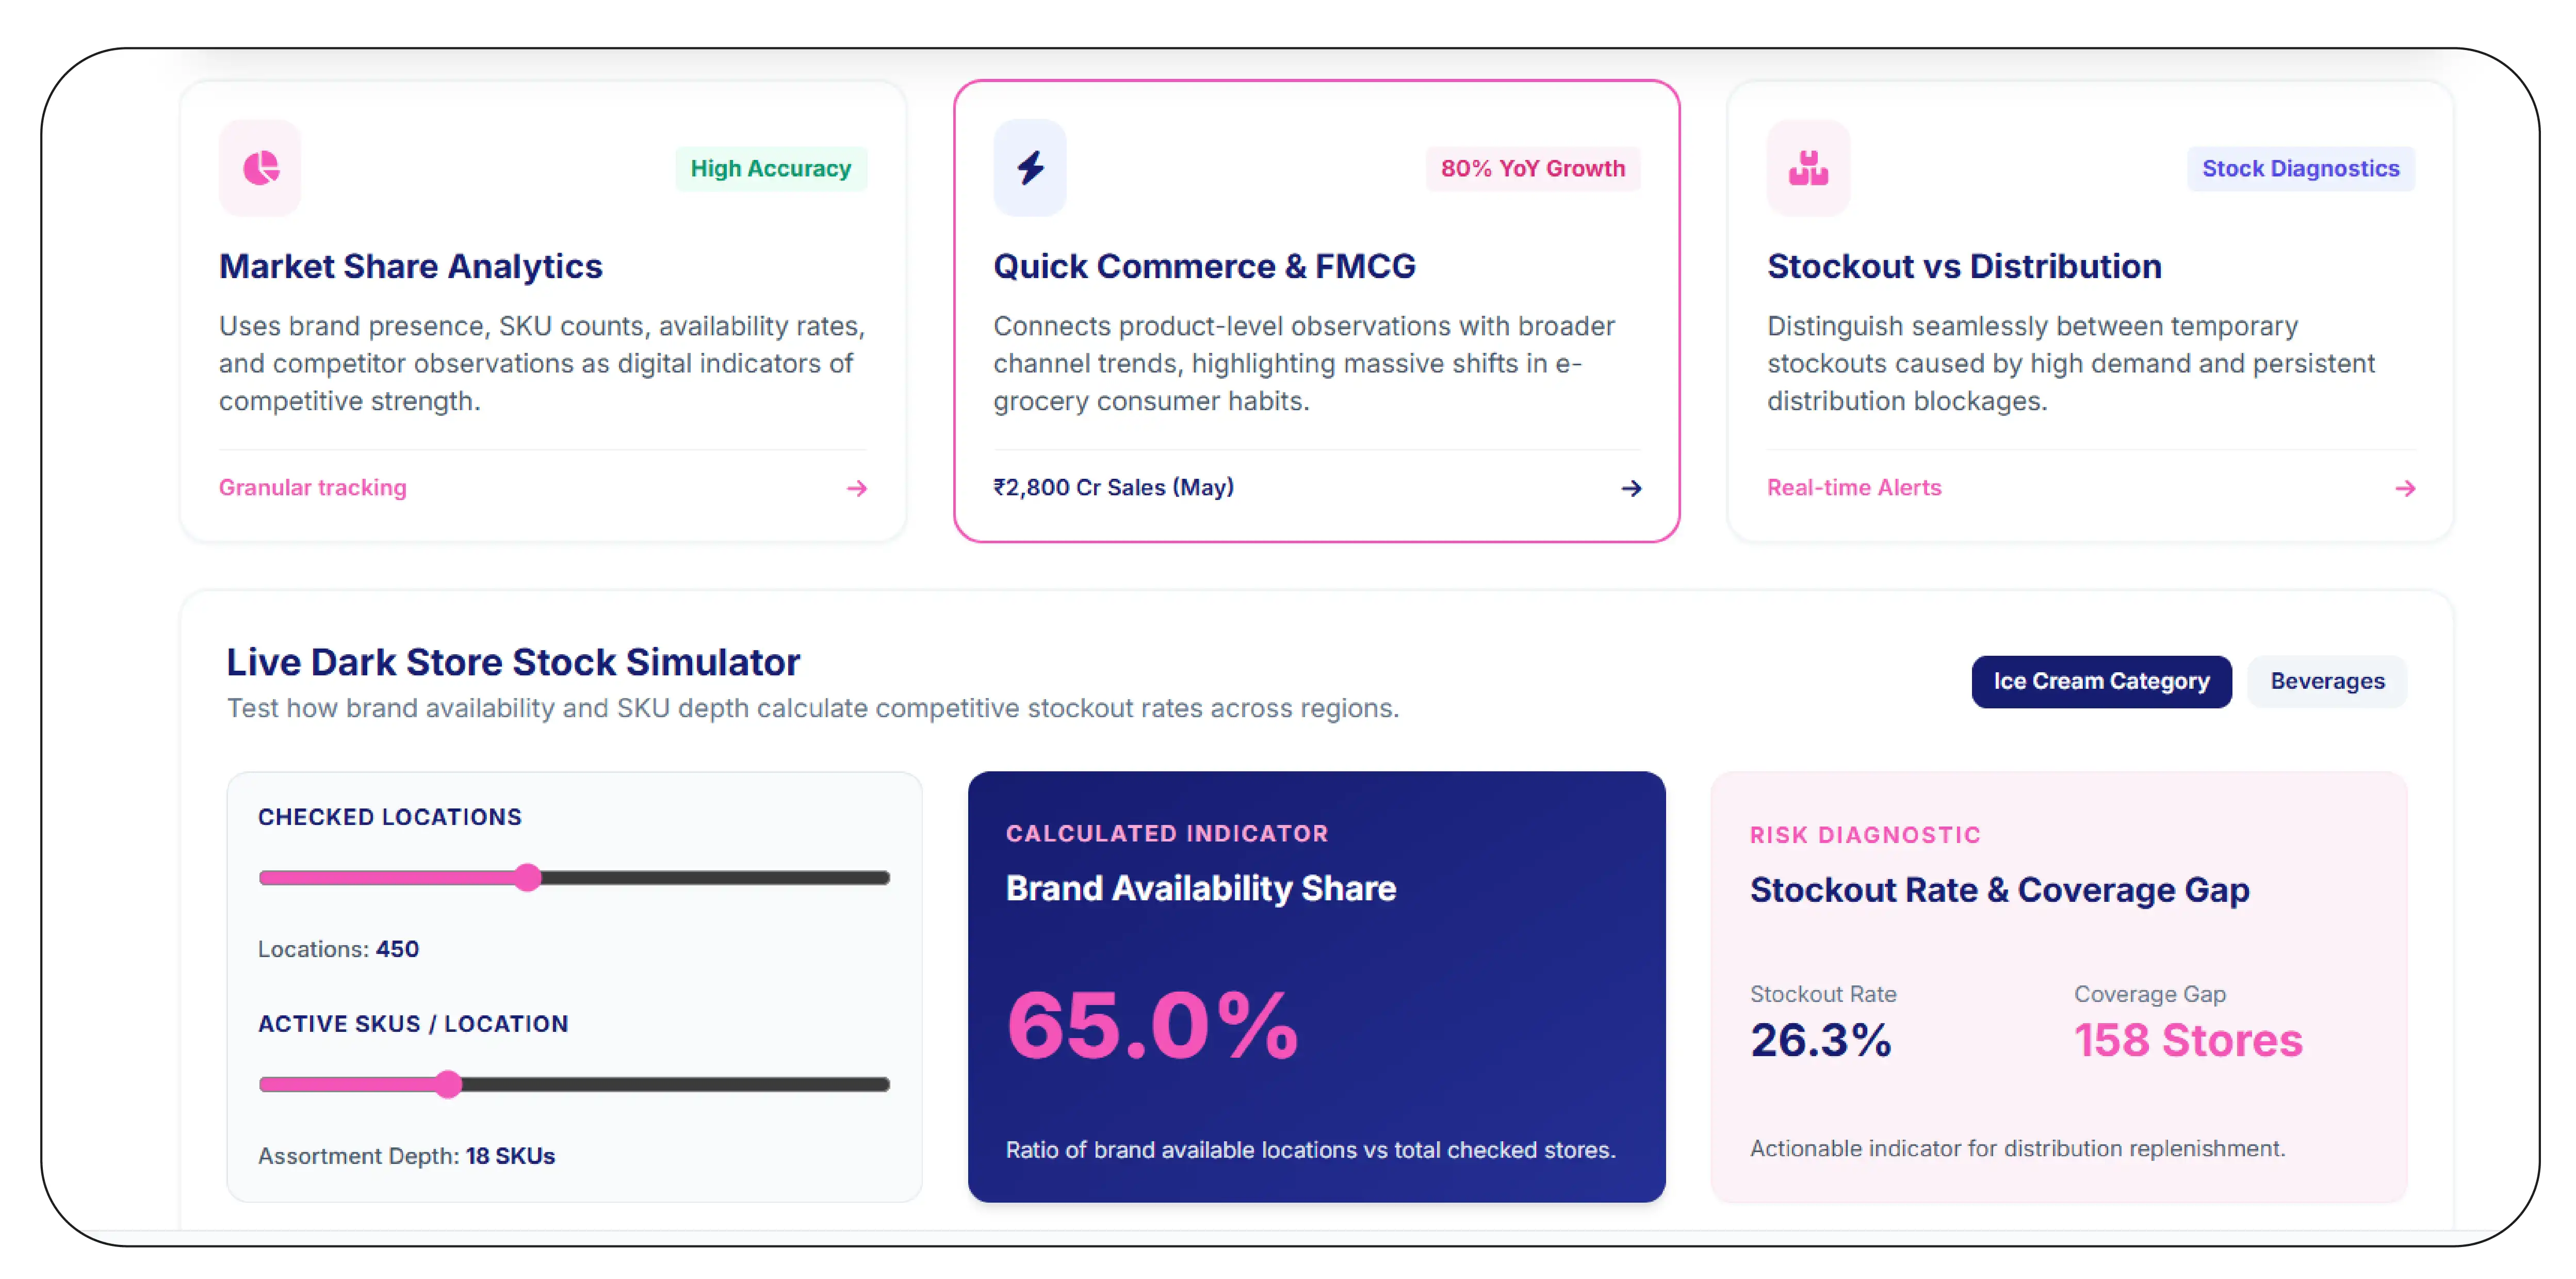
ice cream dark store stock monitoring gives brands a closer view of inventory conditions inside the localized fulfillment ecosystem. When availability is measured repeatedly, businesses can distinguish between temporary stockouts and persistent distribution problems.
Market Share Analytics can then use brand presence, SKU counts, availability rates, and competitor observations as digital indicators of competitive strength. Meanwhile, Quick commerce & FMCG data can connect product-level observations with broader channel trends.
Useful competitive indicators
| Indicator |
Measurement Approach |
| Brand availability share |
Brand available locations ÷ total checked locations |
| SKU share |
Brand SKUs ÷ category SKUs |
| Stockout rate |
Out-of-stock observations ÷ total observations |
| Assortment depth |
Number of active SKUs per location |
| Price index |
Brand price compared with competitor average |
| Coverage gap |
Target locations without brand availability |
From 2020 to 2026, the market environment changed from a largely reactive digital retail model to a highly localized fulfillment ecosystem. In 2020, consumer access was disrupted by lockdowns and supply-chain constraints. In 2021, delivery infrastructure stabilized and online grocery gained momentum. In 2022, quick-commerce operators expanded dark-store networks and increased SKU localization. In 2023, brands began paying greater attention to digital shelf execution, not only online sales. In 2024, quick commerce became a major e-grocery channel, with the sector's market share increasing nearly fivefold from 2022 to reach an estimated $6-7 billion. (Reuters) In 2025, quick commerce generated approximately ₹2,800 crore in FMCG sales during the year ending May, up 80% year over year, according to Worldpanel data reported by Mint. (mint) By 2026, one public mapping study recorded 5,625 dark stores across five platforms, reinforcing the need for store-level competitive measurement. (QuickCommerceMap)
Why is stockout frequency an important distribution KPI?
Brand-Level Ice Cream stockout analysis helps companies determine whether lost availability is an isolated inventory issue or evidence of a wider distribution weakness.
For frozen products, stockouts can be particularly important because consumers often make impulse-led purchasing decisions. If a preferred product is unavailable, the shopper may immediately switch to another brand rather than wait for replenishment.
Stockout analysis framework
| KPI |
Formula / Interpretation |
| Stockout Rate |
Out-of-stock checks ÷ total checks |
| Availability Rate |
In-stock checks ÷ total checks |
| Recovery Time |
Time between stockout and replenishment |
| Persistent Stockout |
Repeated OOS observations |
| SKU Stockout Rate |
OOS frequency for individual SKU |
| Brand Stockout Rate |
OOS frequency across brand SKUs |
The 2020-2026 timeline highlights the increasing importance of this metric. In 2020, supply interruptions were frequently caused by mobility restrictions and logistics disruptions. During 2021, improving e-commerce infrastructure reduced some access barriers but demand remained volatile. In 2022, localized fulfillment increased the importance of store-level inventory. In 2023, quick commerce made near-real-time availability more visible to consumers. In 2024, the rapid expansion of the channel made stockouts increasingly relevant to digital retail performance. In 2025, quick-commerce FMCG sales accelerated significantly, while traditional stores continued to account for the majority of FMCG volumes, illustrating the need to monitor both digital and offline channels. (mint) In 2026, with thousands of dark stores serving hundreds of cities, persistent stockouts can indicate localized replenishment, assortment, or distribution problems rather than simply weak consumer demand. (QuickCommerceMap)
For brand managers, this means stockout data should be analyzed by brand, SKU, pincode, platform, city, and time period rather than treated as one national percentage.
How can pincode-level data improve regional distribution planning?
An ice cream pincode availability dataset can help brands move from broad regional assumptions to precise market-level decisions. A brand may have strong national distribution but still be unavailable across important neighborhoods, cities, or consumer clusters.
Pincode-level monitoring can answer questions such as:
- Which pincodes consistently have the widest assortment?
- Where are competitor brands available but our products are absent?
- Which premium SKUs have limited geographic reach?
- Where are stockouts concentrated?
- Which areas should receive additional freezer or inventory support?
- Are Tier-II markets gaining digital availability?
Example availability matrix
| Region |
Pincodes Checked |
Brand Presence |
Competitor Presence |
Opportunity |
| Metro |
500 |
High |
High |
Assortment expansion |
| Tier-I |
400 |
Medium-High |
High |
SKU optimization |
| Tier-II |
300 |
Medium |
Medium-High |
Distribution expansion |
| Emerging |
200 |
Low |
Medium |
Market testing |
From 2020 to 2026, geographic coverage evolved alongside digital commerce. In 2020, location-level online access was constrained by lockdowns and serviceability restrictions. In 2021, digital grocery penetration widened. In 2022, quick-commerce operators increasingly built localized fulfillment capabilities. In 2023, coverage expanded beyond the largest metropolitan markets. In 2024, the channel's rapid growth increased the commercial importance of city and pincode availability. In 2025, non-metro quick-commerce penetration remained much lower than urban levels but was growing rapidly; Worldpanel data cited by Mint showed non-metro quick-commerce household penetration rising from 0.3% in 2023 to 0.4% in 2024 and 1.2% in May 2025. (mint) By 2026, mapped dark stores covered 408 cities across 26 states, although the top 15 cities still accounted for about 61% of mapped stores. (QuickCommerceMap) This makes pincode-level analysis valuable for identifying both saturated markets and underserved growth areas.
How can brands benchmark availability against competitors?
An ice cream brand availability benchmark transforms raw observations into a comparative performance framework. Instead of asking whether a brand is available, decision-makers can ask whether it is more or less available than competing brands in the same locations and channels.
Benchmarking dimensions
| Dimension |
Brand A |
Brand B |
Brand C |
Benchmark Question |
| Availability rate |
Measure |
Measure |
Measure |
Who has the widest reach? |
| SKU count |
Measure |
Measure |
Measure |
Who offers deeper assortment? |
| Stockout rate |
Measure |
Measure |
Measure |
Who maintains better continuity? |
| Pincode coverage |
Measure |
Measure |
Measure |
Who reaches more locations? |
| Price visibility |
Measure |
Measure |
Measure |
Who competes more aggressively? |
| Premium SKU coverage |
Measure |
Measure |
Measure |
Who leads premium access? |
The 2020-2026 shift makes benchmarking more sophisticated. In 2020, comparisons often focused on offline distribution and broad market presence. By 2021, e-commerce listings became an additional visibility indicator. In 2022, quick-commerce expansion introduced a faster-moving retail environment. In 2023, digital shelf execution became more significant as consumers increasingly searched and purchased products online. In 2024, quick commerce's dominant share of e-grocery orders made platform-level comparison strategically important. (Reuters) In 2025, the rapid growth of online FMCG sales demonstrated that digital availability could influence a meaningful portion of shopper access. (mint) In 2026, the expansion of dark-store networks across 408 cities provides a much larger geographic sample for competitive benchmarking. (QuickCommerceMap)
A strong benchmark should therefore compare availability, assortment, pricing, stockouts, and geographic coverage together. This prevents brands from mistaking high SKU counts for genuine market accessibility.
Why Choose Product Data Scrape?
Businesses need structured, recurring data to turn retail availability observations into actionable decisions. Product Data Scrape can support data collection workflows designed around brands, SKUs, platforms, pincodes, pricing, availability, and competitor information.
The approach can help organizations standardize data from multiple retail sources, normalize product attributes, identify duplicate listings, monitor recurring changes, and deliver analytics-ready datasets. Automated collection also makes it easier to compare historical availability with current observations.
For FMCG teams, the biggest value is consistency. Instead of relying on occasional manual checks, businesses can establish repeatable monitoring schedules and use historical records to identify persistent gaps, seasonal patterns, and competitive movements. This supports category managers, sales teams, distributors, and business intelligence professionals who need reliable evidence for distribution and retail decisions.
Conclusion
Retail visibility increasingly depends on whether consumers can actually find and purchase a product at the location and moment they need it. Stockout Monitoring therefore needs to be combined with availability, assortment, pricing, competitor presence, and pincode-level analysis.
A structured Track Brand-Level Ice Cream Availability Study in India approach can help brands identify weak distribution pockets, improve replenishment planning, benchmark competitors, and prioritize high-opportunity markets. India's expanding ice cream category and rapidly growing quick-commerce infrastructure make recurring availability intelligence increasingly valuable. (IBEF)
Partner with Product Data Scrape to build a recurring ice cream availability intelligence dataset and turn retail visibility gaps into smarter distribution decisions!
FAQs
1. What does an ice cream availability study measure?
It measures brand and SKU presence, stock status, assortment, pricing, competitor availability, and geographic coverage across selected retail and quick-commerce channels.
2. Why is pincode-level monitoring important?
Pincode-level monitoring identifies local distribution gaps that national or city-level averages can hide, helping brands prioritize inventory, replenishment, and expansion opportunities.
3. How frequently should ice cream availability be tracked?
High-velocity categories benefit from recurring monitoring. Daily or weekly collection can reveal stockouts, assortment changes, promotions, and competitor movements more effectively than occasional audits.
4. What data can Product Data Scrape provide?
Product Data Scrape can support structured datasets covering products, brands, SKUs, prices, availability, pincodes, platforms, timestamps, and other accessible retail attributes.
5. How can brands use availability data strategically?
Brands can use availability data to benchmark competitors, identify stockout patterns, improve distribution, optimize assortment, prioritize locations, and measure digital retail execution.


 Singapore
 EMAIL
EMAIL
 PHONE
PHONE
















.webp)






