Introduction
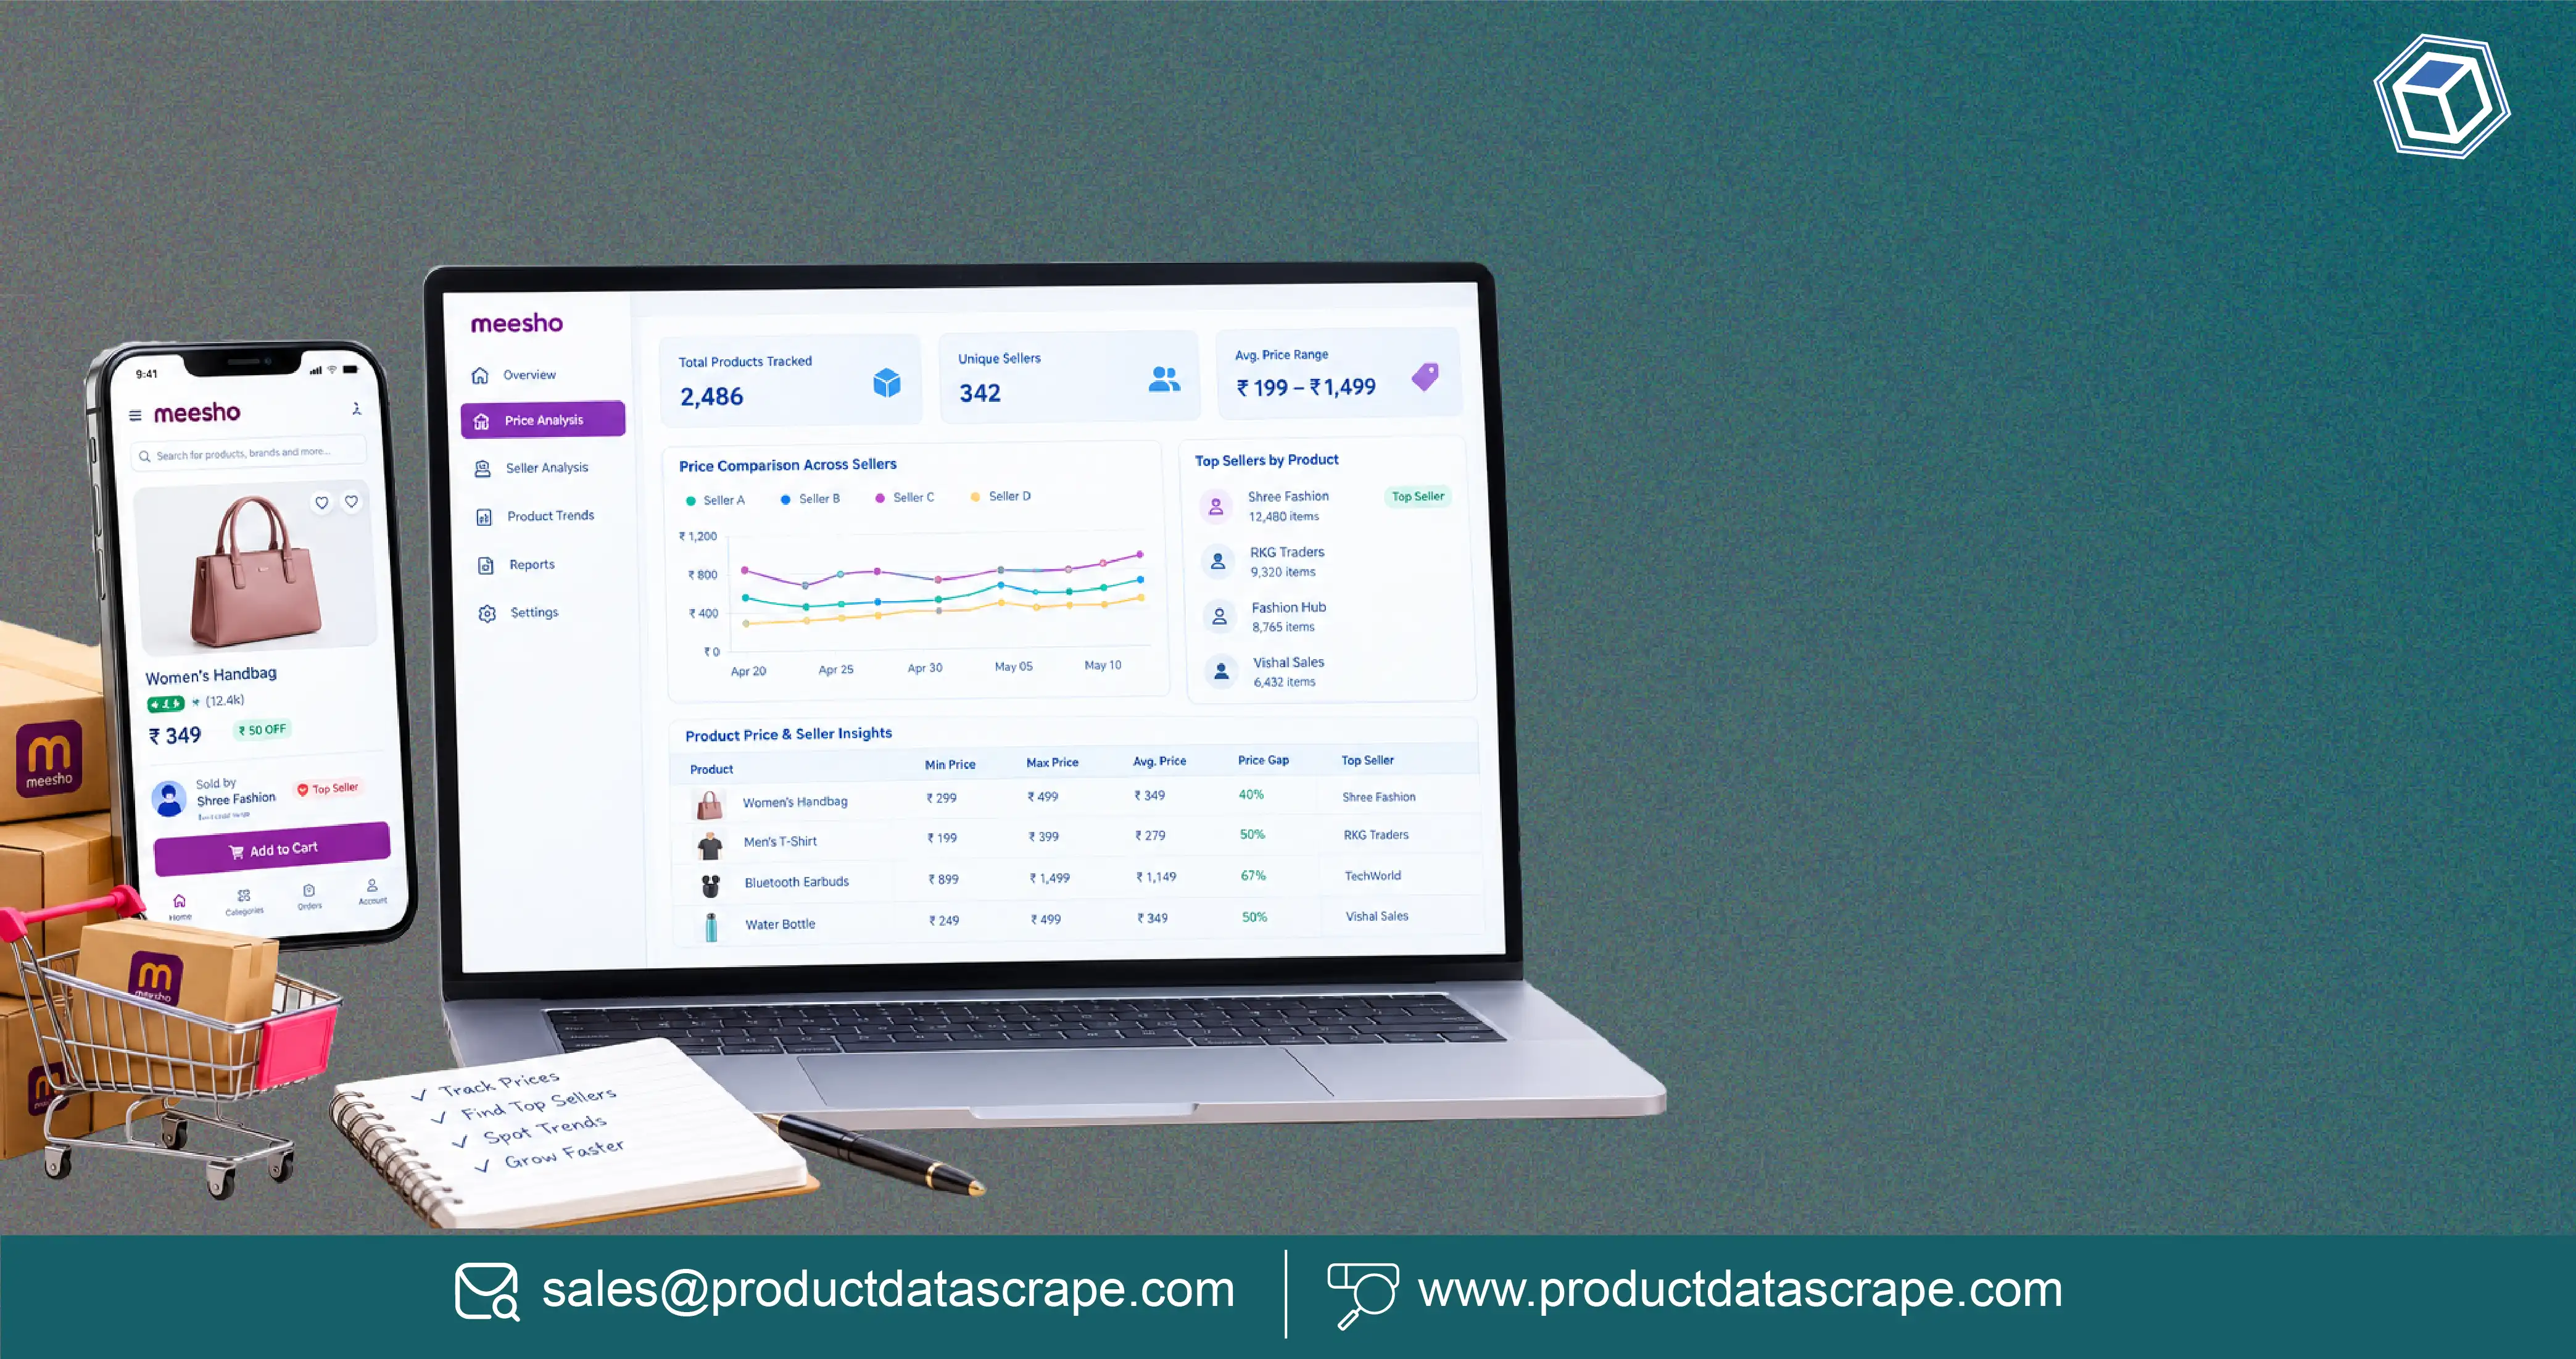
Meesho Ecommerce Product Data Scraping helps brands, retailers, sellers, and market researchers continuously monitor product prices, seller activity, product availability, discounts, ratings, reviews, and category movements. This is particularly valuable on a marketplace operating at Meesho's scale, where millions of listings and frequent catalog changes make manual monitoring difficult.
Meesho's own FY2024 annual report recorded 1.342 billion orders and 156 million annual transacting users, while its last-twelve-month figure through December 2024 reached 187 million users. (Meesho Investor Relations) Its 2025 offer document reported 198.77 million annual transacting users in FY2025 and 1.834 billion placed orders. (Meesho Investor Relations)
A structured Meesho E-commerce Product Dataset can therefore give businesses a historical view of how listings, prices, sellers, and demand signals change.
The core answer is straightforward: recurring marketplace data collection converts constantly changing Meesho listings into structured records that brands can use for price benchmarking, seller monitoring, product research, demand analysis, trend forecasting, and assortment decisions. Meesho Real-Time product Price Monitoring further enables businesses to identify price movements, promotional changes, and competitive pricing shifts as they occur.
For example, a fashion brand can monitor 500 competing products daily and identify which SKUs repeatedly receive discounts, which sellers gain visibility, which products disappear, and which price points remain competitive.
How Can Businesses Identify Fast-Moving Categories?
An effective meesho ecommerce scraper product data workflow can capture product-level information at scale, allowing businesses to analyze categories rather than relying on individual listings. Scraping Fast-Selling Categories From Meesho can help identify products with strong visibility based on available marketplace signals such as ratings, reviews, listing activity, pricing changes, and recurring availability.
Meesho's scale makes category-level intelligence especially relevant. Its FY2024 annual report stated that orders reached 1.342 billion, compared with 1.024 billion in FY2023 and 610 million in FY2022. Annual transacting users also increased from 110 million in FY2022 to 136 million in FY2023 and 156 million in FY2024. (Meesho Investor Relations)
The company's 2025 disclosures showed continued expansion, with 1.834 billion orders and 198.77 million annual transacting users in FY2025. (Meesho Investor Relations)
Meesho's reported operating scale
| Financial year / period |
Placed orders |
Annual transacting users |
| FY2022 |
610 million |
110 million |
| FY2023 |
1.024 billion |
136 million |
| FY2024 |
1.342 billion |
156 million |
| FY2025 |
1.834 billion |
198.77 million |
| LTM Dec. 2024 |
1.333 billion Apr–Dec orders |
187 million |
Source: Meesho Annual Report FY2023–24 and Meesho 2025 offer document. Figures are company-reported. (Meesho Investor Relations)
What businesses can monitor
A category-monitoring dataset can organize:
- Product name and SKU
- Category and subcategory
- Selling price
- MRP
- Discount
- Rating and review count
- Seller
- Product availability
- Product URL
- Listing changes
- Collection timestamp
Practical example
Suppose a consumer brand sells kitchen organizers. Instead of manually searching Meesho for competing products, an automated collection system can monitor hundreds of listings and identify categories where new products are appearing frequently.
If storage boxes, spice racks, and kitchen organizers consistently show increasing listing activity and review accumulation, the business can investigate those categories for assortment opportunities.
The data should be treated as a market signal rather than direct proof of sales velocity because public listing information does not reveal every transaction.
How Can Brands Detect Price Changes Quickly?
Meesho Real-Time product Price Monitoring gives brands a structured way to observe changes in selling prices, discounts, MRP, and seller-level offers. When combined with Real-time price tracking, recurring observations can reveal whether a price movement is temporary or part of a longer pattern.
This matters because Meesho's marketplace is strongly positioned around affordability. Its 2025 offer document reported that average order value declined from ₹336.71 in FY2023 to ₹298.36 in FY2024 and ₹274.27 in FY2025, while placed orders increased substantially. (Meesho Investor Relations)
Reported Meesho order and AOV movement
| Period |
Average Order Value |
Placed Orders |
| FY2023 |
₹336.71 |
1,024.34 million |
| FY2024 |
₹298.36 |
1,341.94 million |
| FY2025 |
₹274.27 |
1,834.40 million |
| Three months ended June 30, 2025 |
₹269.36 |
561.86 million |
Source: Meesho 2025 offer document. (Meesho Investor Relations)
The numbers demonstrate why price monitoring needs context. A lower average order value does not mean every product became cheaper. It reflects the marketplace's overall transaction mix and purchasing behavior.
A useful monitoring framework
Businesses can calculate:
Price gap = Competitor price − Own price
They can also track:
Discount depth = (MRP − Selling Price) / MRP × 100
For example, if a competitor lists a ₹999 product at ₹699 today and ₹749 tomorrow, the dataset records both observations. Analysts can then determine whether the change was a short promotion or a sustained repricing event.
Daily or near-real-time monitoring is particularly useful during:
- Festive campaigns
- Category promotions
- New product launches
- Clearance events
- Seller-level discounting
- Competitive price changes
The objective is not simply to collect prices. It is to establish a reliable price history that supports commercial decisions.
How Can Historical Data Support Demand Forecasting?
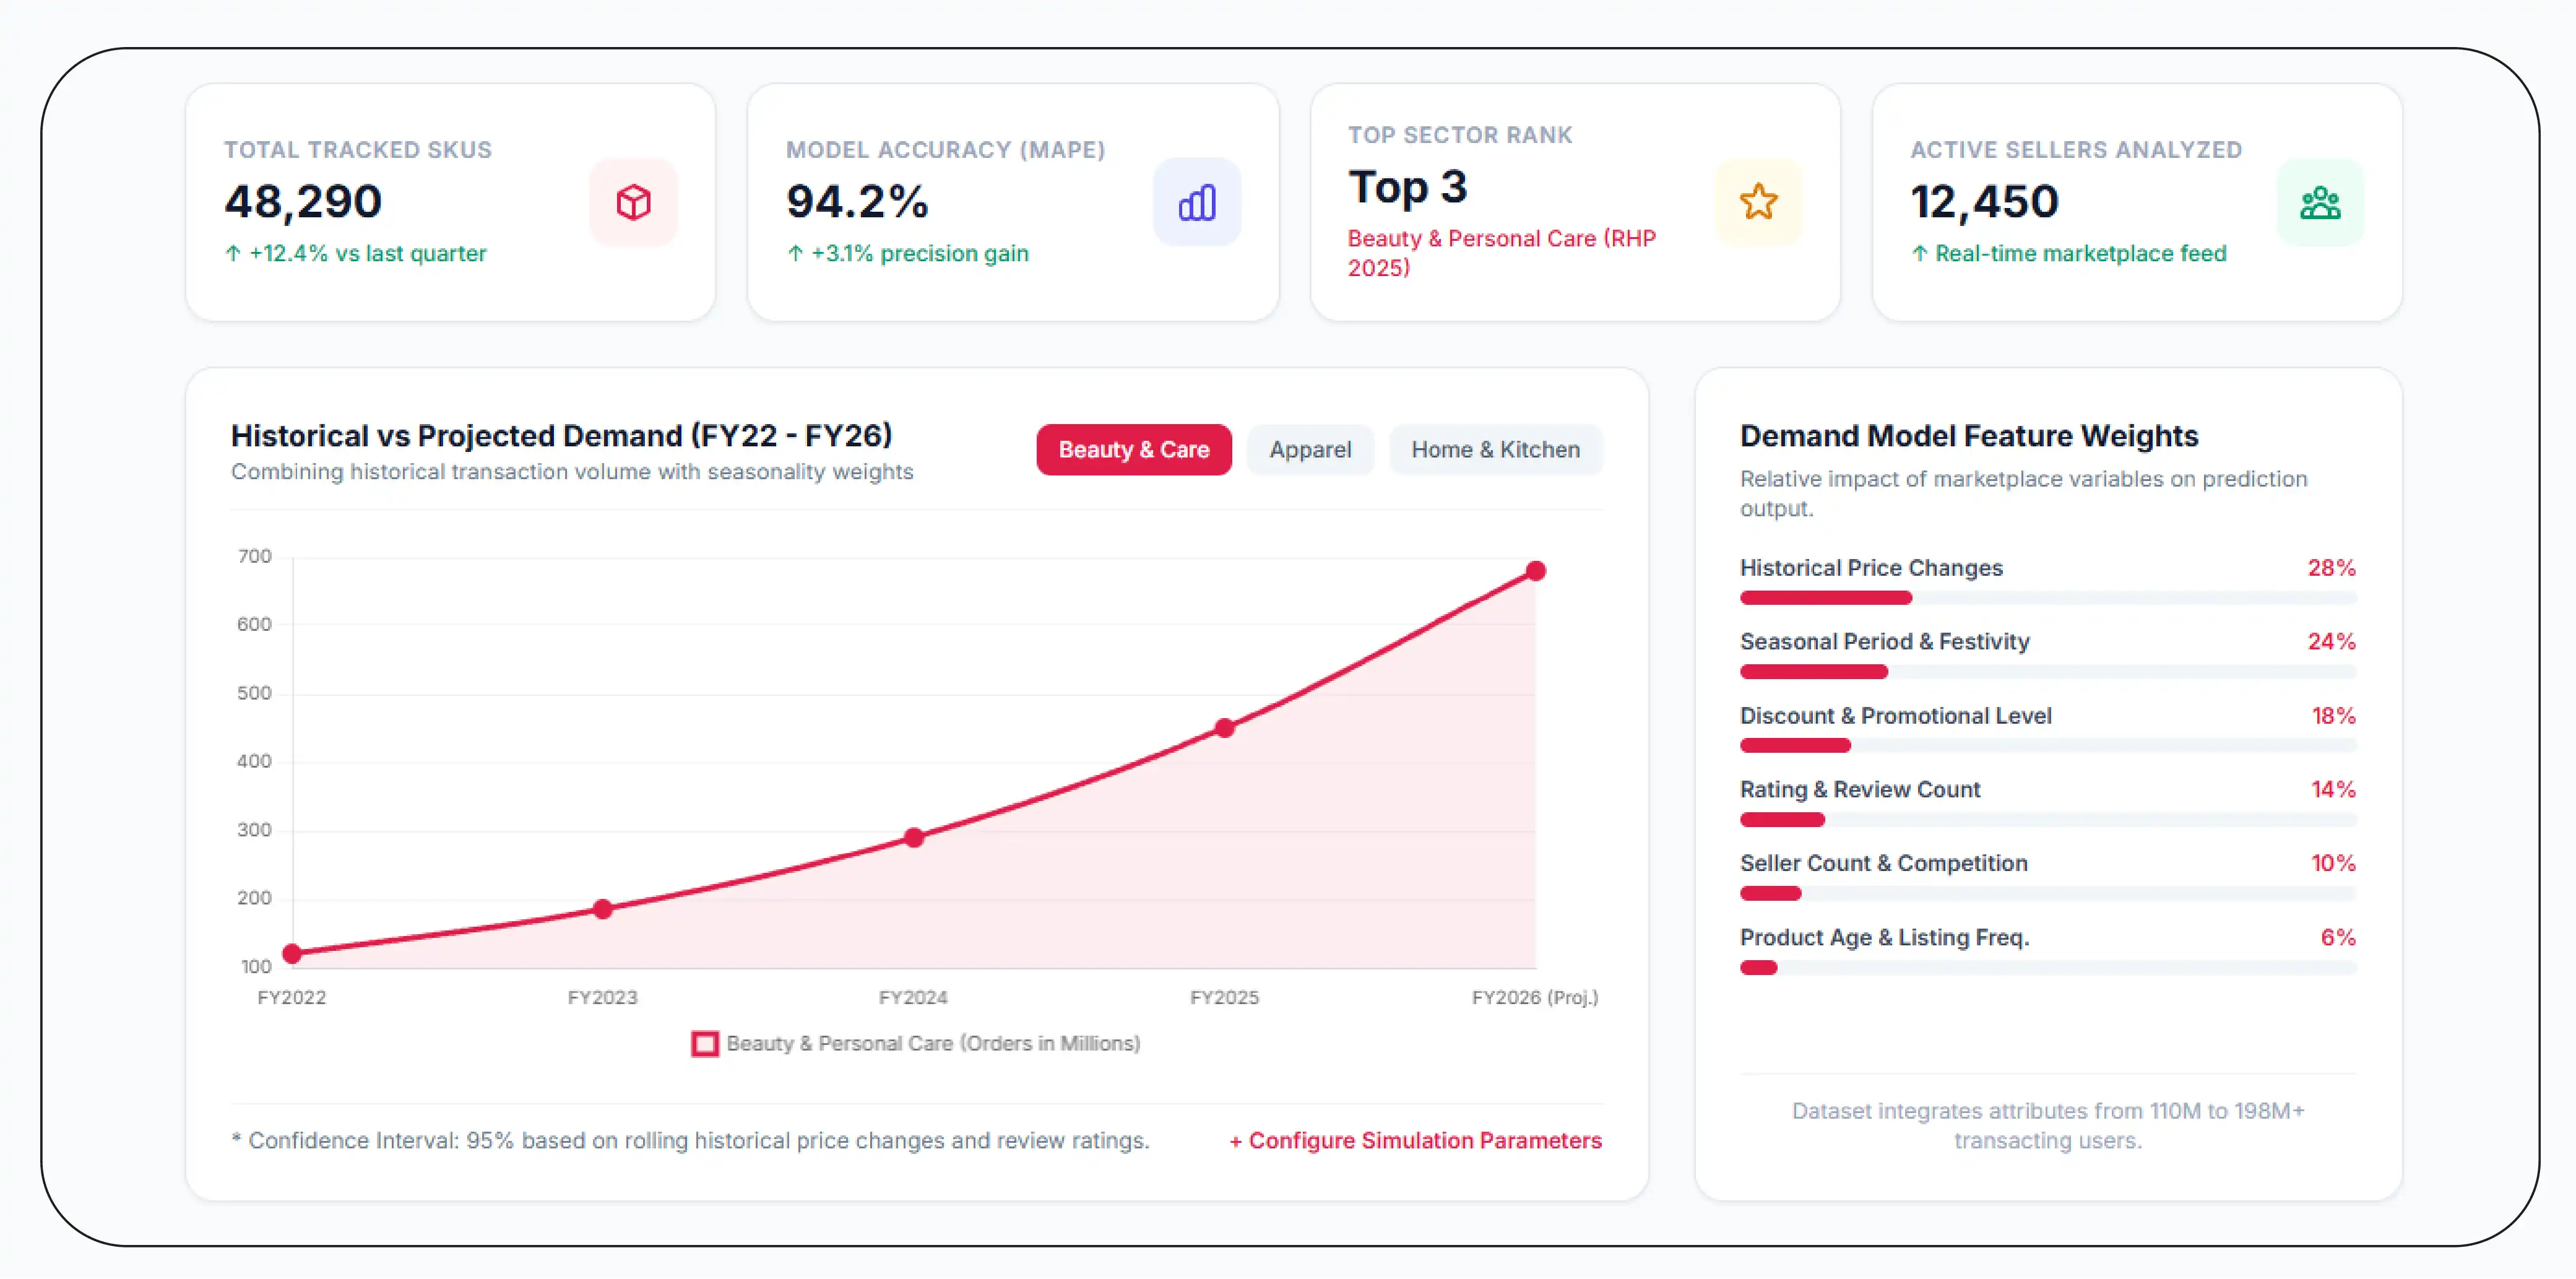
A Meesho Product Demand Forecasting Dataset combines historical observations with product attributes and marketplace signals to help analysts build demand-related models.
A demand model may use variables such as:
- Product category
- Price
- Discount
- Rating
- Review count
- Availability
- Seller count
- Product age
- Seasonal period
- Listing frequency
- Historical price changes
Meesho's reported growth provides context for why historical marketplace data can be valuable. Its annual transacting users increased from 110 million in FY2022 to 198.77 million in FY2025, while placed orders increased from 610 million to 1.834 billion over the same period. (Meesho Investor Relations)
The platform's 2025 RHP also reported that Beauty and Personal Care ranked among the top three Indian e-commerce players by placed orders for the last twelve months ended September 30, 2025. (Meesho Investor Relations)
From 2020 to 2026
India's e-commerce environment changed significantly between 2020 and 2026. The pandemic accelerated digital purchasing, while subsequent years brought greater participation from smaller cities, broader marketplace assortments, and increased digital adoption.
By 2025, IBEF reported that India's online shopper base had reached approximately 290–300 million, with Tier-2 and smaller cities accounting for around 65% of new shoppers. India's online retail market was approximately US$80 billion in FY2026, according to IBEF's May 2026 industry overview. (India Brand Equity Foundation)
This expansion makes historical datasets useful for identifying recurring patterns rather than relying on isolated observations.
Practical example
A seller may discover that a particular category consistently receives more reviews and listing activity during certain months. Historical data can help distinguish seasonal behavior from a permanent change in product demand.
However, forecasting should combine marketplace data with internal sales, advertising, inventory, and business data. Public marketplace observations alone should not be presented as exact sales forecasts.
How Can Product History Reveal Emerging Market Trends?
Meesho Product Data for Trend Forecasting can help brands identify changes in assortment, pricing, seller participation, product attributes, and customer engagement.
Trend analysis becomes more useful when the dataset is collected consistently. A one-time scrape can show what exists today. A historical dataset can show what is changing.
Meesho's reported category position provides an important example. In the last twelve months ended September 30, 2025, Meesho reported the highest placed orders among Indian e-commerce players in fashion and home, kitchen and furnishing, while ranking among the top three in beauty and personal care. (Meesho Investor Relations)
Key reported category indicators
| Category |
Meesho reported position |
Period |
| Fashion |
Highest placed orders among e-commerce players |
LTM ended Sept. 30, 2025 |
| Home, kitchen & furnishing |
Highest placed orders among e-commerce players |
LTM ended Sept. 30, 2025 |
| Beauty & personal care |
Among top three |
LTM ended Sept. 30, 2025 |
Source: Meesho 2025 RHP. (Meesho Investor Relations)
2020–2026 trend perspective
Between 2020 and 2026, Indian e-commerce shifted from pandemic-driven adoption toward a much broader digital retail ecosystem. IBEF reports that India's e-commerce industry reached approximately ₹10,82,875 crore (US$125 billion) in 2024 and is projected to reach ₹29,88,735 crore (US$345 billion) by 2030. (India Brand Equity Foundation)
For brands, this means product trend forecasting increasingly requires continuous digital shelf observations.
A useful trend model can monitor:
New listings → price movement → review accumulation → rating changes → availability → seller expansion
For example, if several sellers begin listing similar home-decor products, prices fall within a narrow range, and review activity increases over subsequent weeks, a brand may investigate whether the product category is becoming more competitive.
The dataset identifies the pattern; commercial teams determine its business significance.
How Can Brands Monitor Supplier and Seller Activity?
Track Meesho Supplier Data for Ecommerce Brands to understand how seller participation changes within target categories. Seller intelligence can include seller names, product associations, ratings where publicly available, product counts, pricing, availability, and listing activity.
Meesho's scale creates a substantial monitoring opportunity. The company's investor-relations site currently reports more than 1.04 million annual transacting sellers and more than 2.83 billion placed orders for the quarter ended June 30, 2026. (Meesho Investor Relations)
That latest company-reported scale also illustrates why manual seller monitoring becomes difficult.
Reported marketplace scale
| Metric |
Reported figure |
Period |
| Annual transacting sellers |
1.04 million+ |
Quarter ended June 30, 2026 |
| Annual transacting users |
274 million+ |
Quarter ended June 30, 2026 |
| Placed orders |
2.83 billion+ |
Quarter ended June 30, 2026 |
| FY2025 annual transacting users |
198.77 million |
FY2025 |
| FY2025 placed orders |
1.834 billion |
FY2025 |
Source: Meesho Investor Relations and 2025 offer document. (Meesho Investor Relations)
What seller monitoring can reveal
Brands can use recurring seller data to identify:
- New sellers entering a category
- Sellers repeatedly changing prices
- Products associated with multiple sellers
- Availability differences
- Seller concentration
- Changes in seller assortment
- Competitive discounting
- Product duplication
Practical example
Imagine a footwear brand monitoring 200 competing products. If a category initially has 30 active sellers but grows to 75, while the average displayed price falls and product variety increases, the brand has evidence of growing marketplace competition.
That information can inform assortment, pricing, promotion, and seller-partnership discussions.
Seller data should be collected and used in accordance with applicable website terms, privacy requirements, and data-access rules.
What Can an API-Based Workflow Automate?
A Meesho Scraping API can provide a structured interface for delivering marketplace information to analytics platforms, databases, dashboards, or internal applications. Meesho Ecommerce Product Data Scraping becomes significantly more useful when collection, normalization, validation, and delivery are integrated into one repeatable pipeline.
An API-oriented workflow can include:
- Source selection
- Product discovery
- Data extraction
- Attribute normalization
- Duplicate removal
- Validation
- Timestamping
- Historical storage
- API or file delivery
- Dashboard integration
India's broader e-commerce expansion reinforces the value of automated data infrastructure. IBEF reported India's e-commerce industry at approximately US$125 billion in 2024 and projected US$345 billion by 2030. (India Brand Equity Foundation)
Meesho itself has continued investing in technology and AI. In 2026, the company announced initiatives including PRISM for intent-driven discovery and Vaani, described as a generative-AI-powered conversational voice shopping assistant. (Meesho Investor Relations)
Building a 2020–2026 intelligence layer
The value of automated extraction is not limited to current records. Historical datasets can be used to compare product visibility and pricing across multiple years.
A mature workflow can therefore maintain:
| Data layer |
Example use |
| Current product data |
Current assortment monitoring |
| Historical prices |
Price-change analysis |
| Seller history |
Supplier and competitor tracking |
| Availability history |
Stock visibility |
| Review history |
Customer-response analysis |
| Category history |
Trend forecasting |
| Promotion history |
Discount analysis |
For a brand, this converts marketplace monitoring from an occasional research exercise into an ongoing data-intelligence process.
Why Choose Product Data Scrape?
Product Survival Analysis on Meesho can help businesses study how long products remain visible, available, competitively priced, and relevant within a monitored assortment. A structured data pipeline can capture repeated observations and preserve historical records for comparison.
For brands, the benefit is broader than scraping individual product pages. A properly designed workflow can combine product attributes, pricing, sellers, availability, ratings, reviews, and timestamps into an analysis-ready dataset.
Meesho Ecommerce Product Data Scraping can be customized around categories, SKUs, seller groups, locations, collection frequency, and required output fields.
This approach can support competitive intelligence teams, marketplace sellers, retailers, consumer brands, researchers, and e-commerce analysts that need repeatable data rather than isolated snapshots.
The emphasis should remain on data quality: consistent fields, validation, duplicate handling, historical storage, and clear timestamps.
Conclusion
Brands cannot reliably understand a fast-changing marketplace from occasional manual checks. Meesho Scraper workflows can collect recurring product, price, seller, availability, rating, and review information so businesses can compare marketplace changes over time.
Meesho Ecommerce Product Data Scraping can support price benchmarking, seller intelligence, product research, trend analysis, demand modeling, and assortment monitoring. Historical observations also help separate temporary price movements from longer-term market patterns.
For organizations building scalable marketplace intelligence, Product Data Scrape can design structured collection and delivery workflows around specific categories, products, sellers, and business requirements.
Contact Product Data Scrape to build a scalable Meesho marketplace data solution for pricing, product, seller, and trend intelligence. You can also reach us for all your mobile app scraping, data collection, web scraping, and instant data scraper service requirements!
FAQs
1. What data can brands collect from Meesho?
Brands can collect publicly available product attributes, prices, discounts, seller information, availability, ratings, reviews, categories, URLs, and timestamps for structured marketplace analysis.
2. How can Meesho data support pricing decisions?
Historical price observations help businesses compare competing SKUs, identify discount patterns, monitor seller pricing, and understand how displayed prices change across monitored products.
3. Can Meesho data help identify product trends?
Yes. Repeated observations can reveal new listings, category expansion, price movements, review growth, seller participation, availability changes, and other marketplace signals.
4. How frequently should marketplace data be collected?
Frequency depends on the business objective. Daily collection suits price and assortment monitoring, while higher-frequency collection can be useful for rapidly changing promotional environments.
5. Can Product Data Scrape provide customized Meesho datasets?
Yes. Product Data Scrape can structure datasets around selected categories, products, sellers, fields, collection schedules, historical requirements, and preferred delivery formats.


 Singapore
 EMAIL
EMAIL
 PHONE
PHONE


.webp)
.webp)













.webp)






