Introduction
Marketplace Seller & Product API helps brands, retailers, marketplace operators, and research teams organize seller, product, pricing, rating, and assortment information at scale. It supports competitive analysis by turning marketplace listings into structured data that teams can compare across products, sellers, categories, and platforms.
The need for structured marketplace intelligence has grown as e-commerce competition has expanded. Businesses selling across Meesho, Amazon, Flipkart, Myntra, and Ajio face constant changes in seller activity, product pricing, assortment, availability, ratings, and customer feedback.
Marketplace selling intelligence gives decision-makers a broader view of these changes. Instead of relying on occasional manual checks, businesses can maintain historical datasets and identify patterns over time.
The figures below are hypothetical research examples designed to demonstrate how marketplace data programs can scale from 2020 to 2026. They are not official marketplace statistics.
| Year |
Hypothetical marketplace listings monitored |
Sellers monitored |
Primary objective |
| 2020 |
100,000 |
10,000 |
Market mapping |
| 2021 |
175,000 |
18,000 |
Seller research |
| 2022 |
300,000 |
30,000 |
Price benchmarking |
| 2023 |
500,000 |
45,000 |
Competitive analysis |
| 2024 |
800,000 |
65,000 |
Assortment intelligence |
| 2025 |
1.25 million |
90,000 |
Market monitoring |
| 2026 |
1.8 million |
125,000 |
Automated intelligence |
The core benefit is consistency. Structured marketplace data allows businesses to compare similar products, monitor seller movements, detect pricing changes, and identify assortment gaps.
How Can Businesses Monitor Marketplace Prices and Product Listings?
Scrape Marketplace Product Listings, Price monitoring can help businesses create structured records of products, sellers, prices, categories, availability, and other relevant attributes. This information supports competitive benchmarking and pricing research across large marketplace catalogs.
Price monitoring becomes more useful when businesses preserve historical observations. A single price tells a retailer what a product costs today. Repeated observations show how that price changes over time.
For example, a category manager can compare the price of similar products across sellers. The team can then identify the lowest observed price, average price, median price, and changes from previous observations.
| Year |
Hypothetical listings |
Price observations |
Main business use |
| 2020 |
100,000 |
500,000 |
Initial benchmarking |
| 2021 |
170,000 |
850,000 |
Competitor monitoring |
| 2022 |
280,000 |
1.4 million |
Price comparison |
| 2023 |
450,000 |
2.25 million |
Dynamic monitoring |
| 2024 |
700,000 |
3.5 million |
Category intelligence |
| 2025 |
1.1 million |
5.5 million |
Pricing strategy |
| 2026 |
1.6 million |
8 million |
Continuous benchmarking |
Figures are hypothetical.
Businesses can monitor product title, SKU, seller, listed price, discounted price, availability, category, brand, and collection timestamp. Unit-price normalization can make comparisons more accurate when products have different pack sizes.
Price monitoring should not lead to automatic price changes without commercial review. A competitor discount may be temporary. Marketplace prices may also differ because of seller ratings, fulfillment methods, promotions, or product variations.
Historical data helps provide context. Teams can determine whether a price movement is a one-time event or part of a longer trend.
This makes structured listing data useful for pricing teams, category managers, and marketplace sellers seeking better competitive visibility.
How Can Seller-Level Data Improve Marketplace Competition Analysis?
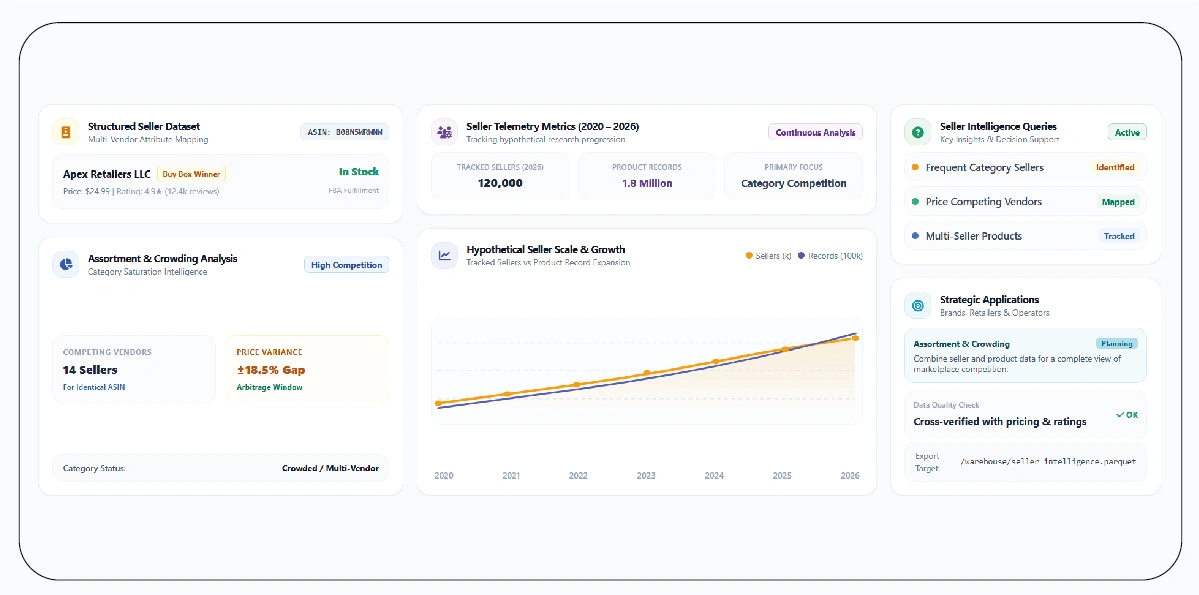
Scrape Amazon Seller Data, Marketplace Seller & Product API workflows can help businesses organize seller information alongside product-level observations. Seller intelligence can reveal who competes in a category, how many sellers offer similar products, and how seller activity changes over time.
Seller-level analysis is valuable because product competition does not come only from brands. Multiple sellers may offer identical or comparable products at different prices.
A structured seller dataset can include seller name, product association, price, availability, ratings, review counts, category, and collection date where permitted.
| Year |
Hypothetical sellers tracked |
Product-seller records |
Research focus |
| 2020 |
10,000 |
100,000 |
Seller discovery |
| 2021 |
17,000 |
175,000 |
Competitive mapping |
| 2022 |
28,000 |
300,000 |
Seller comparison |
| 2023 |
42,000 |
500,000 |
Market intelligence |
| 2024 |
60,000 |
800,000 |
Seller monitoring |
| 2025 |
85,000 |
1.25 million |
Category competition |
| 2026 |
120,000 |
1.8 million |
Continuous analysis |
Figures are hypothetical research examples.
Seller analysis can answer practical questions. Which sellers appear frequently in a category? Which sellers compete on price? Which sellers maintain strong ratings? Which products attract multiple sellers?
Brands can use this information to understand marketplace saturation. Retailers can identify crowded categories. Marketplace operators can study seller activity.
Seller data can also support assortment planning. If several sellers consistently introduce similar products, a category may be highly competitive.
However, seller activity should be interpreted alongside pricing, availability, product quality, and customer feedback.
Combining seller and product information creates a more complete view of marketplace competition.
How Can Catalog Data Help Identify Assortment Gaps?
Scrape Marketplace Catalog Data to organize product names, brands, categories, specifications, prices, availability, and other attributes into a structured marketplace dataset. Catalog intelligence helps businesses understand what products are available and where gaps may exist.
Assortment analysis is especially important for brands expanding into new marketplace categories. A business needs to understand competitor coverage before adding products.
Catalog data can be grouped by category, subcategory, brand, price range, product type, size, color, material, or other attributes.
| Year |
Hypothetical catalog records |
Categories analyzed |
Main use |
| 2020 |
120,000 |
500 |
Catalog mapping |
| 2021 |
200,000 |
700 |
Product comparison |
| 2022 |
350,000 |
900 |
Assortment research |
| 2023 |
550,000 |
1,200 |
Category analysis |
| 2024 |
850,000 |
1,500 |
Gap identification |
| 2025 |
1.3 million |
1,900 |
Competitive assortment |
| 2026 |
1.9 million |
2,300 |
Continuous monitoring |
Figures are hypothetical.
A structured catalog can reveal which brands dominate particular categories. It can also show whether competitors offer more product variations.
For example, a fashion business may compare product counts by size and color. An electronics brand may compare storage configurations and specifications. A beauty company may compare product formats and pack sizes.
Assortment gaps should be evaluated carefully. A missing product does not automatically represent an opportunity. Businesses should consider customer demand, margins, supply availability, competition, and operational costs.
Historical catalog snapshots also reveal product introductions and removals. A category with frequent new-product activity may indicate strong competitive interest.
Catalog data therefore supports more informed decisions about product expansion, category positioning, and marketplace strategy.
How Can Product Ratings Improve Competitive Product Analysis?
Marketplace Product Rating Data can help businesses understand customer perception and compare products beyond price and availability. Ratings provide an additional layer of competitive intelligence.
Two products may have similar prices but very different customer ratings. A product with a lower price and poor ratings may compete differently from a higher-priced product with strong customer feedback.
Rating analysis can include average rating, rating distribution, review volume, rating changes, and comparisons between competing products.
| Year |
Hypothetical products analyzed |
Rating records |
Main objective |
| 2020 |
75,000 |
500,000 |
Product benchmarking |
| 2021 |
120,000 |
800,000 |
Customer perception |
| 2022 |
200,000 |
1.3 million |
Competitive analysis |
| 2023 |
325,000 |
2 million |
Product research |
| 2024 |
500,000 |
3.2 million |
Quality benchmarking |
| 2025 |
800,000 |
5 million |
Market intelligence |
| 2026 |
1.2 million |
7.5 million |
Continuous monitoring |
Figures are hypothetical.
Businesses can use rating data to identify products with consistently high customer satisfaction. They can also investigate products whose ratings decline over time.
Rating changes may indicate changes in product quality, customer expectations, packaging, fulfillment, or other factors. They should therefore be interpreted with additional context.
For marketplace sellers, ratings can influence product positioning. A business may decide to improve product descriptions, packaging, service, or product quality after identifying recurring customer concerns.
Brands can also compare rating performance against competitors.
Price, rating, review volume, and availability can be analyzed together. This creates a stronger competitive framework than price monitoring alone.
The result is a more customer-focused marketplace strategy.
How Can Businesses Monitor Fashion Marketplace Changes?
monitor Ajio Marketplace Product data to analyze product assortment, pricing, seller activity, ratings, availability, and category movements in fashion-focused marketplace research. Fashion categories can change rapidly, making recurring monitoring valuable.
Fashion businesses often manage large catalogs with many combinations of sizes, colors, styles, brands, and product types.
Marketplace data can help identify changes in these dimensions.
| Year |
Hypothetical fashion listings |
Brands tracked |
Main research focus |
| 2020 |
90,000 |
4,000 |
Category mapping |
| 2021 |
150,000 |
5,500 |
Brand comparison |
| 2022 |
250,000 |
7,000 |
Pricing research |
| 2023 |
400,000 |
9,000 |
Assortment monitoring |
| 2024 |
650,000 |
12,000 |
Competitive intelligence |
| 2025 |
950,000 |
15,000 |
Trend monitoring |
| 2026 |
1.4 million |
20,000 |
Automated analysis |
Figures are hypothetical examples.
A fashion brand can monitor product introductions, price changes, discount patterns, and assortment depth. It can also compare categories such as footwear, apparel, accessories, and beauty.
Size and color availability can provide additional insight. A product with limited sizes may indicate inventory movement, while repeated availability changes can signal supply fluctuations.
Businesses can use historical snapshots to identify seasonal patterns. For example, certain categories may experience increased activity before major shopping periods.
Fashion data should not be viewed only as a pricing tool. It can also support trend research and product planning.
By combining product, seller, rating, and availability information, brands can develop a broader view of marketplace activity.
How Can Ratings and Reviews Support Customer Sentiment Analysis?
Ratings, reviews and sentiment analysis can help businesses move beyond numerical product scores and understand customer opinions at scale. Reviews often contain information about quality, sizing, packaging, delivery, usability, durability, and product expectations.
A structured review dataset can be analyzed for recurring themes. Natural-language processing can classify positive, negative, and neutral sentiment where appropriate.
| Year |
Hypothetical reviews analyzed |
Products covered |
Analysis focus |
| 2020 |
300,000 |
50,000 |
Basic sentiment |
| 2021 |
500,000 |
80,000 |
Customer themes |
| 2022 |
850,000 |
130,000 |
Product feedback |
| 2023 |
1.4 million |
200,000 |
Competitive sentiment |
| 2024 |
2.2 million |
325,000 |
Quality research |
| 2025 |
3.5 million |
500,000 |
Advanced analysis |
| 2026 |
5.5 million |
800,000 |
Continuous sentiment monitoring |
Figures are hypothetical.
Review analysis can help identify common complaints and strengths. For example, customers may repeatedly praise product quality but criticize packaging. This information can support product improvement.
Businesses can also compare sentiment across competitors.
A product with similar pricing but stronger customer sentiment may have a competitive advantage. Conversely, a highly rated product with limited availability may represent a potential opportunity for other sellers.
Sentiment analysis should account for language, context, sarcasm, review authenticity, and sample size. Automated sentiment scores should not replace human review for important decisions.
Combining reviews with ratings, prices, and product attributes creates richer marketplace intelligence.
The goal is to understand not only what customers rate, but also why they rate it that way.
How Can Businesses Combine Marketplace Data for Better Decisions?
Marketplace intelligence becomes more powerful when multiple datasets are connected.
A pricing dataset can show competitive price differences. Seller data can show who is competing. Catalog data can show assortment depth. Rating data can show customer perception. Reviews can reveal specific product issues.
These signals can be combined into a marketplace scorecard.
| Intelligence area |
Key question |
Business decision |
| Pricing |
How does our price compare? |
Pricing strategy |
| Sellers |
Who are our competitors? |
Competitive positioning |
| Assortment |
Where are product gaps? |
Product expansion |
| Ratings |
How do customers perceive products? |
Quality strategy |
| Reviews |
What do customers discuss? |
Product improvement |
| Availability |
Which products are active? |
Inventory planning |
This integrated approach reduces the risk of making decisions from one metric.
For example, a product may have a low price but weak ratings. Another may have a higher price but stronger customer sentiment. A simple price comparison would miss this distinction.
Structured marketplace data provides the context needed for better decisions.
What Is the Best Workflow for Marketplace Data Intelligence?
A practical marketplace intelligence workflow can follow a repeatable process.
First, define the business objective. Pricing, assortment, seller intelligence, and product research require different data fields.
Second, identify relevant marketplaces and categories. Focus on sources that matter to the target audience.
Third, establish permitted data collection methods. Businesses should respect applicable platform terms, permissions, and legal requirements.
Fourth, standardize product and seller records. Consistent fields make cross-market comparisons easier.
Fifth, preserve historical observations. Historical data is essential for detecting trends and changes.
Sixth, validate the dataset. Remove duplicates and address missing or inconsistent records.
Seventh, calculate business metrics. Examples include price gaps, assortment counts, seller concentration, rating averages, and review sentiment.
Finally, connect the findings to business decisions.
The objective is not to collect the largest possible dataset. It is to create useful intelligence that improves pricing, assortment, and competitive decisions.
Why Choose Product Data Scrape?
Product Data Scrape supports structured marketplace intelligence workflows designed around product, seller, pricing, assortment, and customer-feedback research.
Businesses can organize marketplace information into consistent datasets that support competitive benchmarking and recurring monitoring. This approach reduces manual research and gives teams historical context for marketplace decisions.
Extract Myntra Data, Marketplace Seller & Product API workflows can help businesses study product catalogs, pricing, availability, seller information, ratings, and other relevant marketplace signals where authorized access is available.
The value comes from connecting data with business goals. Pricing teams can monitor competitive movement. Category managers can identify assortment gaps. Brands can evaluate customer feedback. Marketplace teams can study seller activity.
A structured data foundation also makes it easier to integrate information into dashboards, analytics systems, and internal applications.
Conclusion
Competitive marketplace decisions require more than occasional price checks. Businesses need visibility into sellers, products, pricing, availability, ratings, reviews, and assortment changes.
Structured data connects these signals.
Pricing teams can benchmark products. Category managers can identify assortment gaps. Brands can monitor competitors. Seller teams can understand marketplace activity. Product teams can use customer feedback to identify improvement opportunities.
A reliable historical dataset also helps businesses recognize trends rather than reacting to isolated marketplace changes.
The Meesho dataset, Marketplace Seller & Product API approach can support broader marketplace research by connecting product and seller information with pricing, ratings, assortment, and customer sentiment analysis.
Businesses should always use appropriate data-access methods and comply with applicable platform terms, permissions, and legal requirements.
Build a stronger marketplace intelligence strategy with Product Data Scrape and turn structured seller, product, pricing, assortment, rating, and review data into actionable competitive insights!


 Singapore
 EMAIL
EMAIL
 PHONE
PHONE















.webp)






