The Client
A mid-market Indian apparel brand — men's and women's casualwear, roughly 340 active styles on Flipkart, sold through two authorised sellers. Flipkart was the brand's largest online channel by volume.
Client details are anonymised. Figures are representative of the engagement.
The Problem: Healthy Listings, Collapsing Conversion
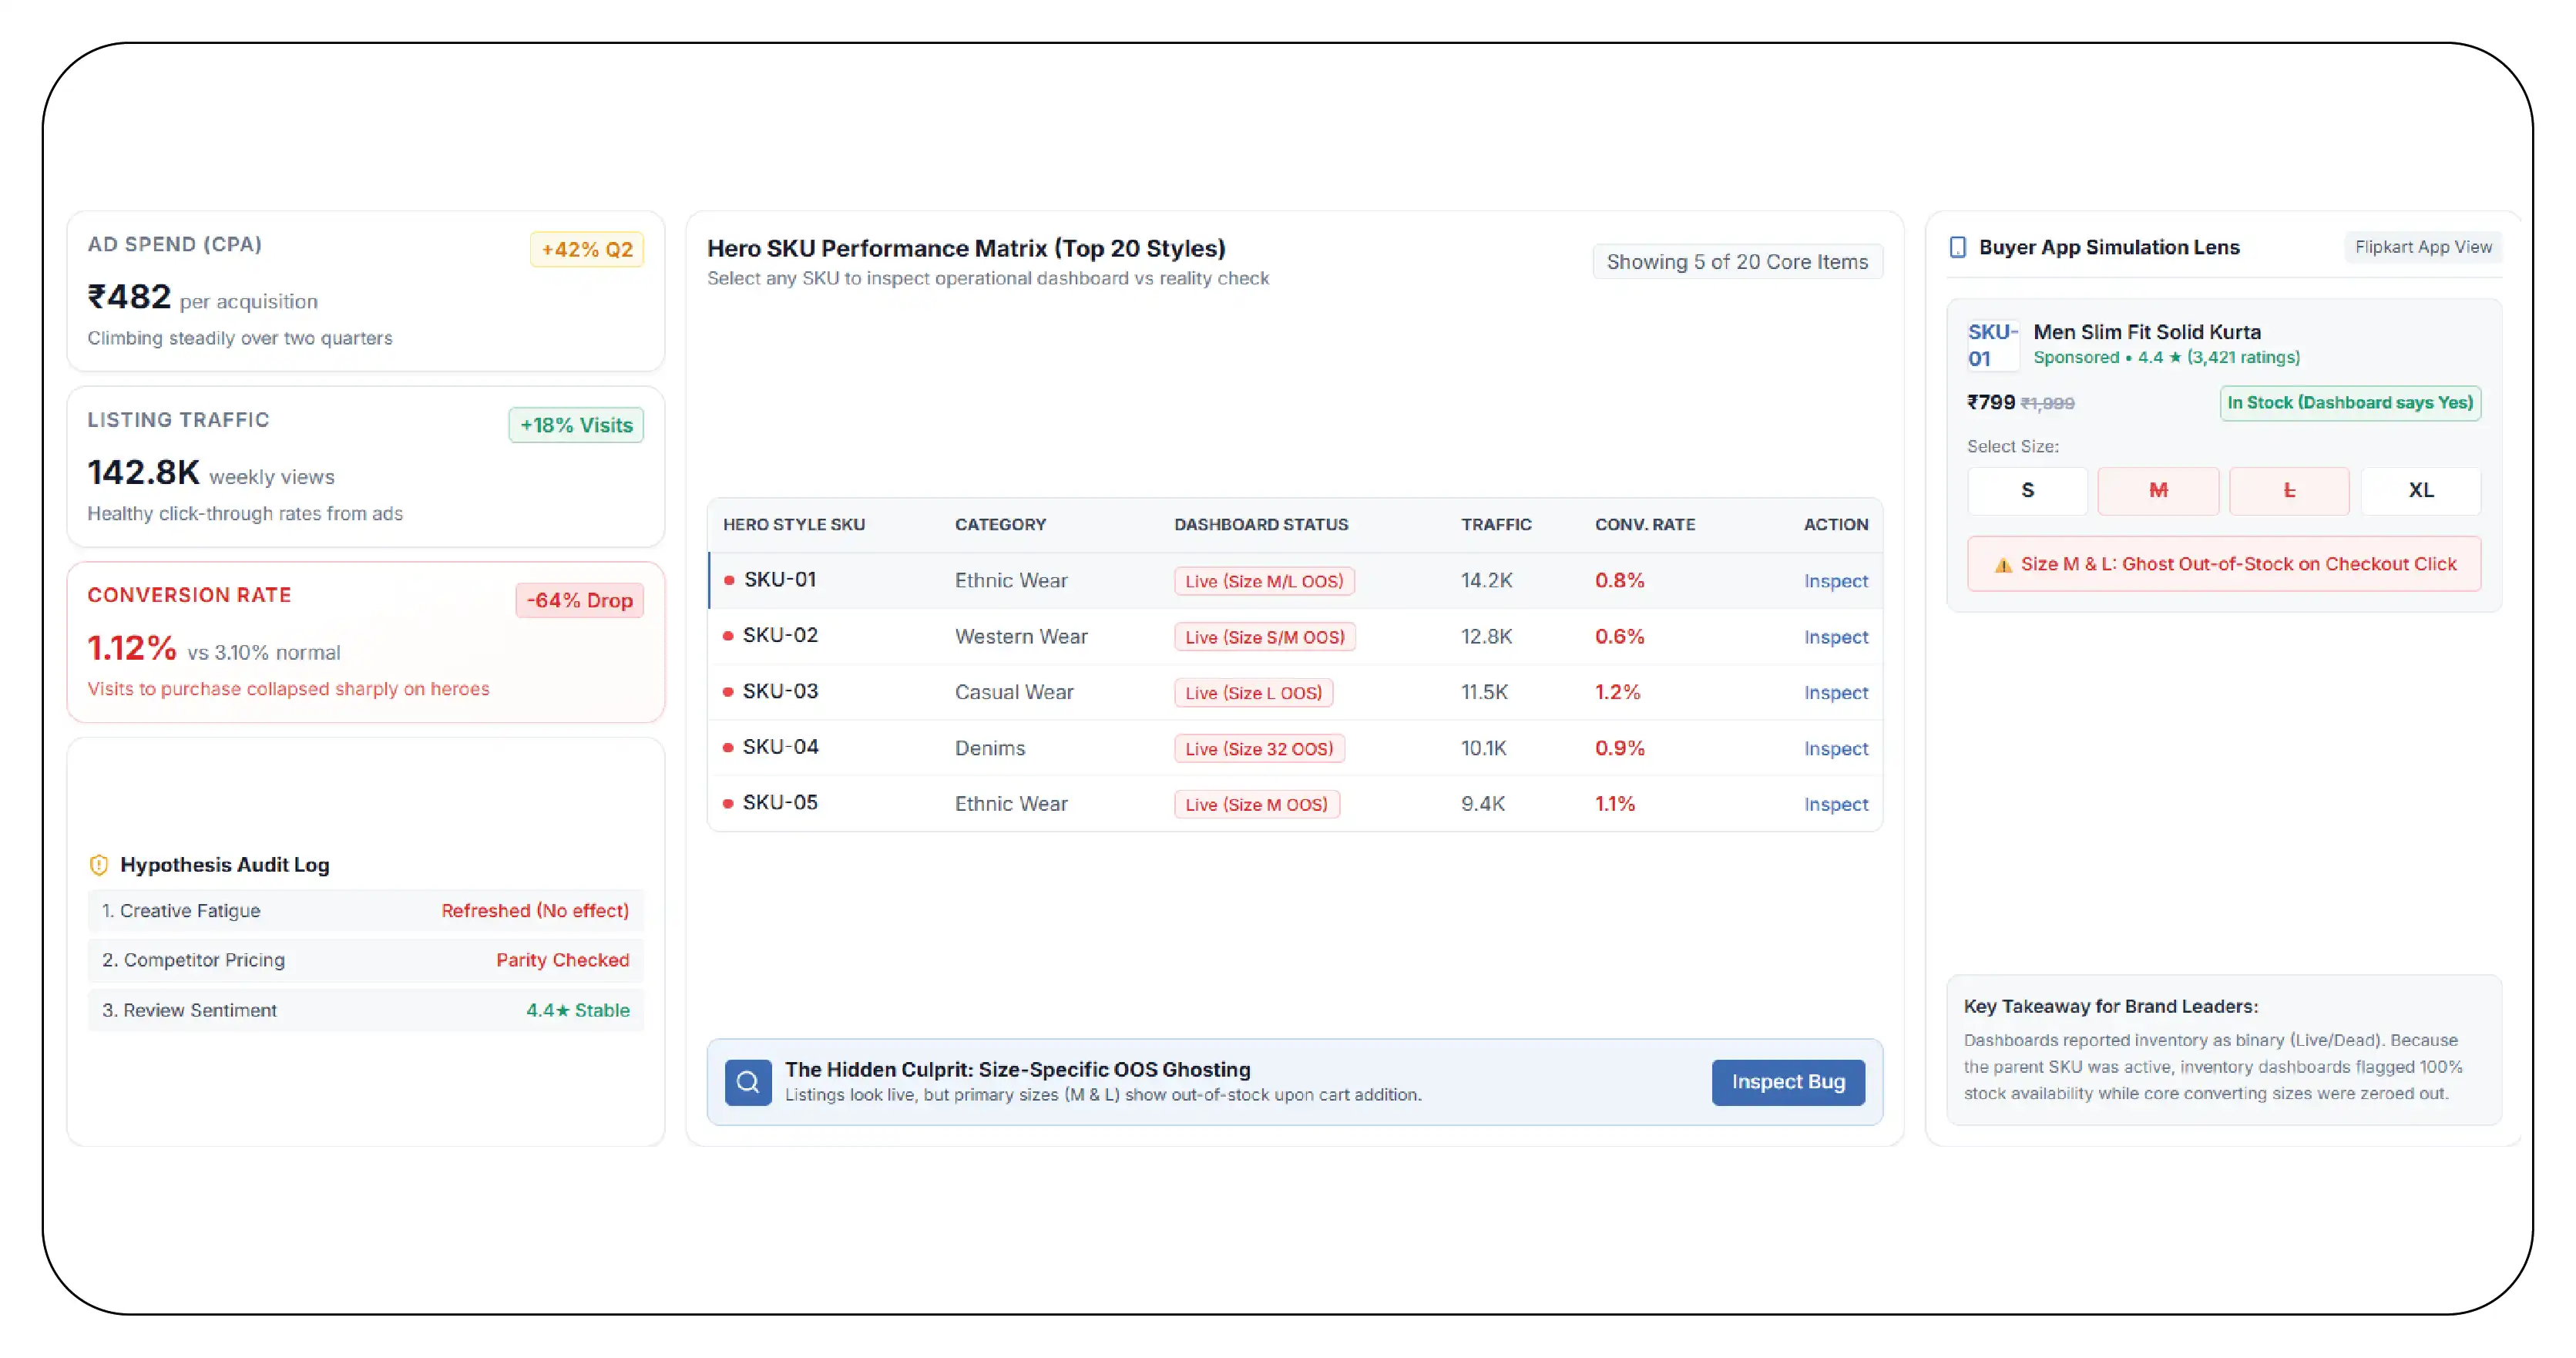
The brand's marketing team raised the alarm first, and they raised it about the wrong thing.
Cost per acquisition on Flipkart had been climbing for two quarters. Ad spend was up. Click-through rate was steady. Traffic to the brand's listings was actually growing. But conversion — visits to purchase — had fallen sharply on the hero styles, the twenty or so items that carried a disproportionate share of the brand's volume.
The initial hypothesis was creative fatigue. The images were refreshed. Conversion did not move.
The second hypothesis was pricing. A competitor was assumed to be undercutting. A price audit found nothing — the brand was at or below parity on every hero style.
The third hypothesis was reviews. Also nothing.
Throughout all of this, the brand's inventory dashboard showed every hero style in stock. Nobody questioned it, because there was nothing to question. The listings were live. The products were available. The dashboard said so.
The Diagnosis: The Dashboard Was Telling the Truth and Saying Nothing
Product Data Scrape ran a variant-level diagnostic across the brand's 20 hero styles.
The pipeline the brand had been using captured one row per product page — the standard output of a general-purpose scraper. It recorded in_stock: true if any variant of the style was purchasable.
For a t-shirt with five sizes and four colours, that is twenty independent stock realities collapsed into one boolean.
Here is what the first capture found on the brand's single highest-volume style. Illustrative figures.
| Size |
Navy |
Black |
White |
Olive |
Purchasable in any colour? |
| S |
✅ |
✅ |
✅ |
✅ |
Yes |
| M |
❌ |
❌ |
✅ |
❌ |
Only in white |
| L |
❌ |
❌ |
❌ |
❌ |
No |
| XL |
✅ |
✅ |
✅ |
✅ |
Yes |
| XXL |
✅ |
✅ |
✅ |
✅ |
Yes |
product_level_in_stock: true
Size L was unpurchasable in every colour. Size M was purchasable in exactly one colour — and it was white, historically the brand's weakest-selling colour on that style.
M and L together accounted for the majority of the style's historical unit sales.
The timestamped capture history answered the question the brand had been unable to answer for two quarters: the L stockout had been continuous for 26 days. M had been partially out for 19.
The conversion collapse was not a creative problem, a pricing problem, or a review problem. Roughly six out of ten customers arriving on the listing were arriving to buy a size that did not exist. They bounced. The brand paid for every one of those clicks.
Scaled Across the Catalogue
The full pass across all 340 styles:
- 73 styles were reporting in_stock: true while missing at least one of their top-two-selling sizes.
- 31 styles were missing both of their top-two sizes.
- Median duration of an undetected size stockout: 17 days.
- 11 styles had a size that had been out of stock for more than 45 consecutive days — long enough that the size curve in the replenishment plan had, in effect, silently been rewritten by neglect.
- On 19 styles, a size was available only from the secondary seller at a different price, meaning the brand's own price ladder had broken without anyone noticing.
The brand's supply team had been planning replenishment against a size curve derived from sales data. But sales data cannot record a sale that could not be made. Size L had been out of stock, so size L had not sold, so the sales data showed weak L demand, so the replenishment plan allocated less L — which produced more L stockouts.
The forecast had been eating itself for the better part of a year.
The Solution: Variant-Level Capture With Duration
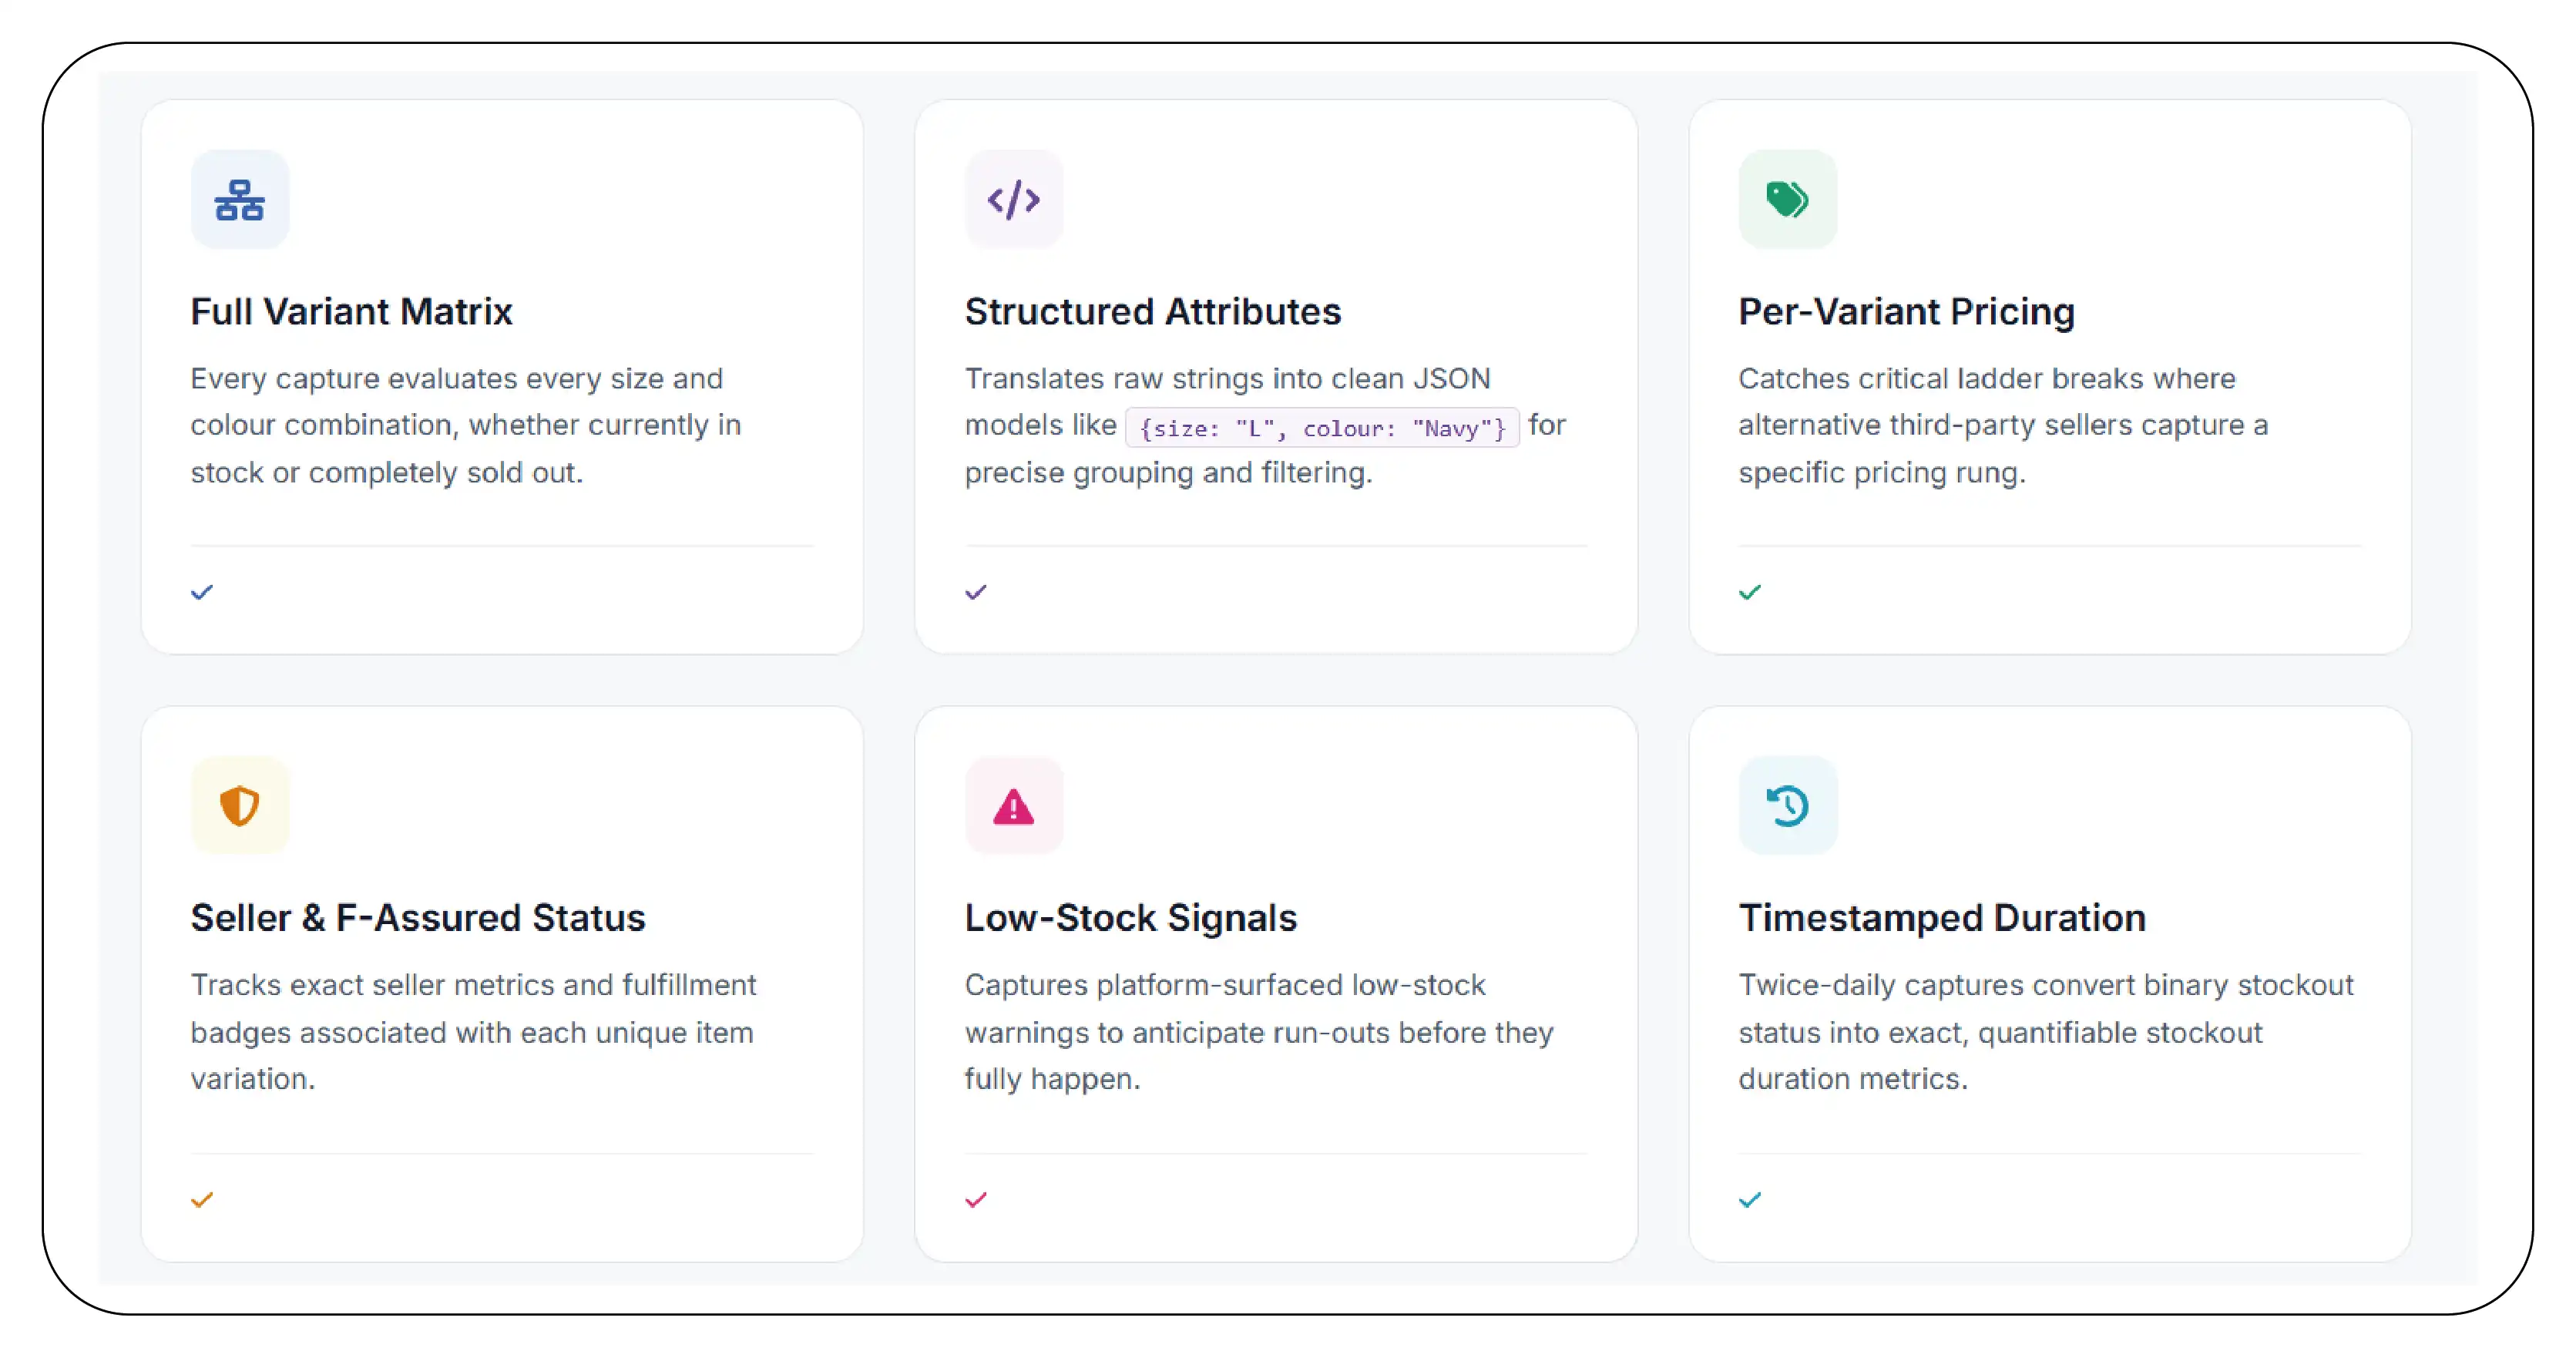
Product Data Scrape deployed variant-level monitoring across the full catalogue:
- Full variant matrix on every capture — every size, every colour, whether or not it was in stock.
- Structured variant attributes — {size: "L", colour: "Navy"} rather than the display string, so the matrix could be grouped, filtered, and matched against a competitor basket.
- Per-variant price, catching ladder breaks where a different seller held a rung.
- Per-variant seller and F-Assured status.
- Low-stock signals where the platform surfaced them.
- Timestamped capture, twice daily, converting stockout status into stockout duration.
- Competitor variant matrices on the same schema across a matched basket of 60 competing styles.
- Three alerts, with named owners:
- Any hero style loses a top-two size → supply lead, same day.
- Any size out for more than 72 hours → supply lead, escalated.
- Any variant price diverges from the ladder → marketplace lead.
Sample Data: The Alert
{
  "alert_type": "hero_size_stockout",
  "product_id": "TSHRT9K2QP7WZXY",
  "title": "BrandF Cotton Crew Neck T-Shirt",
  "fired_at": "2026-04-18T08:00:00+05:30",

  "product_level_in_stock": true,

  "affected_variants": [
    {"variant_label": "L / Navy",  "out_since": "2026-04-15T20:00:00+05:30", "hours_out": 60, "velocity_rank": 1},
    {"variant_label": "L / Black", "out_since": "2026-04-16T08:00:00+05:30", "hours_out": 48, "velocity_rank": 3},
    {"variant_label": "M / Navy",  "out_since": "2026-04-17T20:00:00+05:30", "hours_out": 12, "velocity_rank": 2}
  ],

  "size_L_purchasable_any_colour": false,
  "estimated_daily_units_at_risk": 41,
  "escalate_to": "supply_lead"
}
Two and a half days after the first size went out, an alert landed with a named owner, a unit-at-risk estimate, and the fact — stated plainly — that size L could not be bought at all.
Previously, the equivalent event had gone undetected for 26 days.
What the Brand Did
Immediate — Emergency replenishment. The 31 styles missing both top-two sizes were prioritised for expedited allocation to the authorised sellers.
Week 2 — Rebuilt the size curve. This was the structural fix, and it was the one that mattered most. The replenishment plan had been built on sales data corrupted by stockouts. The team rebuilt it using demand-adjusted velocity: for any period in which a size was unavailable, the sales figure was treated as censored rather than as zero. The revised curve allocated substantially more M and L than the original.
Week 3 — Ladder repair. The 19 styles with a broken price rung were corrected with the secondary seller.
Ongoing — Alerting. Size-level stockouts now escalate within 72 hours to a supply lead with authority to release held allocation without approval.
Quarter 2 — Competitive assortment. With the competitor variant matrices in hand, the merchandising team found 14 size-and-colour combinations that competitors listed consistently and the brand did not — including two extended sizes that had never been part of the range.
The Results (One Quarter)
| Metric |
Before |
After One Quarter |
| Hero styles missing a top-two size |
73 of 340 |
9 of 340 |
| Median undetected size-stockout duration |
17 days |
Under 2 days |
| Styles with a broken price ladder |
19 |
2 |
| Conversion rate, hero styles, indexed |
100 |
139 |
| Cost per acquisition, indexed |
100 |
74 |
| Revenue, hero styles, indexed |
100 |
147 |
Figures are representative of the engagement outcome.
Conversion up 39 percent. Cost per acquisition down 26 percent. Revenue on hero styles up 47 percent.
The brand did not change its images, its prices, its ad spend, or its creative. It made the sizes people wanted buyable.
The Lesson
The brand had spent two quarters and a meaningful amount of money diagnosing a conversion problem, and it had looked in every place except the one where the answer was.
The reason is worth naming, because it generalises: the dashboard was not wrong. in_stock: true was a true statement. It was simply a statement about a unit — the product page — that has no commercial meaning. Nobody buys a product page. They buy a size.
The most dangerous data is not the data that is wrong. It is the data that is accurate, and answers a question nobody asked.
Work With Product Data Scrape
Product Data Scrape delivers Flipkart size-level stock data across the full variant matrix — per-variant stock and price, structured variant attributes, per-variant seller and badge status, low-stock signals, timestamped capture that converts stockouts into durations, and matched competitor variant matrices.
If your listings are "in stock" and your conversion is falling, we will run a variant-level diagnostic on your hero styles. In our experience it takes one capture to find the problem.
Product Data Scrape — turning marketplace complexity into decision-ready data.


 Singapore
 EMAIL
EMAIL
 PHONE
PHONE















.webp)






