The Client
An Indian quick-commerce operator running a dark-store network across a handful of cities, preparing a significant expansion. The company had capital, an operating playbook, and a decision to make about where to point both.
Client details are anonymised. Figures are representative of the engagement.
The Problem: Expanding Toward the Fight
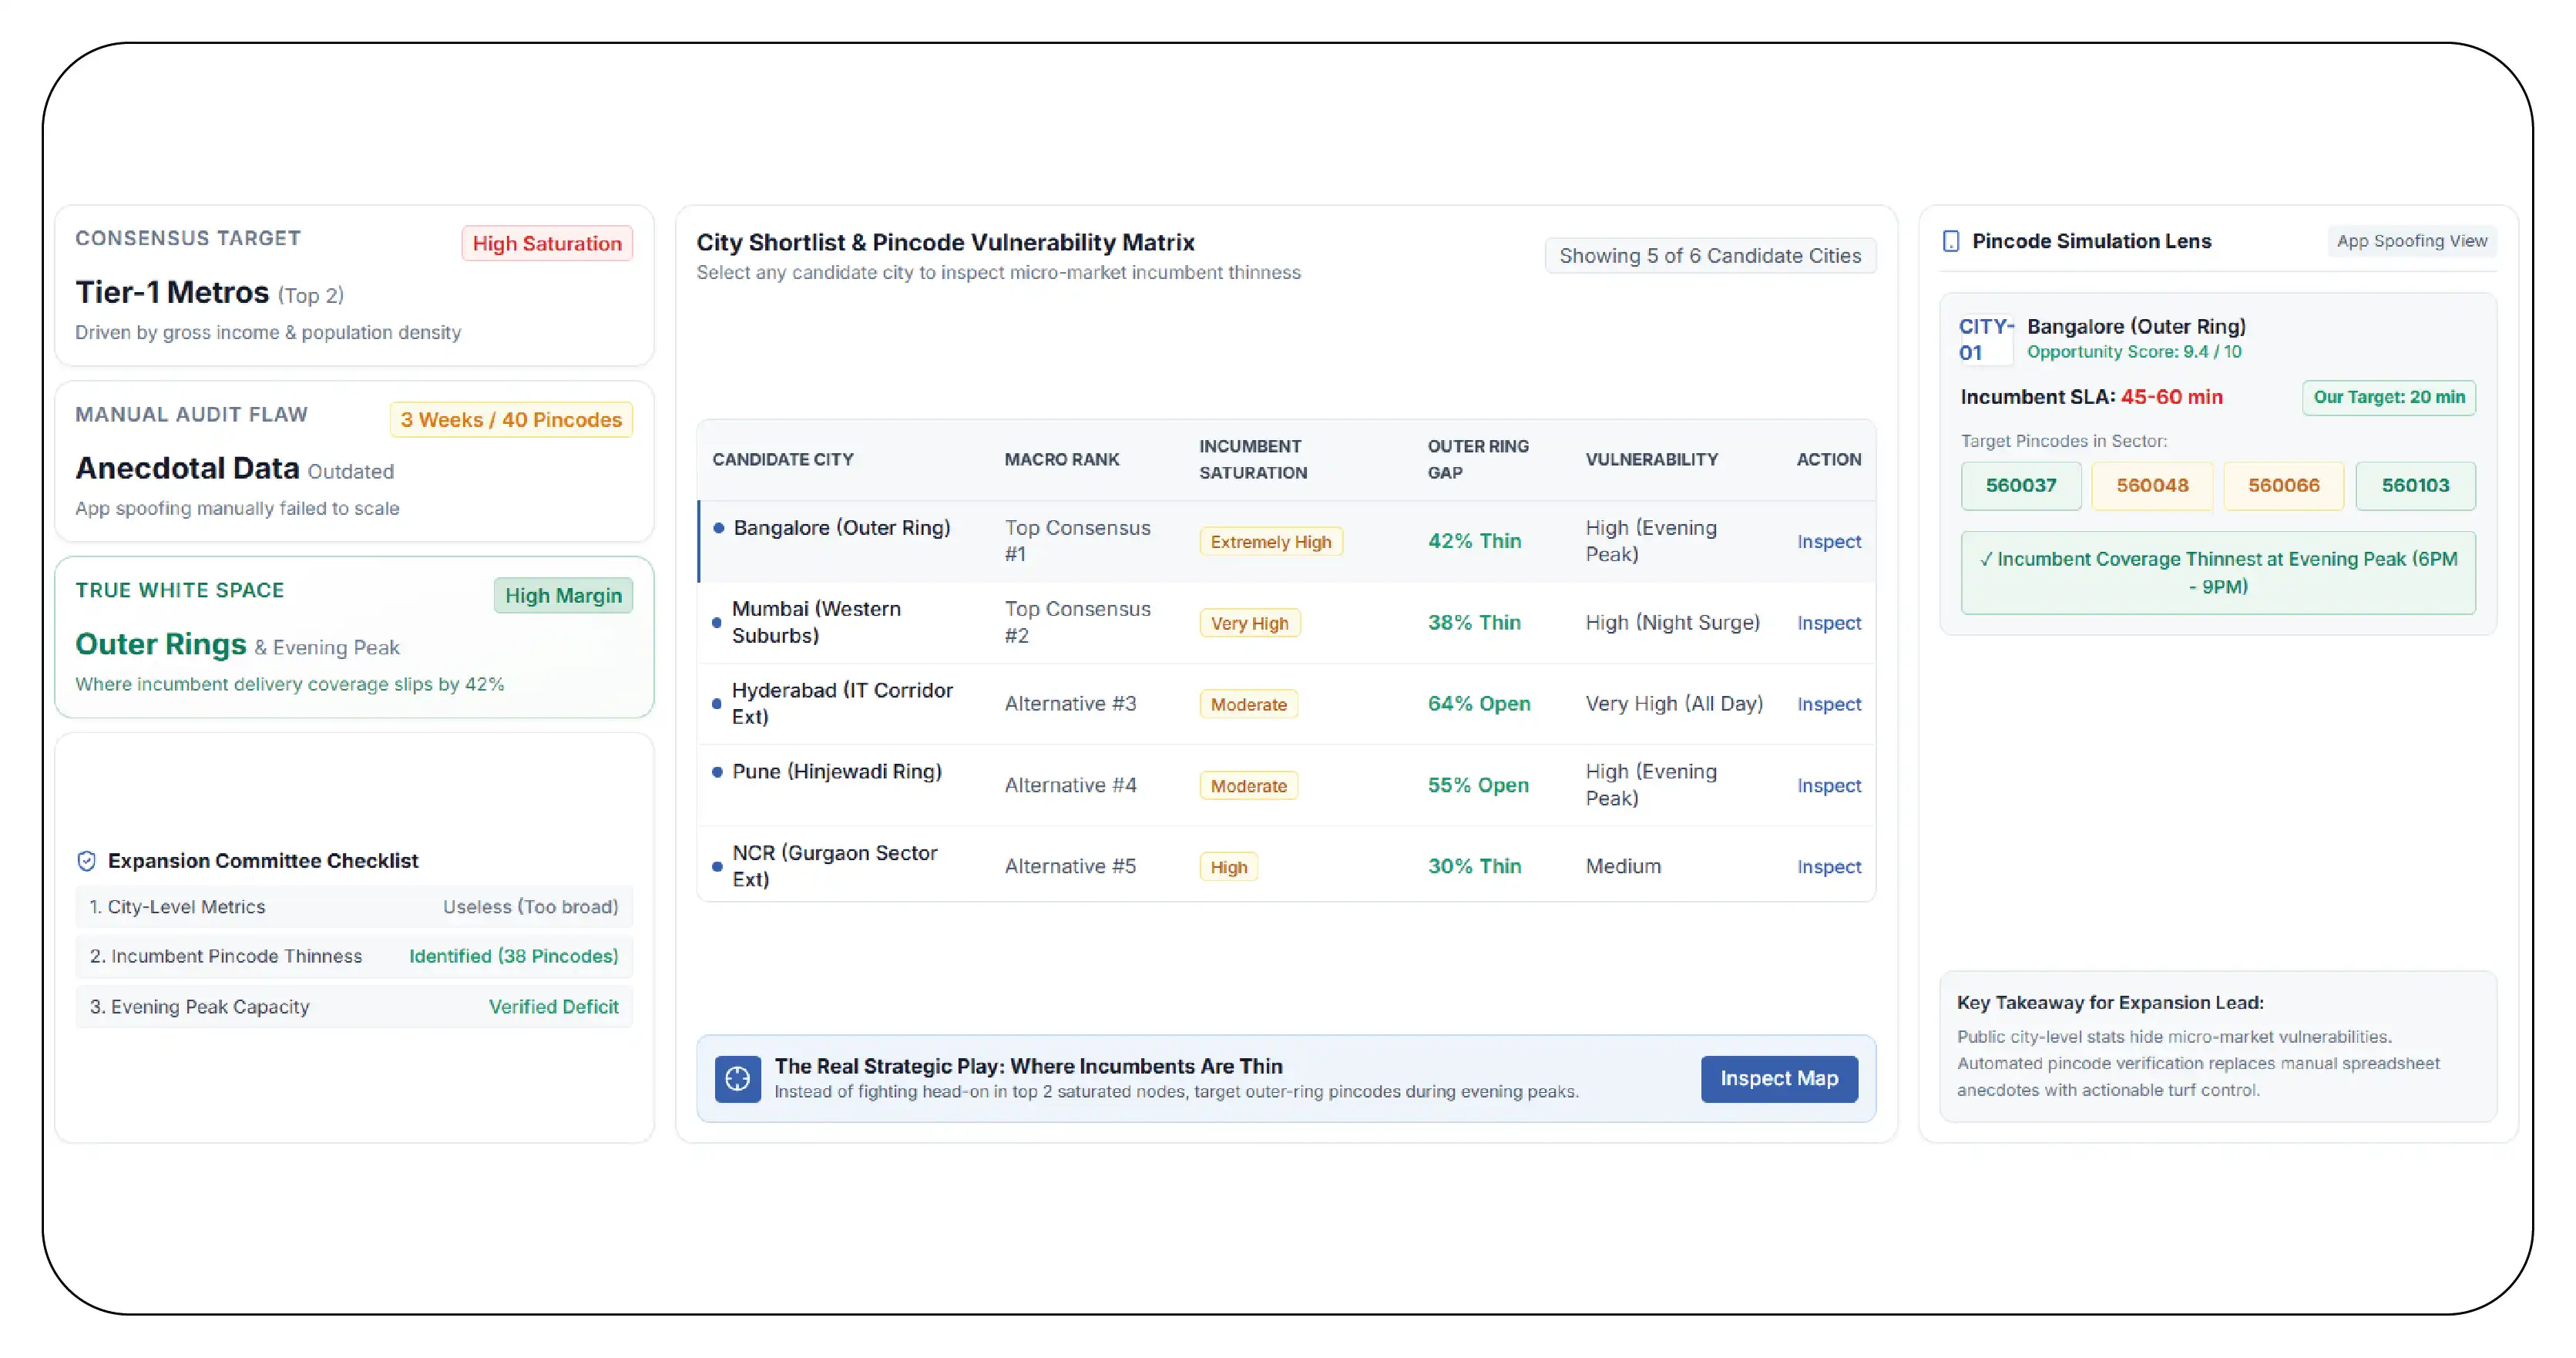
The company's expansion committee had a shortlist of six cities and a strong internal consensus about the top two. The consensus was built on the obvious inputs — population, income levels, smartphone penetration, existing e-commerce order density.
Every one of those inputs pointed at the same places. Which was the problem, because those inputs point every operator at the same places. The company was preparing to spend heavily to enter the two cities where every competitor was already densest.
What nobody on the committee could answer was the question that actually mattered: where is the incumbent coverage thin?
Not thin at the city level — that data is public and useless, because every operator claims every major city. Thin at the pincode level. Thin in the outer ring. Thin in the categories the company was strongest in. Thin at the evening peak.
The company's own analyst had tried to build this picture manually. She had installed the competing apps, entered addresses one at a time, screenshotted results, and assembled a spreadsheet. It covered 40 pincodes across two cities and took three weeks. It was out of date before it was finished, and — as she pointed out, correctly — 40 pincodes across two cities was not a coverage map. It was an anecdote.
The Solution: A Systematic Coverage and Availability Panel
Product Data Scrape deployed Flipkart Quick availability monitoring across a structured pincode panel covering all six shortlisted cities, plus the company's three existing cities as a control.
- Panel design. Pincodes were selected to represent each city's structure rather than its centre: a core ring, an inner ring, an outer ring, and a periphery band, weighted so that every ring was properly represented rather than sampled by convenience.
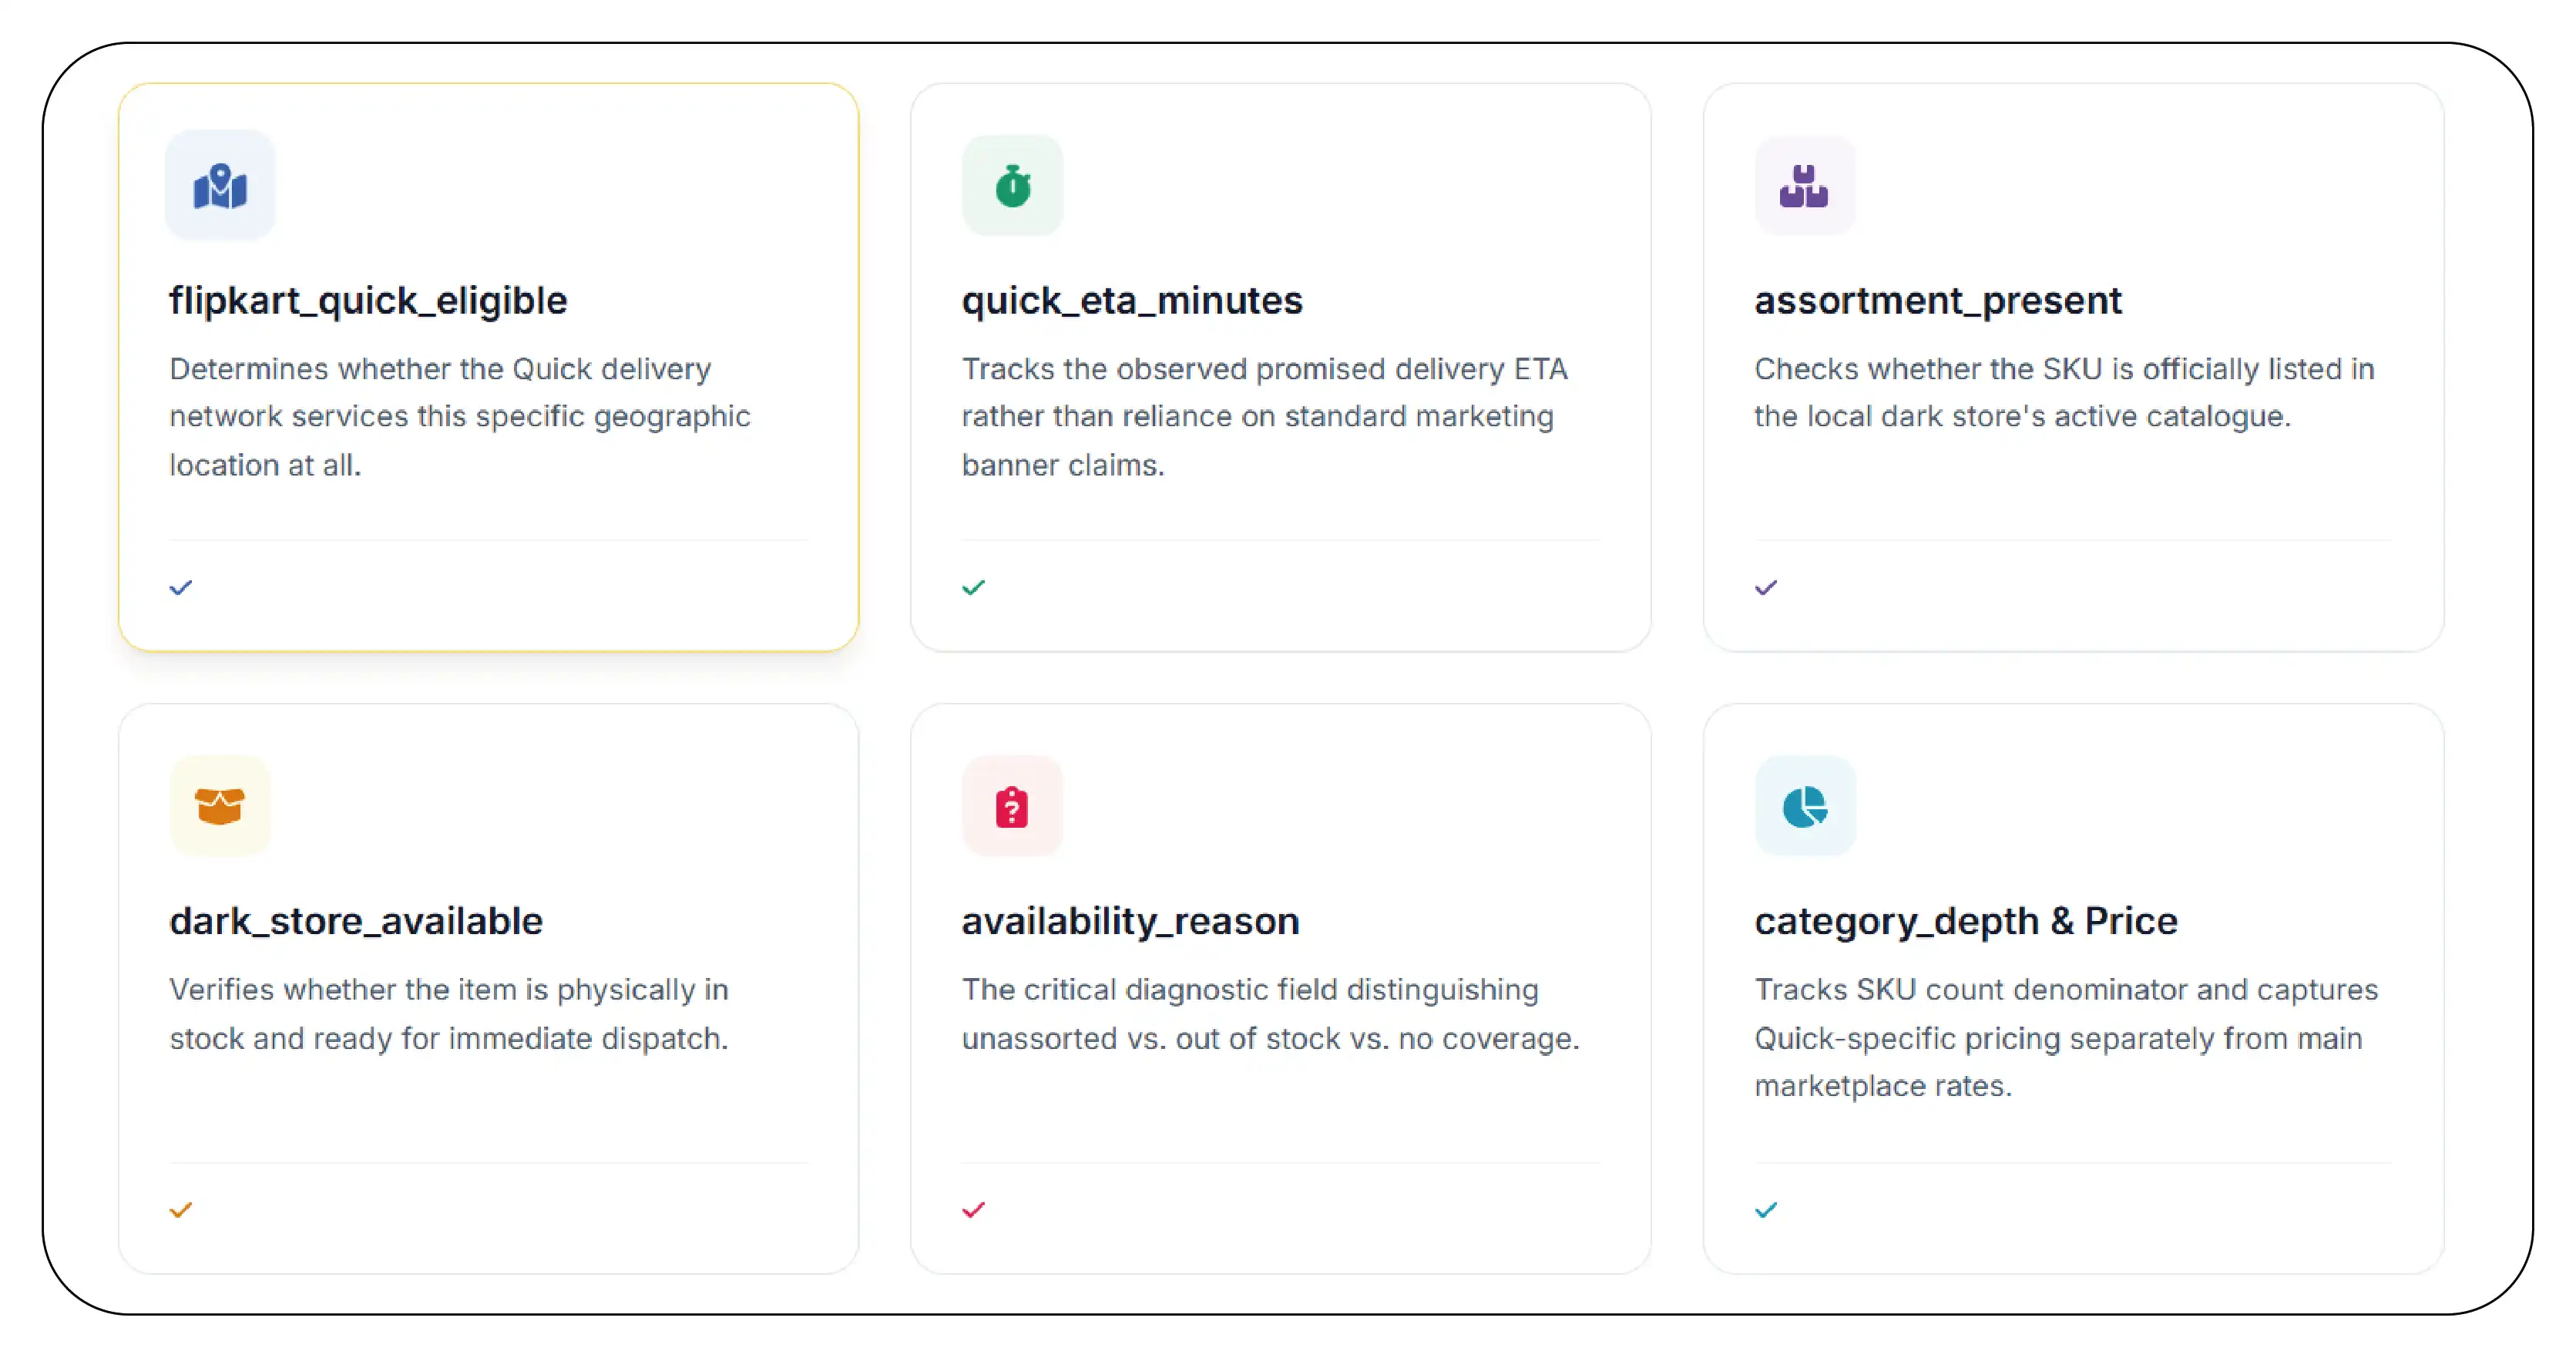
- Captured per SKU per pincode:
- flipkart_quick_eligible — whether Quick serves this location at all.
- quick_eta_minutes — the observed promised ETA, not the marketing claim.
- assortment_present — whether the SKU is in this dark store's catalogue.
- dark_store_available — whether it is actually in stock.
- availability_reason — the critical field: not assorted versus out of stock versus no coverage.
- category_depth — how many SKUs the store carries in the category, giving a real denominator.
- quick_price — Quick price, captured separately from the main marketplace price.
- Frequency: every four hours, deliberately including a capture inside the evening peak, where q-commerce stockouts cluster and where a morning-only pipeline sees nothing.
- Basket: a representative basket across the company's five strongest categories, so that coverage could be assessed on the assortment the company would actually be competing with rather than in the abstract.
Sample Data: The Table That Changed the Shortlist
An illustrative summary from the first two weeks of the panel.
| City |
Panel Pincodes |
Quick Coverage % |
Median ETA |
Category Depth (avg) |
Evening Stockout Rate |
Coverage in Outer Ring |
| Consensus City A |
96 |
88% |
13 min |
91 |
6% |
71% |
| Consensus City B |
88 |
84% |
14 min |
86 |
8% |
66% |
| Shortlist City C |
71 |
47% |
21 min |
62 |
19% |
12% |
| Shortlist City D |
64 |
79% |
16 min |
74 |
9% |
54% |
| Shortlist City E |
58 |
41% |
24 min |
48 |
23% |
9% |
| Shortlist City F |
52 |
76% |
15 min |
71 |
11% |
49% |
Illustrative figures.
The two consensus cities were saturated. High coverage, deep assortment, fast ETAs, low stockout rates, and — most tellingly — coverage extending well into the outer ring. An entrant there would be fighting a well-supplied incumbent on its home ground, in every ring, from day one.
Cities C and E looked completely different. Coverage under half the panel. Outer rings essentially unserved. Assortment depth materially thinner. And an evening stockout rate two to three times higher than the consensus cities — which is the single most revealing number in the table, because it says the incumbent's replenishment is under strain, not merely its footprint.
City E had the thinnest category depth of any city on the list. And the company's five strongest categories were, as the basket-level breakdown showed, among the ones most thinly assorted there.
The Finding That Reframed the Decision
The committee's model had asked: where is the demand?
The data answered a better question: where is demand being served badly?
Those are not the same place, and the gap between them is the entire opportunity in a market where the incumbents are already present everywhere that is easy.
The evening stockout rate deserves particular note. A 23 percent evening stockout rate in City E means that at the moment of peak demand, roughly one in four basket items a customer wants is unavailable. That is not a coverage gap that capital closes. It is an operational gap — and operational gaps are the ones an entrant with a working playbook can actually exploit, because the incumbent cannot fix them by spending.
What the Company Did
Reversed the shortlist. Cities C and E moved to the top. Consensus City B was dropped from the near-term plan entirely.
Sited dark stores against the coverage map. Rather than clustering in the city core — the default, and the place the incumbent was strongest — the first stores in City E were sited to serve the outer ring, where Quick coverage was 9 percent and the incumbent's ETAs were worst.
Built assortment against the depth gap. The company's opening assortment in City E was deliberately weighted toward the categories where measured category_depth was thinnest. This is a considerably cheaper way to differentiate than price.
Positioned on the evening peak. Marketing in the launch cities led on evening availability, because the data said that was precisely where the incumbent was weakest and the claim could be substantiated.
Kept the panel running. Post-launch, the panel became a live competitive monitor. When incumbent coverage in an outer-ring pincode appeared, the company knew within days rather than discovering it through a demand drop.
The Results
| Metric |
Consensus Plan (modelled) |
Data-Led Plan (actual) |
| Cities entered, year one |
A and B |
E and C |
| Dark stores required to reach target coverage |
Higher (contested core) |
~30% fewer |
| Median ETA vs incumbent, launch pincodes |
Parity at best |
Faster in outer ring |
| Category depth vs incumbent, target categories |
Behind |
Ahead |
| Customer acquisition cost, launch cities, indexed |
100 (modelled) |
68 (actual) |
| Time to positive contribution per store |
Modelled baseline |
Ahead of plan |
Figures are representative of the engagement outcome.
The company entered two cities that had not been on its original priority list, needed roughly thirty percent fewer dark stores to reach its coverage target, and acquired customers at around two-thirds of the modelled cost — because it launched into gaps rather than into a fight.
The Lesson
Every operator in this category has the same demand data. Population, income, order density, smartphone penetration — it is all public, it is all in everyone's model, and it all points everyone at the same two cities.
The differentiated data is not demand data. It is supply data — specifically, the competitor's supply data.
And in q-commerce, the competitor's supply is unusually observable. Coverage, ETAs, assortment depth, and stockout rates are all visible from outside, at pincode granularity, several times a day, to anyone who bothers to capture them systematically.
The company's head of strategy summarised it afterwards more crisply than we could: we had been picking cities based on who wanted us. We should have been picking them based on who was already failing them.
Work With Product Data Scrape
Product Data Scrape delivers Flipkart Quick availability data across configurable pincode panels: coverage maps, observed ETAs, dark-store assortment presence, the assortment-versus-stockout distinction, category depth for share-of-shelf and depth analysis, evening-peak capture, and cross-platform q-commerce benchmarking on a single schema.
If your expansion committee is arguing about cities, the argument is probably about the wrong variable. Ask us for a coverage-and-depth panel across your shortlist.
Product Data Scrape — turning marketplace complexity into decision-ready data.


 Singapore
 EMAIL
EMAIL
 PHONE
PHONE
















.webp)






