Introduction
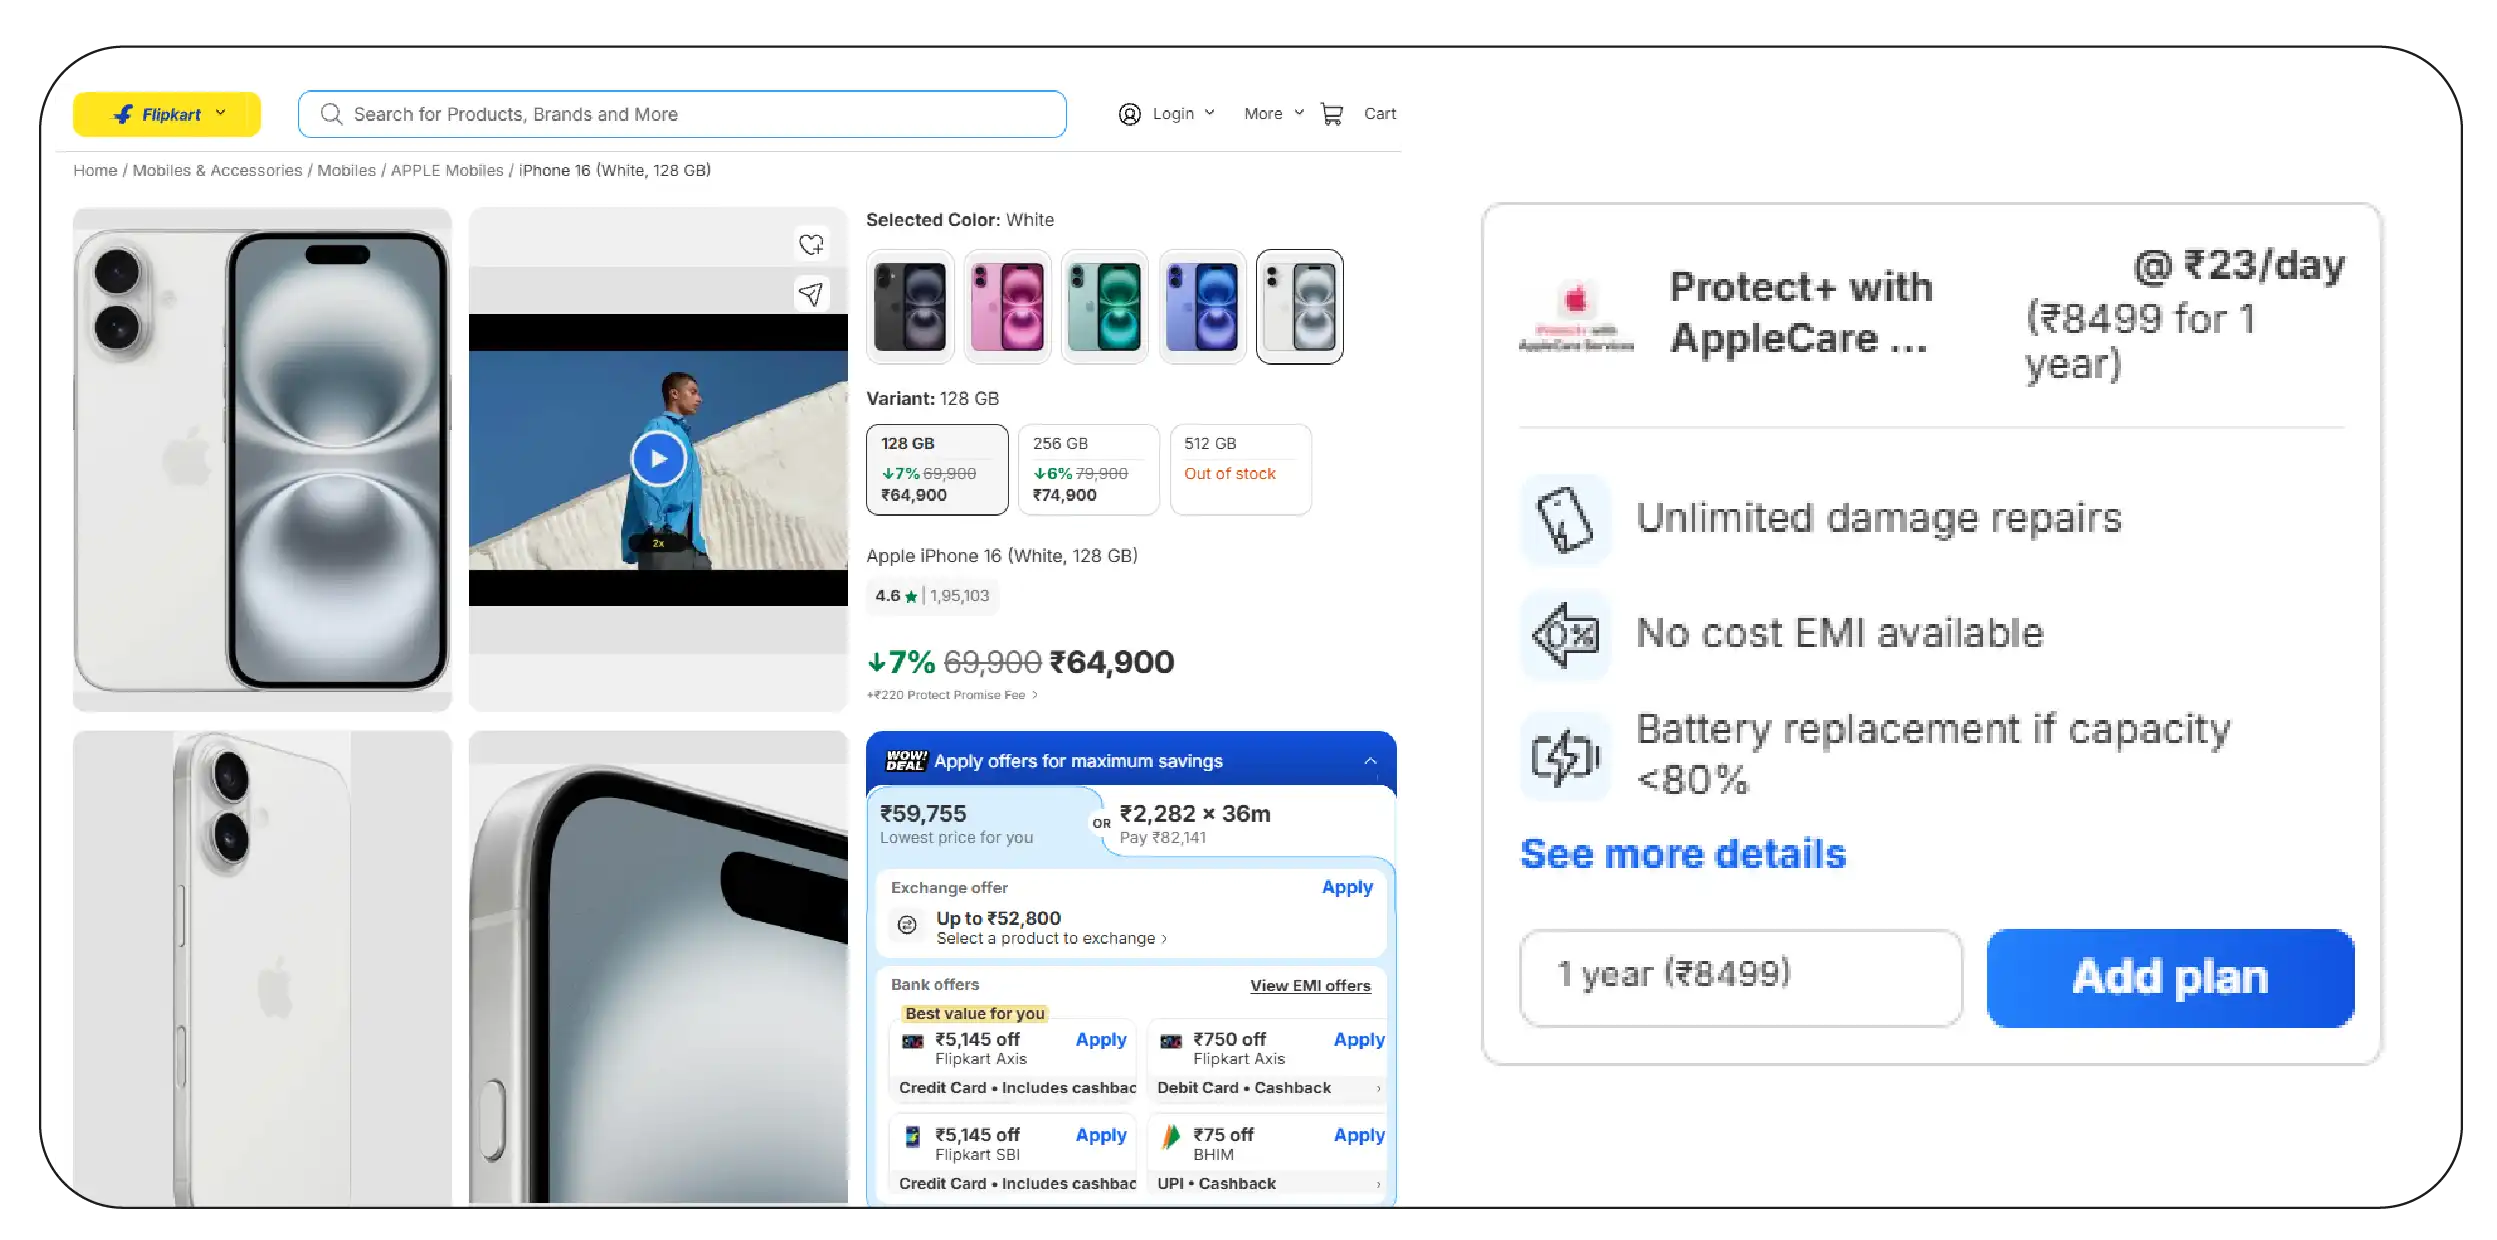
The price on a Flipkart listing is not the price anyone pays.
It is the top of a stack. Underneath it sits a Flipkart Plus member price, a bank instant discount, a cashback offer, a no-cost EMI arrangement, an exchange valuation, and a SuperCoin earn rate. By the time a customer reaches the payment screen, the number they actually part with can be five, ten, or fifteen percent below the number they saw on the product page.
Every serious pricing team on Flipkart eventually discovers the same uncomfortable thing: they have been benchmarking on the layer that matters least. The listed price is the layer competitors move last, because moving it is visible, public, and hard to reverse. The offer stack is where the real competition happens, because it is granular, reversible, and largely invisible to anyone not capturing it.
This guide covers Flipkart bank offers data: the anatomy of the stack, which layers are real discounts and which are accounting, how to compute an effective consumer price that a finance team will accept, and what the data actually looks like.
The Anatomy of the Flipkart Offer Stack
A single SKU carries up to seven pricing layers at any moment.
1. MRP. The maximum retail price. A reference number, not a transaction price. Discount percentages quoted against MRP are the least informative figure on the page.
2. Listed price. What a non-member sees. This is the number most monitoring programmes capture, and the only number many of them capture.
3. Flipkart Plus exclusive price. A separate price tier for Plus members, frequently lower, and frequently moving independently of the listed price.
4. Bank instant discount. A card-specific or bank-specific reduction applied at checkout, usually with a minimum transaction threshold and a per-card cap. Immediate and unconditional once the threshold is met.
5. Cashback. Value returned after purchase, sometimes as statement credit, sometimes as platform credit. Real, but deferred — and, critically, not always redeemed.
6. No-cost EMI. The customer pays in instalments and is told there is no interest. The interest has not vanished. It has been paid by someone.
7. Exchange offer. A valuation applied against an old device or product. Conditional — only some customers have something to exchange.
8. SuperCoins. Loyalty currency earned on purchase, redeemable against future transactions at a partial rate.
Eight layers, each with its own conditions, thresholds, caps, and redemption behaviour. A pipeline that returns a single price field is discarding seven of them.
Why Each Layer Is Hard to Capture
Bank offers are conditional and structured. An offer is not a number. It is a rule: ten percent instant discount on Bank A credit cards, minimum transaction 5,000, maximum discount 1,500. Capturing "10% off" is capturing a fragment. The cap frequently binds — a 10 percent discount with a 1,500 cap on a 30,000-rupee purchase is a 5 percent discount, not a 10 percent one — and any effective-price calculation that ignores the cap will systematically overstate the discount on expensive SKUs, which are exactly the SKUs where accuracy matters most.
Offers stack, but not always. Some offers combine. Some are mutually exclusive. Some cannot be applied alongside an exchange. Determining the best available combination for a given customer profile is a small optimisation problem, not a lookup.
Exchange values are conditional. The advertised maximum exchange value is a ceiling reached by almost nobody. Treating exchange_offer_max as a discount available to all customers inflates the effective price calculation badly.
No-cost EMI hides its cost. More on this below, because it is the most consequential misunderstanding in the entire stack.
SuperCoins are partially valued. They are earned at one rate and redeemed at another, and redemption is not universal.
Which Discounts Are Real? A Weighting Framework
Here is where most effective-price calculations go wrong. They add up the layers and subtract the total. That produces a number that is confidently, systematically too low.
Each layer has a different realisation rate — the fraction of its nominal value that actually reaches the customer, and the fraction that actually costs the seller.
| Layer |
Nature |
Realisation |
Who bears the cost |
| Bank instant discount |
Immediate, unconditional above threshold |
High — but capped, and only for that bank's cardholders |
Usually shared: bank and merchant, per the arrangement |
| Cashback |
Deferred |
Lower — deferral discounts its value; some is never redeemed |
Usually shared |
| No-cost EMI |
Immediate benefit, deferred cost |
High for the customer |
Typically the seller or brand, via merchant-funded interest subvention |
| Exchange offer |
Conditional |
Low across the buyer base — most customers have nothing to exchange, and few reach the advertised maximum |
Merchant |
| SuperCoins |
Deferred, partial |
Low to moderate — redemption is incomplete and the redemption rate is below the earn rate |
Platform, largely |
| Plus exclusive price |
Immediate |
High for members, zero for non-members |
Merchant |
Two lines in that table deserve to be pulled out.
No-cost EMI is not free, and the brand is usually the one paying
"No-cost EMI" describes the customer's experience, not the economics. The interest on the instalment plan is paid. In the standard Indian merchant-funded structure, it is paid by the seller or brand, as a discount equivalent to the interest that the financing partner would otherwise have charged.
Which means: no-cost EMI is a real margin cost, booked as a customer benefit, and almost never captured in competitive price benchmarking.
A competitor offering no-cost EMI on a 30,000-rupee SKU at a nine-month tenure is absorbing a meaningful cost per unit — a cost that does not appear anywhere in their listed price. If your benchmarking ignores it, you will conclude the competitor is pricing at parity when they are in fact pricing several percent below you, and funding the gap through the financing line rather than the price line.
For a pricing team, this is a competitive intelligence finding. For a finance team, it is a margin reconciliation finding. It is usually the single item that gets the most attention when the effective-price data is first presented internally.
The exchange offer is the most over-counted layer in the stack
A listing advertises up to 15,000 rupees off with exchange. It is tempting — and common — to subtract 15,000 from the effective price.
Almost nobody gets 15,000. The advertised figure is a ceiling for a device in near-perfect condition of a high-value model. The median realised exchange value is a fraction of it, and a large share of buyers have nothing to exchange at all.
Treating the exchange ceiling as a universal discount produces effective prices that are dramatically wrong, and it produces them in a direction that flatters the competitor and panics your own pricing team.
Computing an Effective Price a Finance Team Will Accept
The correct output is not one number. It is two.
Best-case effective price — the lowest price any customer could pay, applying the optimal legal combination of offers. This is the number that matters for perception: it is what a well-informed, well-carded customer sees, and it is what review sites and deal aggregators publish.
Realised effective price — the nominal price adjusted for realisation. This is the number that matters for margin and for honest competitive comparison.
An illustrative structure:
best_case_effective_price =
    min(listed_price, plus_price)
  − best_applicable_bank_discount   (respecting cap and threshold)
  − cashback_value
  − exchange_offer_max
  − supercoins_earnable × supercoin_redemption_value

realised_effective_price =
    min(listed_price, plus_price)
  − best_applicable_bank_discount   × bank_card_penetration
  − cashback_value                  × cashback_redemption_rate
  − median_realised_exchange_value  × exchange_participation_rate
  − supercoins_earnable             × supercoin_redemption_value × redemption_rate
  + no_cost_emi_subvention_cost     (a cost to the seller, not a benefit to the customer)
The weights are yours to set, and setting them is a real exercise — it requires your own transaction data, not scraped data. What scraped data provides is every input on the right-hand side, captured accurately and consistently across your SKUs and your competitors' SKUs, so that whatever weights you choose are applied to the same basis on both sides.
That is the actual value proposition, and it is worth stating plainly: Product Data Scrape does not tell you what your competitor's margin is. It tells you exactly what your competitor is offering, in structured form, so that your own finance team can compute what it costs them.
Sample Data: The Offer Stack, Structured
An illustrative record for a single electronics SKU.
{
  "product_id": "TVXQ7K2LM9WZ",
  "title": "BrandZ 55-inch 4K Smart TV",
  "captured_at": "2026-07-14T11:02:44+05:30",
  "pincode": "560001",

  "mrp": 74999,
  "listed_price": 42999,
  "plus_exclusive_price": 41999,

  "bank_offers": [
    {
      "bank": "Bank A", "card_type": "credit", "type": "instant_discount",
      "pct": 10, "max_discount": 2000, "min_txn": 10000,
      "computed_discount": 2000, "cap_binding": true
    },
    {
      "bank": "Bank B", "card_type": "debit", "type": "cashback",
      "flat_value": 1000, "min_txn": 20000,
      "computed_discount": 1000, "cap_binding": false
    },
    {
      "bank": "Bank C", "card_type": "credit", "type": "instant_discount",
      "pct": 5, "max_discount": 3000, "min_txn": 15000,
      "computed_discount": 2100, "cap_binding": false
    }
  ],
  "best_bank_discount": 2100,
  "offers_are_stackable": false,

  "no_cost_emi_available": true,
  "emi_tenures_months": [3, 6, 9, 12],
  "emi_min_monthly": 3583,

  "exchange_offer_max": 12000,
  "exchange_required": false,

  "supercoins_earnable": 420,

  "best_case_effective_price": 27799,
  "listed_to_best_case_gap_pct": 35.3
}
And the waterfall a pricing analyst would actually present:
| Layer |
Value |
Running Price |
| MRP |
— |
74,999 |
| Listed price |
−32,000 |
42,999 |
| Plus exclusive price |
−1,000 |
41,999 |
| Best bank offer (Bank C, cap not binding) |
−2,100 |
39,899 |
| SuperCoins (420 @ redemption value) |
−420 |
39,479 |
| Exchange offer (advertised maximum) |
−12,000 |
27,479 |
| Best-case effective price |
|
27,479 |
| Exchange, at median realised value + participation |
−2,150 |
37,329 |
| Realised effective price |
|
37,329 |
Illustrative figures.
The two effective prices differ by nearly 10,000 rupees. Both are defensible. Neither is "the price." A pricing team that does not know which one it is quoting is going to make an expensive mistake — and, in our experience, the mistake is almost always in the same direction: they use the best-case number, conclude the competitor is far cheaper than they are, and cut a price they did not need to cut.
Three Mistakes We See Repeatedly
Ignoring the cap. A 10 percent bank discount with a 1,500 cap is a 10 percent discount on a 15,000-rupee SKU and a 3 percent discount on a 50,000-rupee SKU. Capturing the percentage without the cap makes the error grow with the price of the item.
Assuming offers stack. They frequently do not. Summing every offer on a listing produces an effective price no customer can actually achieve.
Capturing offers as text. Many pipelines store the offer as a display string. A string cannot be computed against. The offer has to be captured as structured fields — bank, card type, offer type, percentage, cap, threshold — or the entire downstream calculation is manual.
Who Uses This Data, and For What
Pricing teams benchmark on effective price rather than listed price, and stop responding to price movements that are not actually price movements.
Finance and margin teams quantify the real cost of promotional participation, particularly the no-cost EMI subvention that rarely appears in a competitive review.
Trade marketing teams decide which bank partnerships to fund, and at what depth, by seeing what competitors are funding and where.
Competitive intelligence teams watch a specific and highly informative signal: a competitor who freezes their listed price while deepening their offer stack is under margin pressure and is trying not to show it. That is a signal you cannot see any other way.
Scale and Compliance
Offer data multiplies the record. A single SKU can carry a dozen bank offers, each with its own structure, and offers change frequently — daily in normal periods and several times a day during sale events.
Product Data Scrape captures the full structured offer array on every record, computes cap-aware best-offer selection, and delivers as JSON, CSV, via REST API, or directly into your warehouse. We collect publicly available product and offer information only — no personal data, no authenticated content, and no circumvention of platform controls.
Frequently Asked Questions
Do you capture the offer terms or just the discount?
The full structure — bank, card type, offer type, percentage, cap, minimum transaction — so the discount can be computed rather than read.
Can you tell whether offers stack?
Stackability is captured where the platform surfaces it, and cap-aware best-offer selection is computed on every record.
Can you compute effective price for us?
We compute best-case effective price. Realised effective price requires your own redemption and participation weights, which we take as inputs.
How often do offers change?
Daily in ordinary periods, and multiple times a day during sale events. Capture frequency is configurable.
Benchmark the Price That Is Actually Paid
Your competitor is probably not undercutting you on listed price. They are probably undercutting you three layers down, in a place your dashboard does not look.
Product Data Scrape captures Flipkart bank offers data as structured, computable fields — alongside no-cost EMI terms, exchange valuations, SuperCoin earn rates, Plus pricing, and the full seller array — so your pricing and finance teams can benchmark the price that is actually paid.
Ask us for a sample offer-stack dataset on your own SKUs, and see how far the effective price sits below the number on your dashboard.
Product Data Scrape — turning marketplace complexity into decision-ready data.


 USA
USA
 EMAIL
EMAIL
 PHONE
PHONE

















.webp)






