Introduction
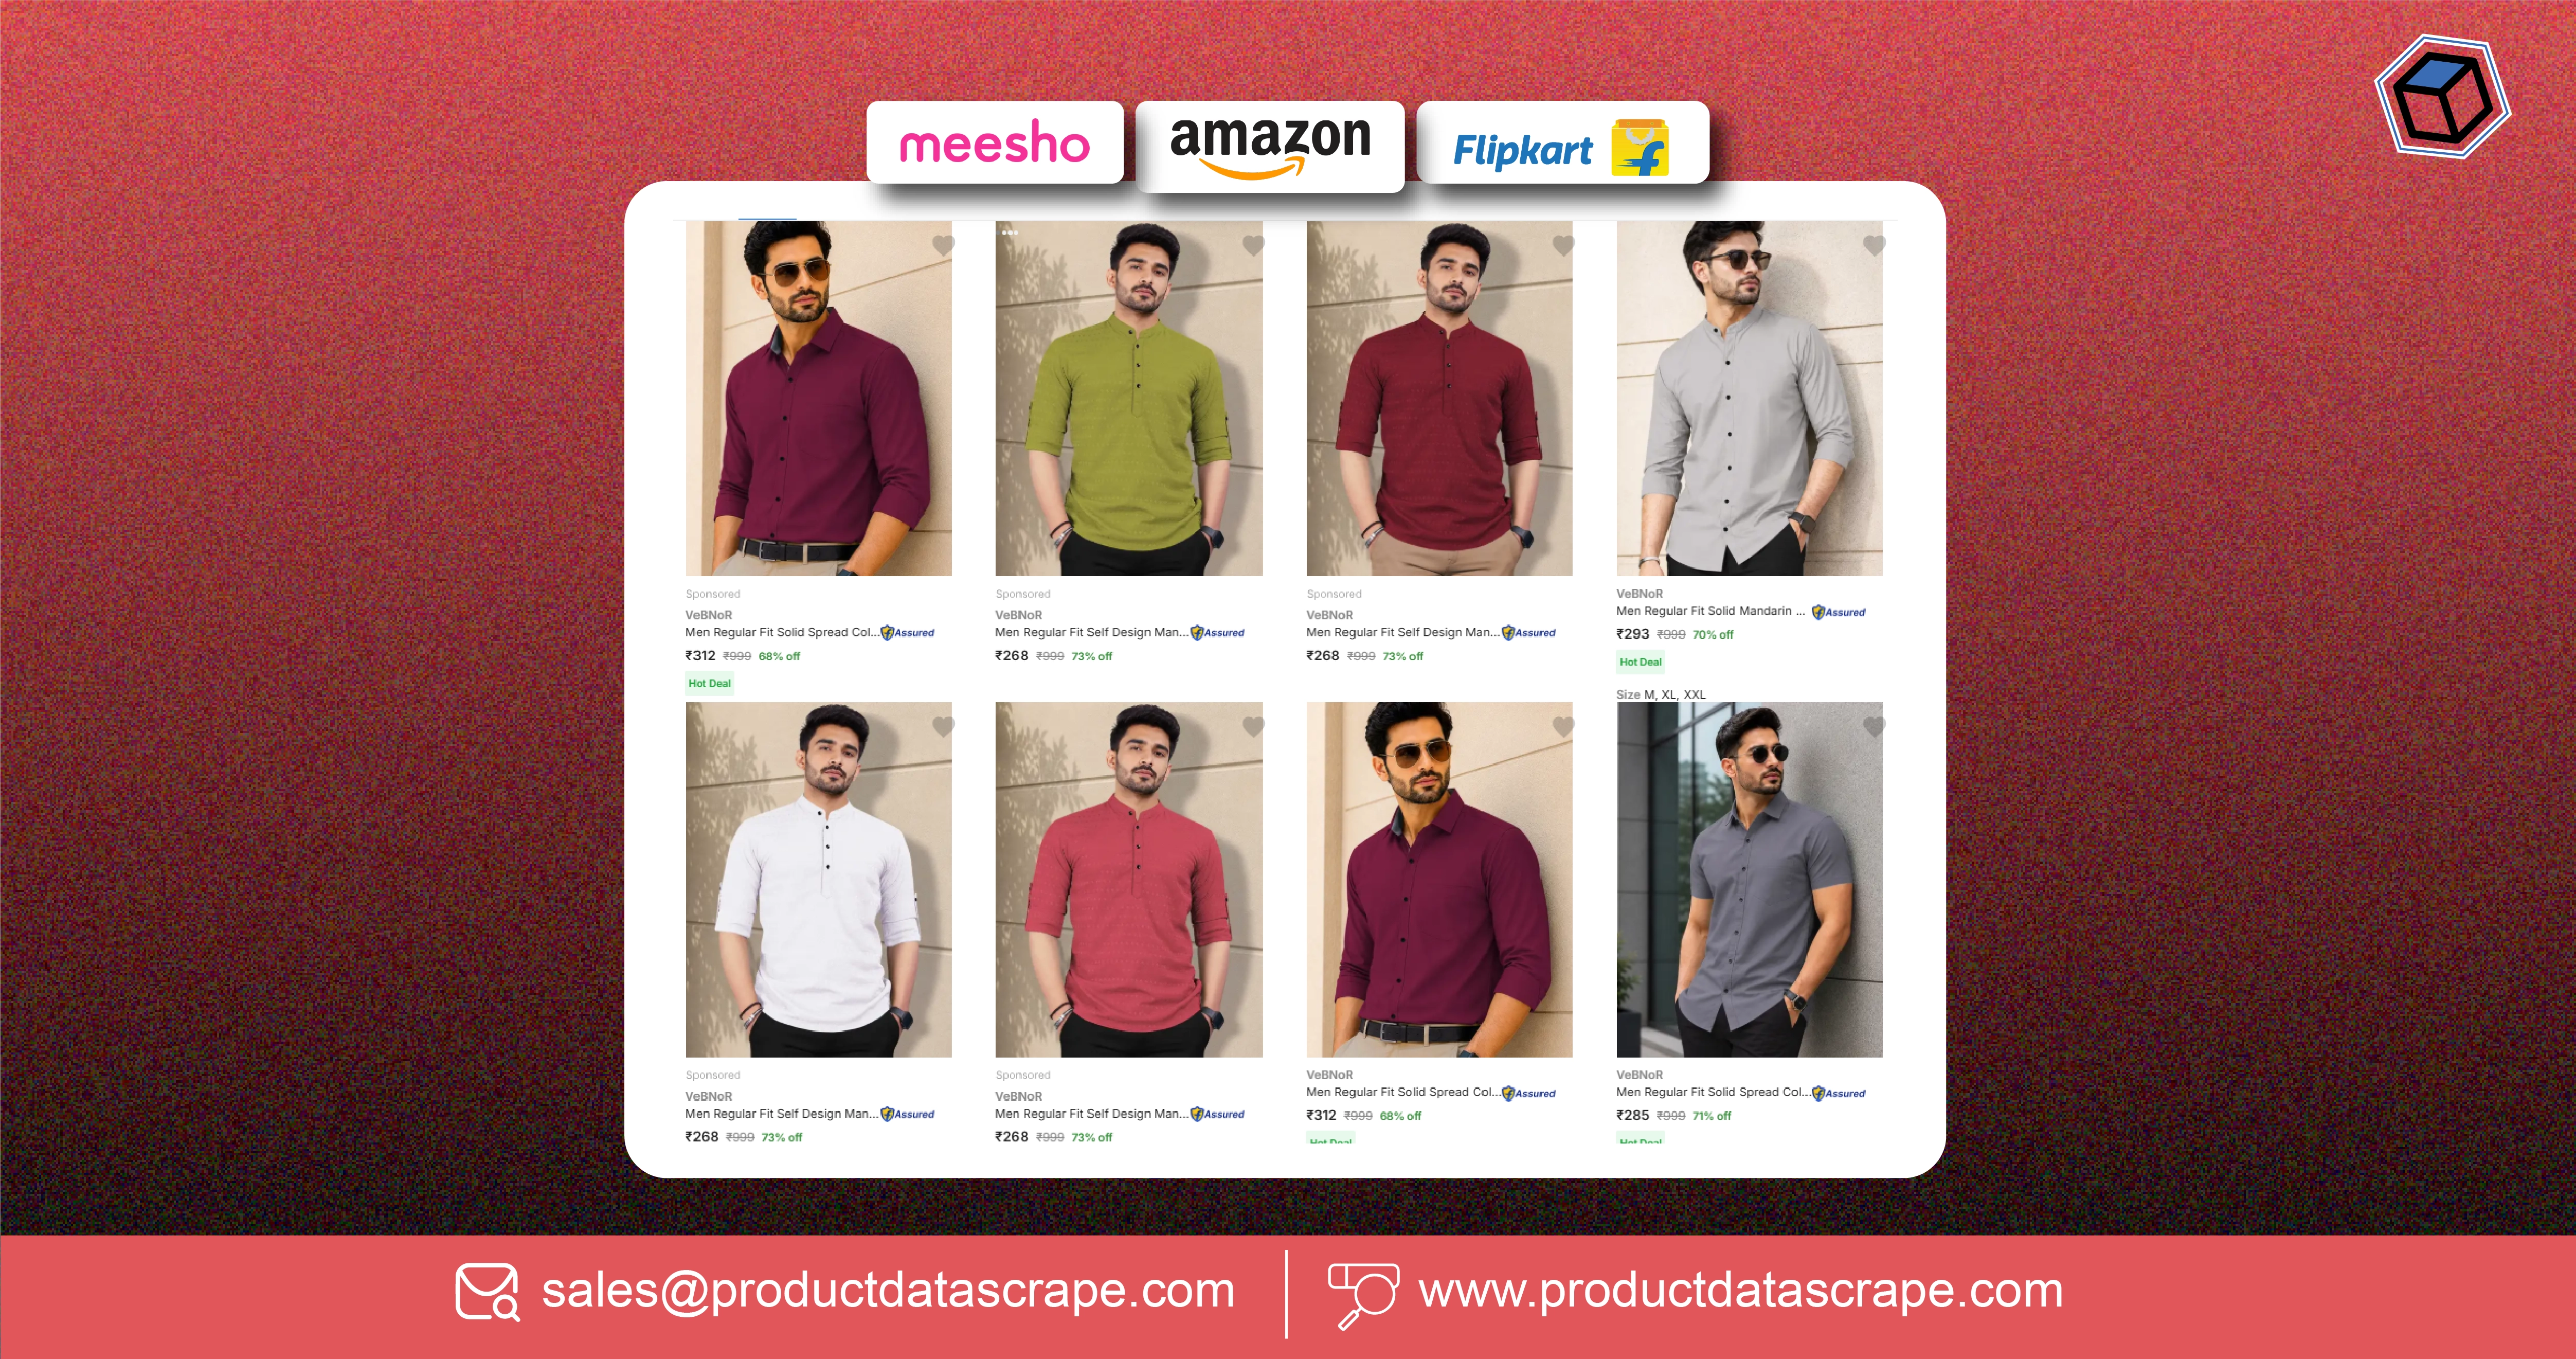
Flipkart Amazon.in and Meesho Data Scraping helps brands, retailers, sellers, and market research teams compare products, prices, sellers, ratings, reviews, availability, and marketplace trends from multiple Indian e-commerce platforms. This gives businesses structured data for pricing decisions, product research, competitor monitoring, and marketplace intelligence.
India's e-retail market reached an estimated $57–60 billion in 2023 and was projected by Bain & Company to grow at 23%–25% annually through 2028. This growth creates a larger need for reliable and recurring marketplace data.
E-commerce data scraping for the India market can help businesses move from manual product checks to automated data collection. Instead of reviewing individual marketplace pages, teams can create structured datasets and compare thousands of products at scale.
This blog addresses a key buyer problem: How can brands and e-commerce teams monitor fast-changing marketplace conditions without spending hours on manual research?
The answer is a structured data pipeline that can monitor:
- Product prices and discounts.
- Product availability.
- Seller information.
- Ratings and reviews.
- Product specifications.
- Category trends.
- Search results.
- Brand presence.
- Seller rankings.
- Promotional activity.
- Price differences across marketplaces.
The objective is not simply to collect more information. It is to turn marketplace information into decisions.
How Can Businesses Track Product Availability Across Indian Marketplaces?
India's E-commerce product availability tracking, Marketplace selling intelligence can help brands understand where products are listed, which sellers offer them, and how availability changes over time.
Product availability can change quickly. A product may be available in the morning and unavailable later. A seller may disappear from a listing. A new seller may offer the same product at a lower price. A brand may also see different availability across marketplaces.
Manual monitoring becomes difficult when businesses manage hundreds or thousands of SKUs.
A structured dataset can capture product title, SKU, brand, category, seller, price, discount, availability status, rating, review count, and collection time. Historical snapshots then show when each field changed.
What can businesses monitor?
| Data point |
Business value |
| Product title |
Product identification |
| SKU or product ID |
Record matching |
| Seller |
Competitive seller research |
| Price |
Pricing intelligence |
| Discount |
Promotion monitoring |
| Availability |
Inventory visibility |
| Rating |
Customer perception |
| Reviews |
Product feedback |
| Category |
Assortment research |
| Timestamp |
Historical comparison |
India's online shopping market continues to expand beyond major metropolitan areas. Flipkart reported in 2025 that nearly 60% of its customers came from Tier 2 and Tier 3+ towns. This makes geographic and marketplace coverage increasingly important.
A retailer can use availability data to identify products that frequently go out of stock. A manufacturer can find marketplace gaps where its products are missing. A seller can compare competitors before changing prices.
Historical availability data can also reveal seasonal patterns. For example, electronics may show stronger availability changes during major shopping festivals. Fashion products may change rapidly around seasonal launches.
From 2020 through 2026, India's e-commerce market has also shifted toward greater digital adoption, wider geographic coverage, and more diverse product categories. Bain's 2023 report noted that Indian e-retail had grown by roughly $8–12 billion annually since 2020.
This growth makes automated availability tracking more valuable.
The business goal is simple: identify what is available, where it is available, who sells it, and how those conditions change over time.
How Does Product-Level Data Improve Competitive Research?
Flipkart product data scraping services can help businesses build detailed datasets for product discovery, pricing research, seller comparison, and competitive analysis.
Product research often starts with simple questions. What products are competitors selling? Which brands appear most often? What prices are they using? Which products have the strongest ratings? Which listings have the highest review counts?
These questions become difficult when teams must check several marketplaces manually.
Automated collection can organize the answers into a single dataset.
What can product research teams compare?
| Comparison area |
Example insight |
| Product assortment |
Which products competitors offer |
| Pricing |
Which sellers use lower prices |
| Discounts |
Which products receive promotions |
| Ratings |
Customer satisfaction signals |
| Reviews |
Product feedback volume |
| Brands |
Brand visibility |
| Categories |
Category competition |
| Availability |
Stock visibility |
| Seller count |
Marketplace competition |
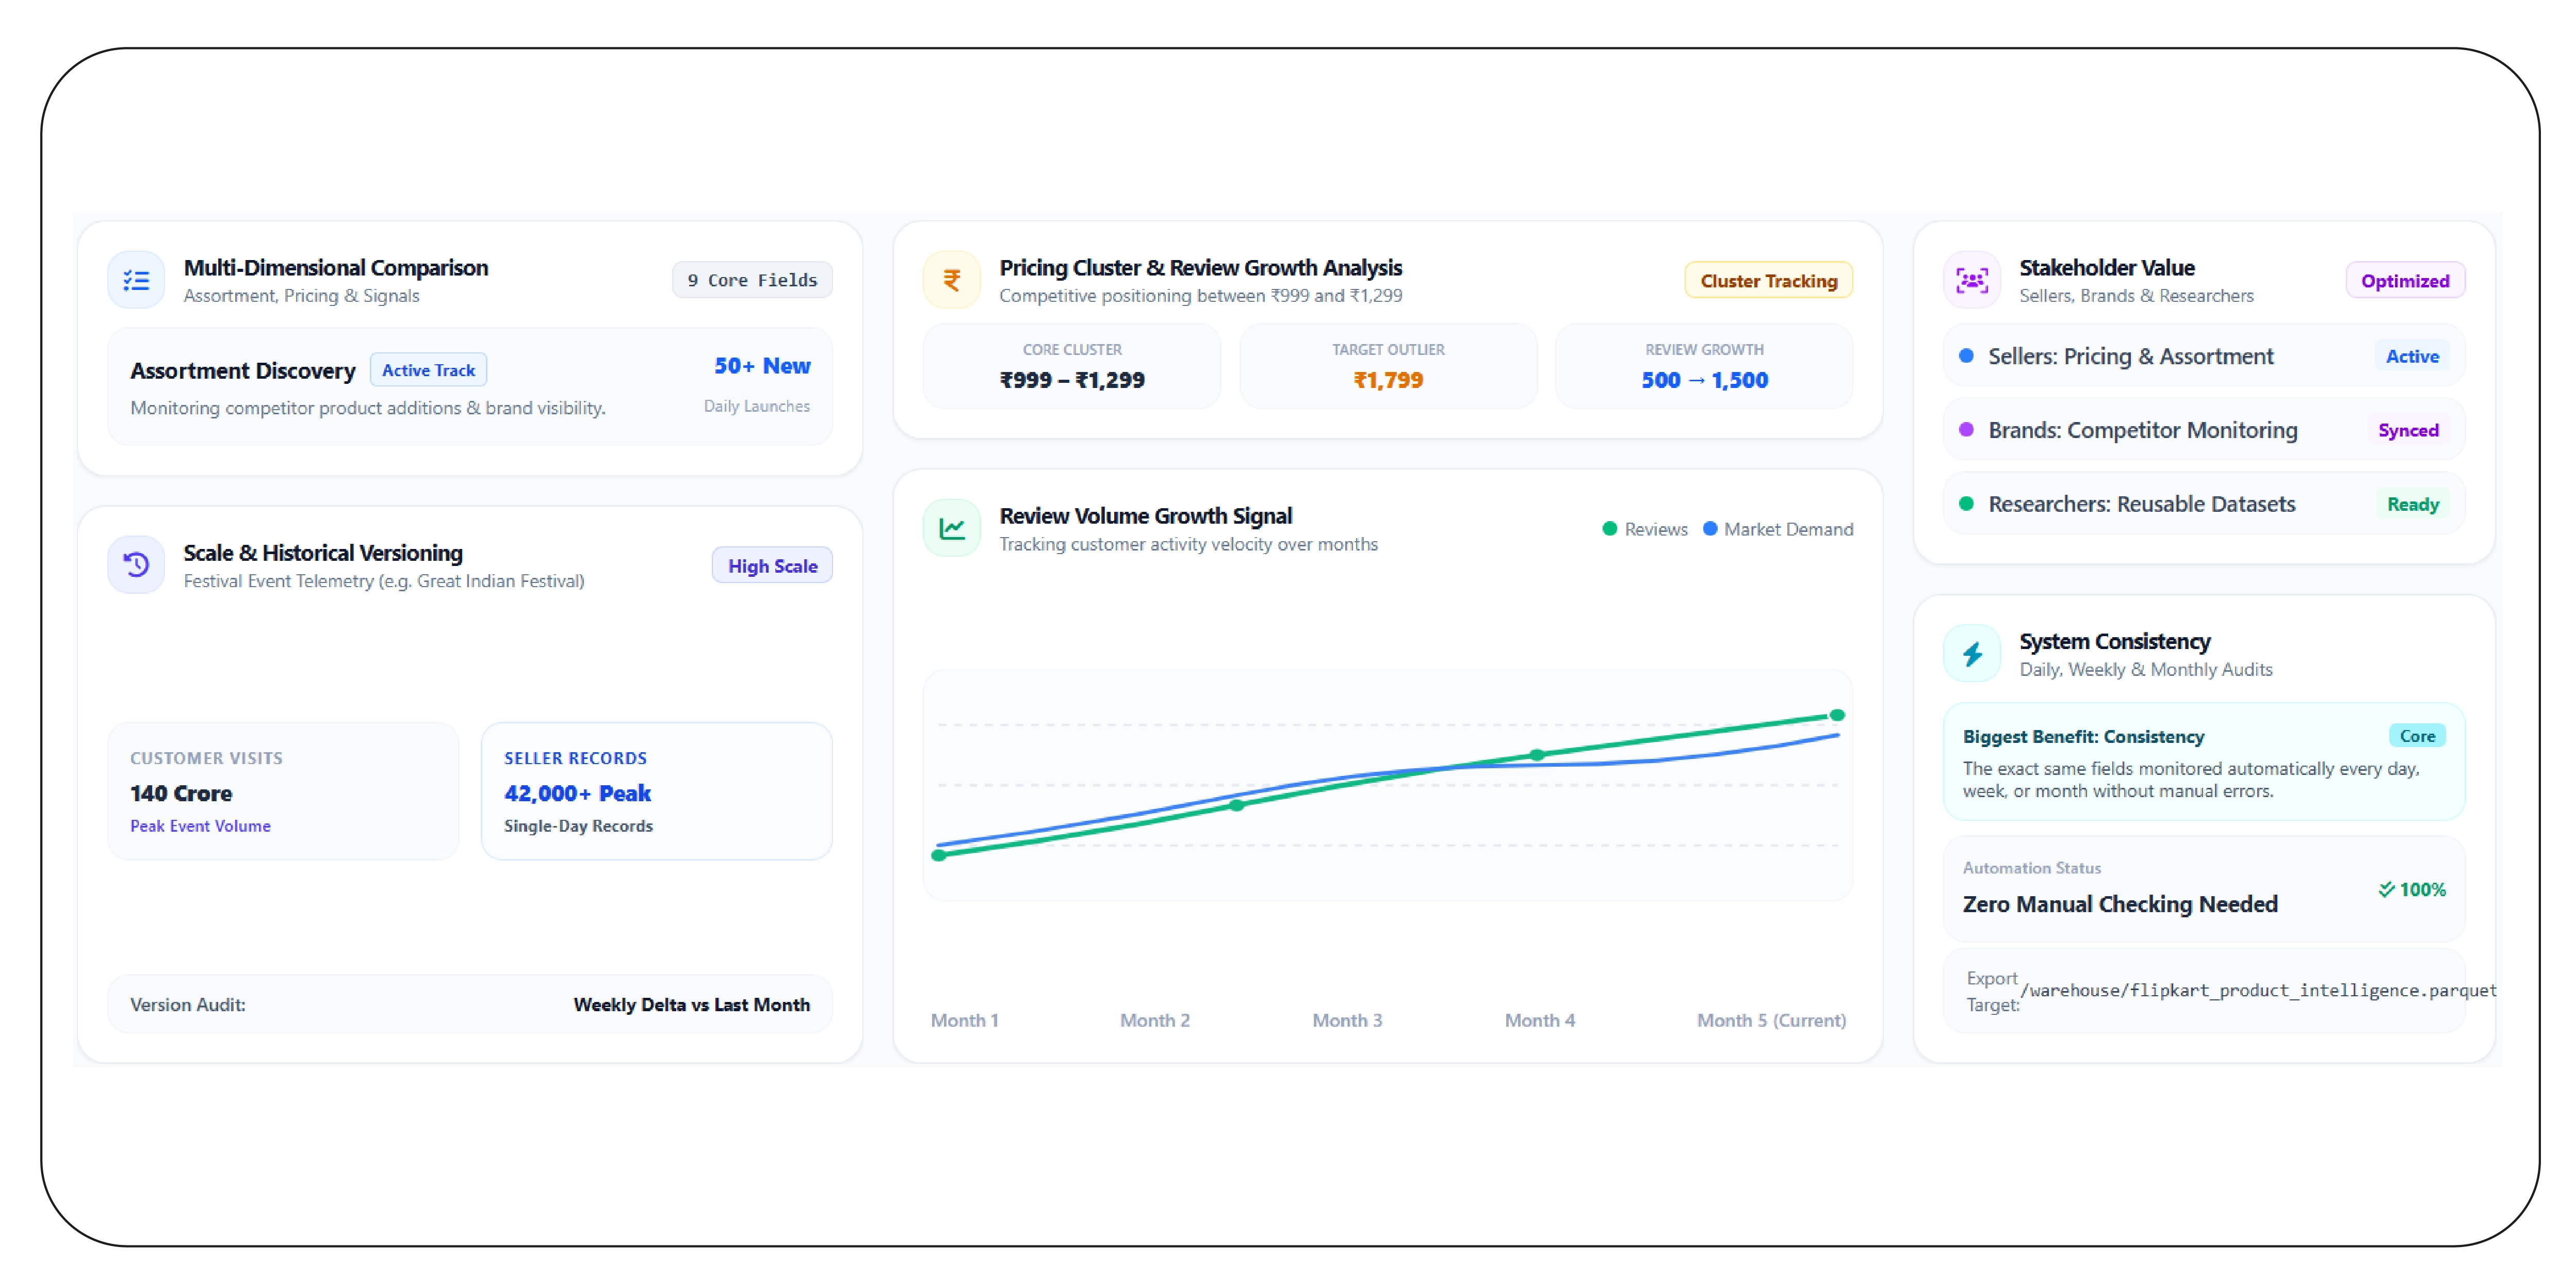
Amazon's Great Indian Festival 2024 illustrates the scale of marketplace activity. Amazon reported 140 crore customer visits during the event, more than 25,000 new product launches, and over 42,000 sellers achieving their highest-ever single-day sales.
At this scale, manual competitive research becomes inefficient.
A product intelligence workflow can collect information at regular intervals and preserve historical versions. Analysts can then compare today's listing with last week's or last month's listing.
This is particularly useful for brands managing large catalogs. Suppose a competitor launches 50 products in a category. A structured dataset can identify those additions without requiring an analyst to manually inspect every category page.
The same system can track review growth. A product with 500 reviews today and 1,500 reviews several months later may indicate increasing customer activity. The data does not prove sales volume, but it provides a useful public signal for further research.
Teams can also identify pricing clusters. If most competing products fall between ₹999 and ₹1,299, a product priced at ₹1,799 may require a different positioning strategy.
Historical data can reveal whether those price ranges are stable or change during major sales periods.
For sellers, this information supports pricing and assortment decisions. For brands, it supports competitor monitoring. For market research companies, it creates reusable datasets.
The biggest benefit is consistency. The same fields can be monitored every day, week, or month.
How Can Amazon.in Data Help Brands Improve Product Intelligence?
Amazon.in product data extraction can provide structured marketplace information for brands, retailers, sellers, and research teams.
Amazon.in has a large seller and product ecosystem. Amazon India states that more than 1.6 million micro, small, and medium enterprises work with Amazon India, including sellers, artisans, and weavers. It also reports that more than 300,000 new sellers joined Amazon.in since 2020.
This scale creates both opportunity and complexity.
A brand may need to monitor hundreds of competing products. A category manager may need to track pricing changes across multiple sellers. A research firm may need historical records across many categories.
A structured extraction workflow can help collect permitted public fields such as:
- Product titles.
- Brand names.
- Product categories.
- Prices.
- Discounts.
- Seller names.
- Ratings.
- Review counts.
- Product specifications.
- Availability indicators.
- Search-position signals where publicly observable.
How can historical monitoring work?
| Period |
Primary research objective |
| 2020 |
Establish marketplace baseline |
| 2021 |
Track post-pandemic online expansion |
| 2022 |
Monitor category and seller growth |
| 2023 |
Compare product assortment |
| 2024 |
Analyze promotional intensity |
| 2025 |
Track regional and value-led shopping |
| 2026 |
Monitor AI, personalization, and evolving discovery |
Amazon's 2024 festival data shows how quickly marketplace activity can change during major events. The company reported that more than 85% of Great Indian Festival customers came from non-metro cities and that more than 3 crore products were delivered the same day or next day to eligible customers.
This makes regional marketplace intelligence important.
A product may perform differently in metropolitan and smaller-city markets. Availability, price, seller competition, and product assortment can vary.
Brands can use historical datasets to identify those differences.
For example, a company selling home appliances could compare product availability across categories and marketplaces. A fashion brand could monitor competing product prices and review growth. An electronics manufacturer could track specifications and promotional changes.
The dataset can also support price elasticity research. If competitors repeatedly lower prices during specific periods, analysts can study whether other marketplace signals change at the same time.
Data extraction should remain compliant. Businesses should collect only information they are permitted to access and should respect marketplace terms, robots directives, technical restrictions, copyright requirements, and applicable laws.
The value comes from organized intelligence, not from unrestricted collection.
How Can Seller Data Reveal Competitive Marketplace Opportunities?
Meesho seller data scraping, Flipkart Amazon.in and Meesho Data Scraping can help businesses compare seller presence, pricing, product assortment, ratings, reviews, and competitive activity across India's major marketplaces.
Meesho has become a major player in India's value-focused e-commerce ecosystem. Its investor relations site reported more than 274 million annual transacting users, over 1.04 million annual transacting sellers, and more than 2.83 billion placed orders for the quarter ended June 30, 2026.
These figures show why seller-level data can be valuable.
A brand may want to know how many sellers offer similar products. A distributor may want to identify fast-growing categories. A marketplace seller may want to compare competitor pricing and ratings.
Which seller signals matter?
| Seller signal |
Research use |
| Seller name |
Competitor identification |
| Product count |
Assortment breadth |
| Price |
Pricing comparison |
| Discount |
Promotion tracking |
| Rating |
Customer perception |
| Review count |
Engagement signal |
| Product category |
Seller specialization |
| Availability |
Supply monitoring |
| Listing changes |
Competitive movement |
Meesho's 2024 data also showed the growing importance of content commerce. Moneycontrol reported that Meesho had 175 million transacting users in 2024 and that order volumes through content commerce were three times higher than the previous year.
This highlights how marketplace competition increasingly involves more than product and price.
Discovery channels, content, seller visibility, and consumer engagement also matter.
Cross-marketplace data allows businesses to compare the same or similar products across platforms.
For example, a seller might offer a product for ₹499 on one marketplace and ₹529 on another. Another seller might offer a similar item for ₹449. Tracking these differences over time helps analysts understand competitive price ranges.
Businesses can also identify duplicate or near-duplicate products. This is especially useful in categories with many private-label or unbranded products.
The data can support seller segmentation:
- Premium sellers.
- Value sellers.
- High-review sellers.
- High-assortment sellers.
- New sellers.
- Fast-growing sellers.
- Category specialists.
The result is better marketplace intelligence.
Instead of asking only, "What is the cheapest price?" businesses can ask more useful questions:
Who is competing? What are they selling? How often do their prices change? Which products are gaining reviews? Which sellers are expanding?
These questions can lead to stronger pricing and assortment decisions.
How Can Businesses Compare Prices Across India's Major Marketplaces?
Product price comparison across Flipkart Amazon and Meesho can help brands and retailers identify pricing gaps, promotional patterns, and competitive positioning.
Price monitoring becomes difficult when the same product has multiple sellers, discounts, bundles, colors, sizes, or specifications. A simple price comparison can therefore produce incorrect conclusions if product matching is weak.
A reliable system should first identify comparable products.
What should product matching consider?
- Brand.
- Product title.
- Model number.
- SKU.
- Product specifications.
- Size or quantity.
- Variant.
- Pack count.
- Seller.
- Marketplace.
Once products are matched, analysts can compare listed prices, discounted prices, seller offers, and availability.
Example monitoring focus by year:
| Year |
Example monitoring focus |
| 2020 |
Pandemic-driven online assortment changes |
| 2021 |
Marketplace expansion |
| 2022 |
Category and price normalization |
| 2023 |
Value-focused competition |
| 2024 |
Festival discount monitoring |
| 2025 |
Tier 2/3 and value-led demand |
| 2026 |
Personalized and AI-driven shopping |
India's e-retail market was estimated at $57–60 billion in 2023, with Bain projecting $165–180 billion by 2028. This scale makes price intelligence increasingly important for brands competing across multiple platforms.
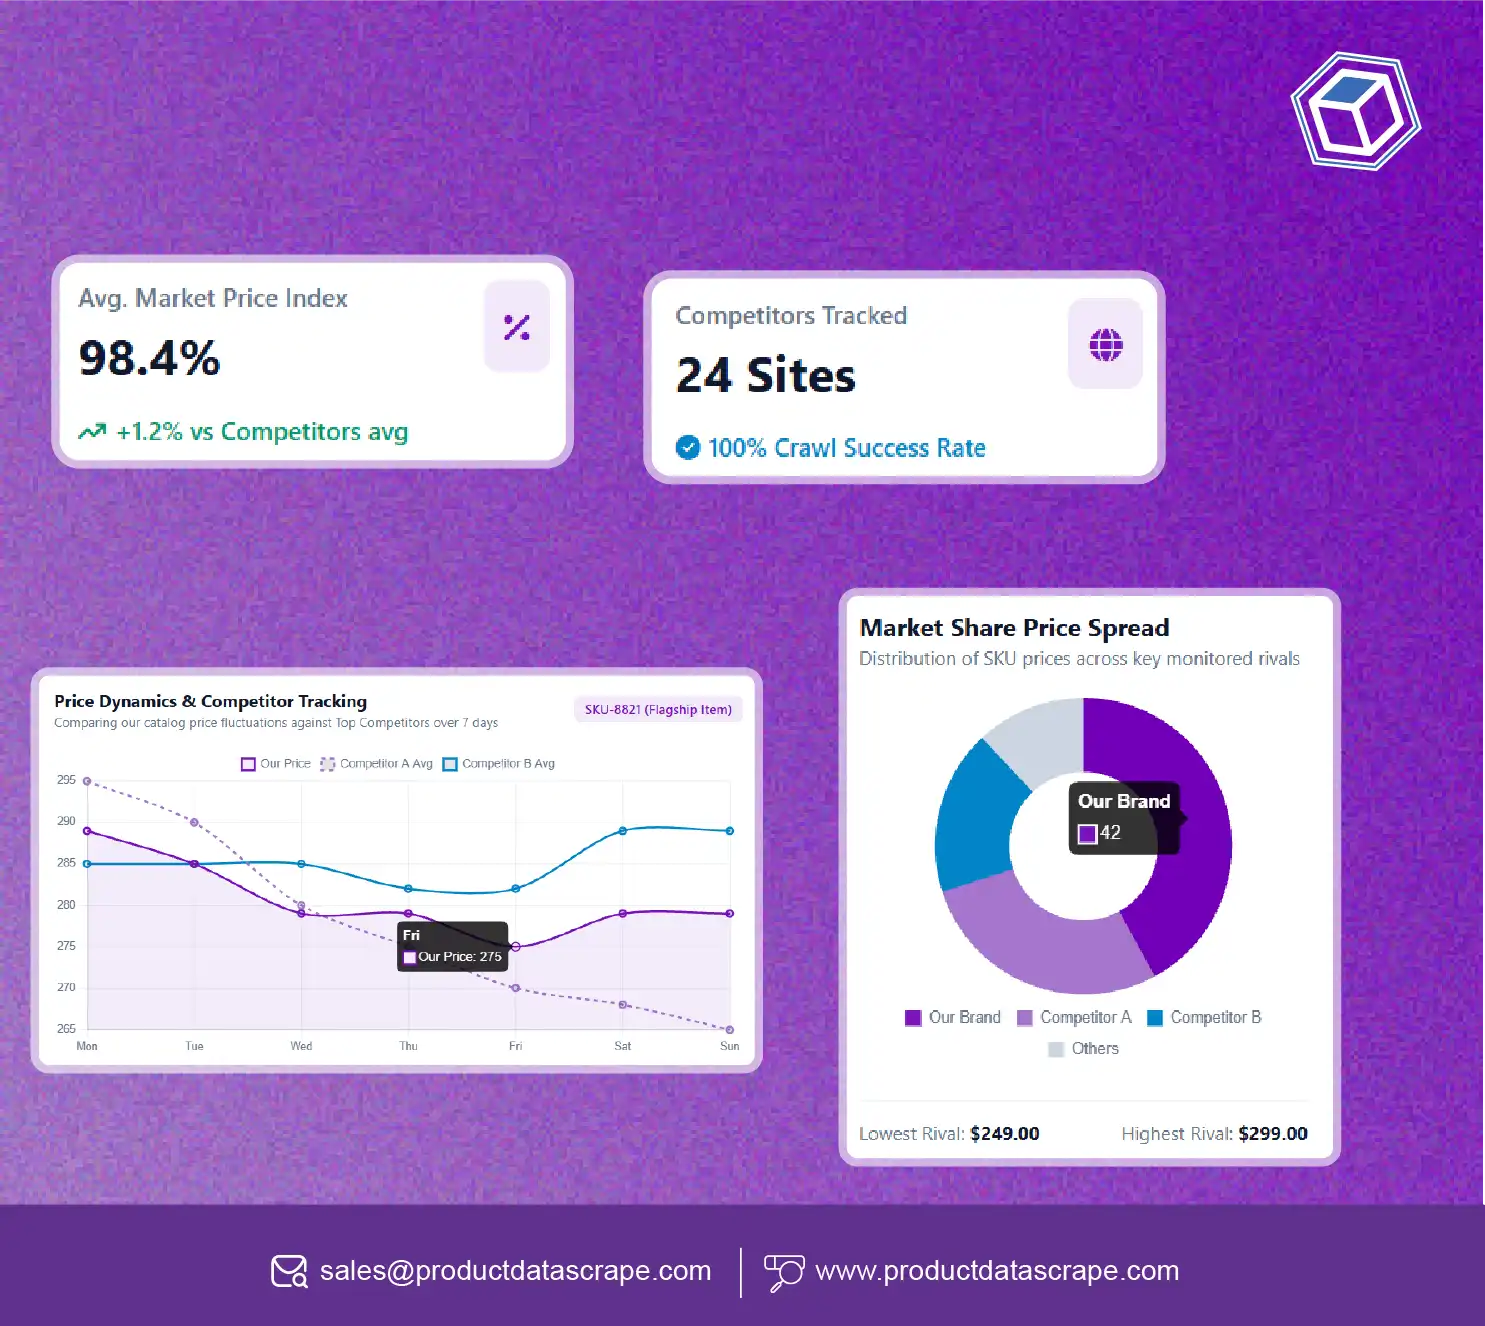
Price monitoring can answer several practical questions:
- Is a competitor consistently cheaper?
- Which marketplace offers the strongest discount?
- Are prices changing during festivals?
- Which products have stable prices?
- Which sellers frequently undercut competitors?
- Are discounts temporary or persistent?
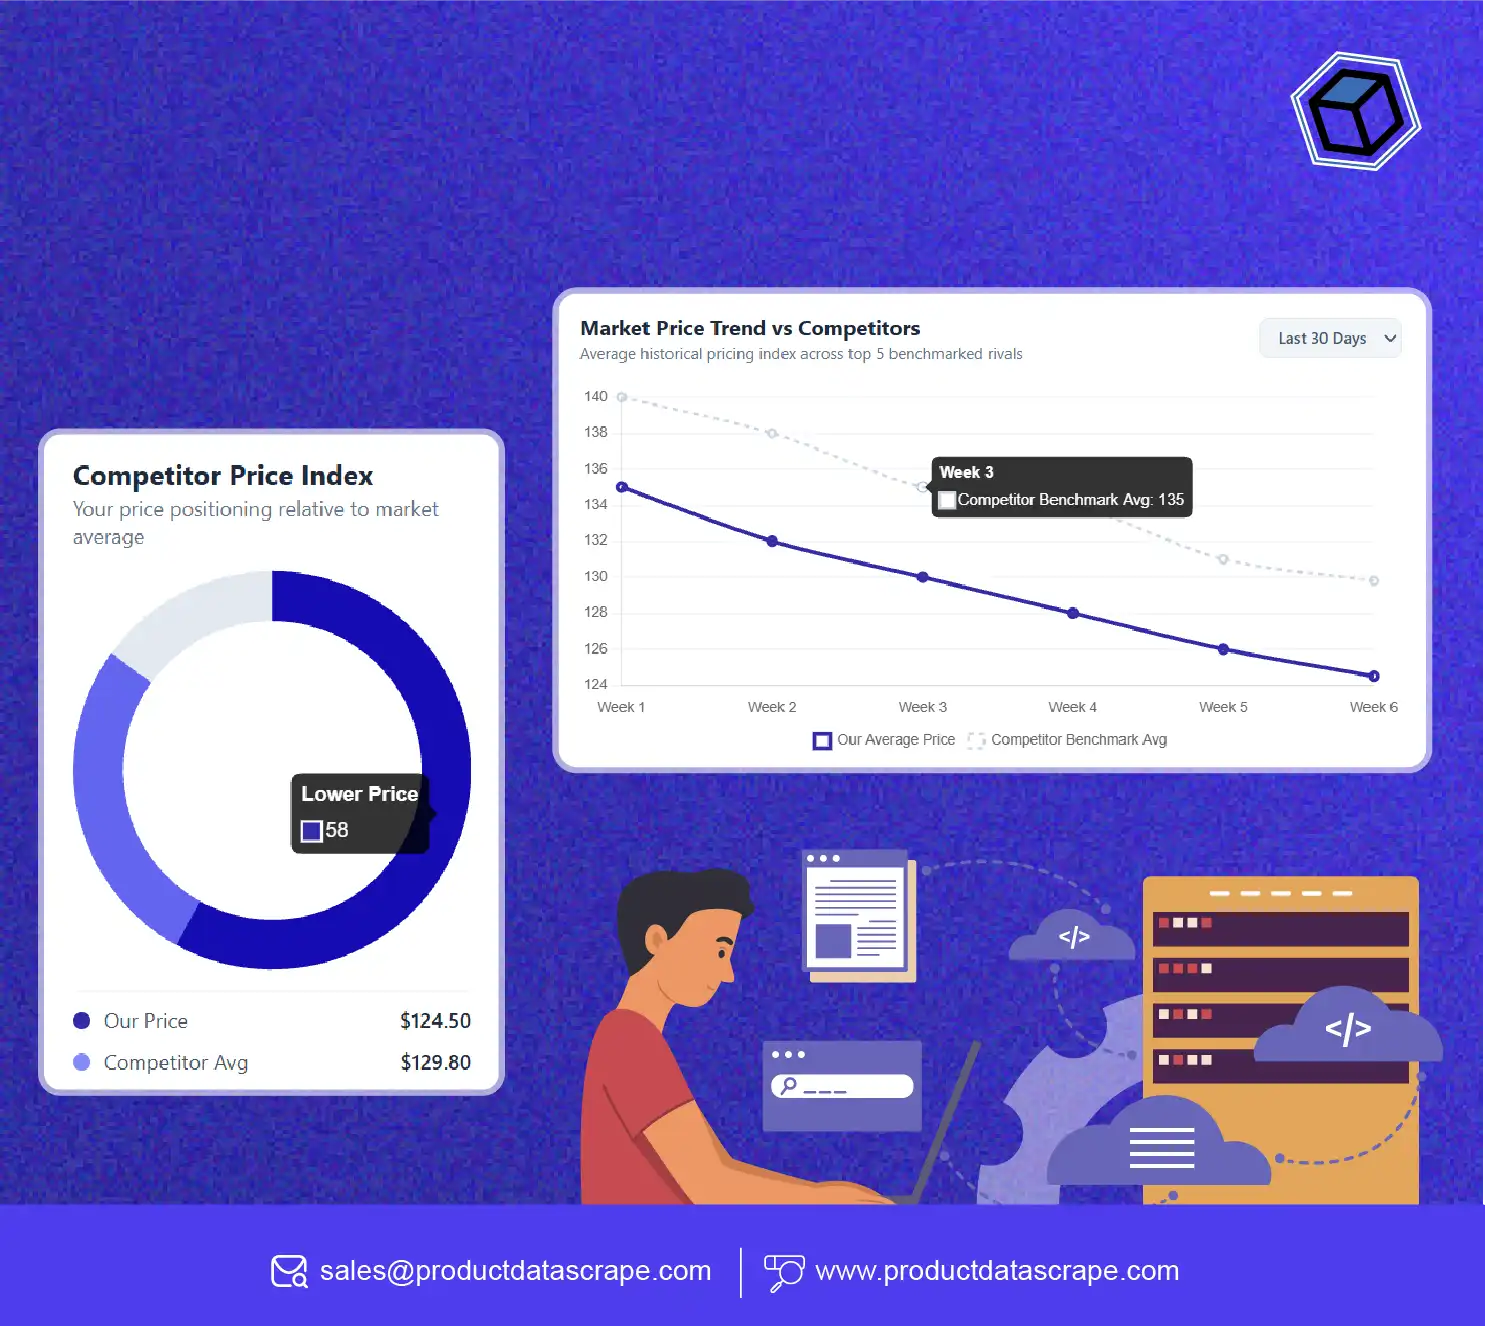
A historical price dataset is especially useful.
Suppose a product normally sells for ₹2,999. During a major sale, it drops to ₹2,499. After the sale, it returns to ₹2,899. A single snapshot would miss the full pattern.
A time-series dataset captures it.
This can help businesses measure discount depth, promotion frequency, and competitive price movement.
Price comparison can also support Minimum Advertised Price monitoring where applicable and legally appropriate. Brands can identify potential pricing inconsistencies and investigate them internally.
For retailers, competitor prices can support assortment and promotional planning. For manufacturers, the data can support channel strategy. For sellers, it can help benchmark marketplace positioning.
The key is to compare like-for-like products.
Poor product matching can make an expensive premium model appear overpriced against a cheaper model with different specifications.
Therefore, data normalization and product identity resolution are essential parts of the workflow.
How Can an Automated Marketplace Scraper Support E-Commerce Intelligence?
A Flipkart scraper can form one component of a broader marketplace data pipeline that collects permitted public product information and delivers it into an analytics environment.
The same architecture can support multiple marketplaces. Businesses can define a common schema and map marketplace-specific fields into that structure.
What could the common schema contain?
| Field |
Purpose |
| Marketplace |
Source identification |
| Product ID |
Product matching |
| Product title |
Product classification |
| Brand |
Brand analysis |
| Category |
Category comparison |
| Price |
Pricing intelligence |
| Discount |
Promotion analysis |
| Seller |
Seller intelligence |
| Rating |
Customer signal |
| Reviews |
Engagement signal |
| Availability |
Inventory visibility |
| Timestamp |
Historical tracking |
An API-based workflow can automate collection and delivery.
A typical process includes:
- Step 1: Define requirements. Select categories, products, marketplaces, and fields.
- Step 2: Collect permitted information. Follow source-specific rules and technical restrictions.
- Step 3: Normalize records. Standardize names, prices, units, categories, and identifiers.
- Step 4: Match products. Connect equivalent products across marketplaces.
- Step 5: Validate data. Detect missing, duplicate, or inconsistent records.
- Step 6: Store history. Preserve timestamps for price and availability tracking.
- Step 7: Analyze. Build dashboards, reports, rankings, and alerts.
- Step 8: Integrate. Connect the dataset with business intelligence tools, databases, or internal applications.
The need for automation is clear from marketplace scale. Flipkart reported that nearly 60% of its customers came from Tier 2 and Tier 3+ towns in 2025. Amazon reported 140 crore customer visits during its 2024 Great Indian Festival. Meesho reported more than 1.04 million annual transacting sellers for the quarter ended June 2026.
These ecosystems create large and constantly changing datasets.
Automation allows businesses to monitor them consistently.
It also creates opportunities for advanced analytics. Teams can calculate average prices, identify outliers, track seller growth, compare categories, and monitor review changes.
Machine learning can later be added to classify products, identify similar listings, detect anomalies, or forecast potential demand.
However, automated collection should remain responsible. Organizations should verify marketplace permissions, terms, robots instructions, rate limits, data licensing, copyright rules, and applicable regulations before deployment.
The goal is a reliable intelligence system that supports better decisions without creating unnecessary technical or compliance risk.
Why Choose Product Data Scrape?
A marketplace intelligence strategy needs consistent data, scalable collection, and clean product records. Meesho Scraping API workflows can help businesses collect permitted marketplace information and connect it with analytics systems. The same infrastructure can support pricing research, product monitoring, seller intelligence, and competitive analysis.
A strong solution should provide:
- Structured marketplace datasets.
- Recurring data collection.
- Product and seller fields.
- Historical price tracking.
- Data validation.
- Marketplace comparison.
- API-ready delivery.
- Scalable processing.
For brands and retailers, this reduces manual research and creates a repeatable approach to marketplace intelligence.
Conclusion
Amazon Product Data Scraper workflows can help businesses collect structured product information for pricing, assortment, seller, and competitive research. When combined with data from multiple marketplaces, the result is a broader view of India's fast-changing e-commerce environment.
Flipkart Amazon.in and Meesho Data Scraping can help brands compare products, prices, sellers, reviews, ratings, and availability across major marketplaces. Historical data also makes it possible to identify pricing patterns and marketplace changes that a single snapshot cannot reveal.
From 2020 to 2026, India's e-commerce ecosystem has expanded in scale, geography, seller participation, and product discovery. Bain projected Indian e-retail to reach $165–180 billion by 2028, while current marketplace data shows strong participation from both metropolitan and smaller-city consumers.
The right data strategy should focus on accuracy, product matching, historical tracking, automation, and responsible collection.
Ready to turn marketplace data into actionable e-commerce intelligence? Contact Product Data Scrape to build a scalable solution for product research, price monitoring, seller analysis, and competitive marketplace intelligence!
FAQs
What is marketplace data scraping?
Marketplace data scraping collects permitted public product information such as prices, sellers, ratings, reviews, availability, and product details for structured analysis and competitive research.
Why compare Flipkart, Amazon.in, and Meesho?
Comparing the three marketplaces helps businesses identify price differences, seller competition, product availability, assortment gaps, and marketplace-specific trends across Indian e-commerce.
Can price data be tracked historically?
Yes. Timestamped datasets can record prices over time, helping businesses identify discounts, promotional cycles, competitor changes, and longer-term pricing patterns across selected products.
Who can benefit from this data?
Brands, retailers, manufacturers, marketplace sellers, agencies, researchers, and e-commerce teams can use structured marketplace data for pricing, product research, assortment planning, and competitive intelligence.
How can Product Data Scrape support marketplace research?
Product Data Scrape can help businesses create structured, scalable marketplace data workflows for product monitoring, pricing analysis, seller intelligence, historical tracking, and API-based analytics.


 Singapore
 EMAIL
EMAIL
 PHONE
PHONE


.webp)













.webp)






