Introduction
Price Monitoring SaaS Data helps e-commerce brands, retailers, marketplaces, and pricing teams replace repetitive manual checks with structured, repeatable price intelligence. Businesses can collect product prices, discounts, availability, seller information, and historical changes to make faster competitive decisions.
A modern pricing operation needs more than a spreadsheet. Competitor prices can change daily or even multiple times within a day. Manual monitoring can miss important movements and make it difficult to compare thousands of products.
Building Data Pipelines provides a practical solution. A structured pipeline can collect permitted marketplace and website data, normalize it, validate it, store historical records, and deliver the results to pricing dashboards or business systems.
Industry context: The global e-commerce market has expanded significantly since 2020, increasing the number of products and competitors that pricing teams need to monitor. The 2020–2026 figures used below are hypothetical examples for demonstrating how a pricing-data operation can scale. They are not official industry statistics.
The target audience includes e-commerce managers, pricing analysts, marketplace sellers, retailers, SaaS companies, and competitive intelligence teams.
How Does a Centralized Pricing Data Layer Work?
A Price Monitoring SaaS Data Layer acts as the foundation for a competitive pricing system. It organizes information collected from permitted sources into consistent records that downstream applications can understand.
Without a central data layer, pricing teams may store information in separate spreadsheets, databases, or dashboards. This creates duplicate records and makes historical comparison difficult.
A centralized layer can store product IDs, seller names, prices, discounts, availability, URLs where appropriate, timestamps, and category information. The exact fields should match the business use case.
| Year |
Hypothetical products monitored |
Price records |
Primary use |
| 2020 |
50,000 |
250,000 |
Baseline research |
| 2021 |
80,000 |
400,000 |
Competitor comparison |
| 2022 |
125,000 |
625,000 |
Price benchmarking |
| 2023 |
200,000 |
1 million |
Automated monitoring |
| 2024 |
325,000 |
1.6 million |
Competitive intelligence |
| 2025 |
500,000 |
2.5 million |
Pricing optimization |
| 2026 |
750,000 |
3.75 million |
Continuous monitoring |
Figures are hypothetical examples.
The data layer should preserve timestamps. A price without a timestamp provides limited historical value. A timestamped record allows teams to determine when a price was observed and compare it with previous observations.
Data normalization is equally important. Different sources may display currencies, discounts, product names, and units differently. Standardization makes comparisons more reliable.
The data layer can also support data-quality checks. Duplicate products, missing prices, incorrect values, and stale records should be identified before the information reaches a pricing system.
A well-designed data layer therefore becomes the single source for competitive pricing analysis.
It also makes future expansion easier. New marketplaces or product categories can be added without rebuilding the complete pricing workflow.
How Should a Scalable Pricing Collection System Be Designed?
A Price Scraping SaaS Architecture should separate collection, processing, storage, and analysis. This design makes the system easier to maintain as the number of products and sources increases.
The collection layer retrieves permitted information. The processing layer cleans and standardizes it. The storage layer maintains current and historical records. The analytics layer calculates pricing metrics and generates insights.
Each component has a specific role.
The collector gathers relevant information. A queue helps manage large volumes of incoming records. The parser converts source information into structured fields. Validation checks data quality. The database stores current and historical observations.
| Year |
Hypothetical sources |
Products per source |
Architecture priority |
| 2020 |
20 |
2,500 |
Basic collection |
| 2021 |
35 |
3,500 |
Standardization |
| 2022 |
55 |
5,000 |
Scalability |
| 2023 |
80 |
7,500 |
Automation |
| 2024 |
120 |
10,000 |
Distributed processing |
| 2025 |
175 |
14,000 |
Real-time monitoring |
| 2026 |
250 |
18,000 |
Enterprise scale |
Figures are hypothetical.
The architecture should also account for failures. Websites can change structures. Network requests can fail. Data can arrive incomplete.
Retry mechanisms, logging, monitoring, and validation help keep the pipeline reliable.
Businesses should also avoid collecting more information than necessary. A pricing system may only require product ID, price, discount, availability, seller, and timestamp.
A focused schema reduces processing requirements and makes downstream analysis easier.
The architecture should also support historical storage. Current pricing tells teams what is happening now. Historical pricing explains how the market reached that point.
This distinction is critical for competitive intelligence.
How Can a Data Pipeline Automate Price Tracking?
A Price Tracking Data Pipeline converts repeated price collection into an automated workflow. Instead of employees checking individual products manually, the system can collect permitted information according to predefined schedules and business rules.
The pipeline begins with a list of products or sources to monitor. The collection layer retrieves relevant information. The system then extracts price, availability, seller, discount, and other required fields.
Next, the records are normalized. Prices should follow consistent formats. Product identifiers should remain stable. Timestamps should be stored with each observation.
The pipeline can then compare new observations with historical records.
| Year |
Hypothetical price observations |
Change events detected |
Main objective |
| 2020 |
300,000 |
30,000 |
Baseline monitoring |
| 2021 |
500,000 |
55,000 |
Competitor tracking |
| 2022 |
800,000 |
90,000 |
Price analysis |
| 2023 |
1.3 million |
150,000 |
Automated alerts |
| 2024 |
2.1 million |
240,000 |
Competitive intelligence |
| 2025 |
3.2 million |
390,000 |
Pricing decisions |
| 2026 |
4.8 million |
600,000 |
Continuous monitoring |
Figures are hypothetical.
Change detection is one of the most useful pipeline functions.
If a competitor changes a product price from $100 to $92, the system can record the difference and calculate the percentage change. The pricing team can then decide whether the change requires action.
Not every change requires an immediate response. A temporary promotion may not represent a long-term competitive shift.
Historical data provides context. Teams can determine whether a price movement is unusual or part of a recurring pattern.
A mature pipeline can also create alerts based on thresholds. For example, teams may receive notifications when a competitor price changes by more than a defined percentage.
This reduces manual monitoring while allowing analysts to focus on decisions instead of repetitive collection.
How Can Web Data Support SaaS Pricing Intelligence?
Web Scraping for SaaS Pricing Data can help SaaS businesses monitor competitor plans, subscription prices, feature packages, promotional offers, and changes to public pricing information where collection is permitted.
SaaS pricing is different from physical-product pricing. Companies may offer monthly plans, annual plans, usage-based pricing, free tiers, enterprise packages, or promotional discounts.
A pricing dataset therefore needs flexible fields.
Businesses may monitor plan names, listed prices, billing periods, included features, usage limits, promotional information, and observation dates.
| Year |
Hypothetical SaaS pricing pages monitored |
Plans tracked |
Primary use |
| 2020 |
5,000 |
20,000 |
Market research |
| 2021 |
8,000 |
32,000 |
Competitor benchmarking |
| 2022 |
12,000 |
48,000 |
Feature comparison |
| 2023 |
18,000 |
72,000 |
Pricing intelligence |
| 2024 |
27,000 |
108,000 |
Competitive monitoring |
| 2025 |
40,000 |
160,000 |
Strategic pricing |
| 2026 |
60,000 |
240,000 |
Continuous research |
Figures are hypothetical.
Feature normalization is important. Two SaaS plans can have different names but provide similar capabilities. Analysts can map comparable features to make the comparison more meaningful.
Historical snapshots can also identify pricing changes. A SaaS company may change its monthly price, introduce a new plan, remove an old plan, or modify included features.
These changes can influence competitive positioning.
Pricing intelligence should not focus only on the number displayed on a pricing page. Feature limits and billing structures can significantly affect the actual value offered to customers.
A structured dataset can therefore support both price and feature analysis.
The same pipeline architecture used for e-commerce price monitoring can be adapted to SaaS pricing research.
How Can a Pricing System Architecture Support Automated Alerts?
A Price Monitoring System Architecture connects data collection with business rules and alerts. Its purpose is not simply to store prices. It should help businesses identify meaningful changes.
A basic system can include five layers: data collection, processing, storage, analytics, and notification.
The collection layer gathers permitted information. Processing validates and normalizes it. Storage maintains historical records. Analytics calculates changes. The notification layer sends relevant alerts to users or systems.
| Year |
Hypothetical monitored products |
Alerts generated |
Automation level |
| 2020 |
40,000 |
10,000 |
Basic |
| 2021 |
70,000 |
20,000 |
Scheduled |
| 2022 |
110,000 |
35,000 |
Rule-based |
| 2023 |
175,000 |
60,000 |
Automated |
| 2024 |
275,000 |
100,000 |
Advanced |
| 2025 |
425,000 |
160,000 |
Near real-time |
| 2026 |
650,000 |
250,000 |
Intelligent monitoring |
Figures are hypothetical.
Alerts should be meaningful. Sending notifications for every small price movement can overwhelm users.
Businesses can define thresholds based on product category, competitor, price range, or percentage movement.
For example, a pricing team may only want an alert when a key competitor changes a product price by more than 5%.
The system can also prioritize products. High-revenue products may require more frequent monitoring than low-priority items.
Historical data improves alert quality. If a price regularly changes during weekends, the system can distinguish expected movement from unusual activity.
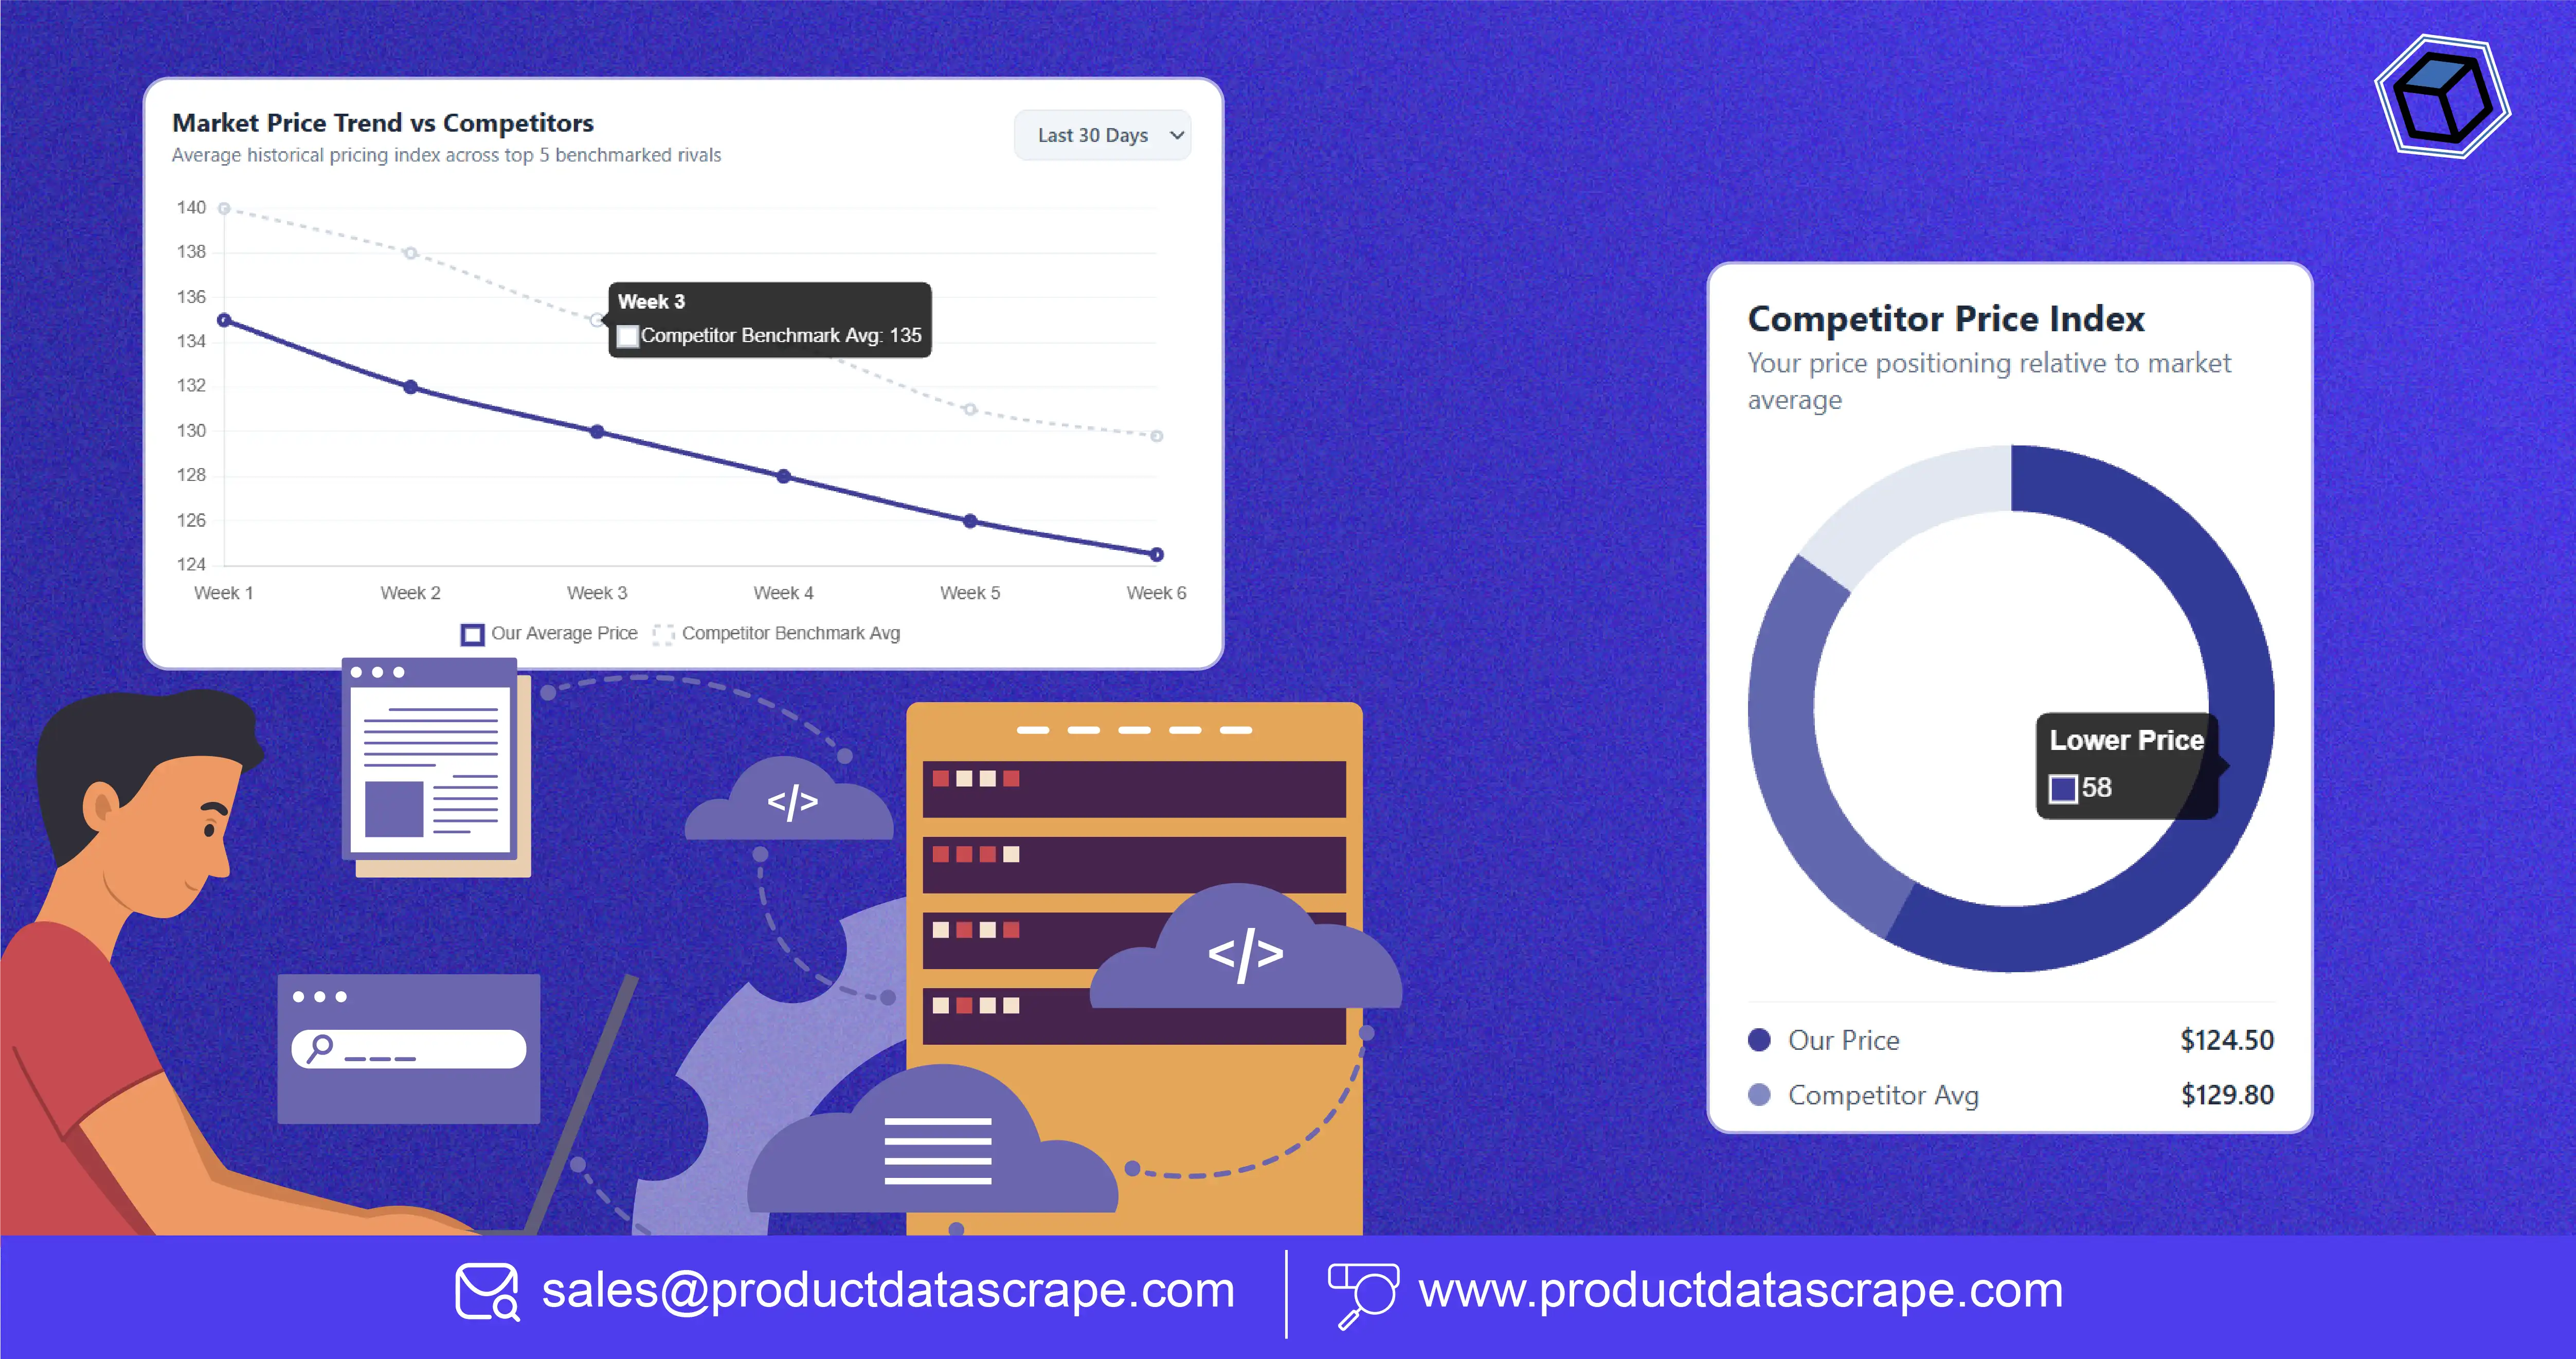
The architecture can also feed dashboards. Managers can view current prices, historical trends, competitor gaps, and recent changes in one place.
This turns raw price data into decision-ready intelligence.
How Can Price Monitoring Improve Competitive Intelligence?
Price Monitoring, Price Monitoring SaaS Data can help businesses understand competitor pricing behavior, identify market movements, and evaluate their own price positioning.
Competitive intelligence becomes more valuable when pricing is tracked over time.
A single competitor price may not tell the complete story. Historical observations can show how frequently a competitor changes prices and whether those changes are connected to promotions or market events.
| Year |
Hypothetical products tracked |
Competitor changes recorded |
Intelligence focus |
| 2020 |
75,000 |
100,000 |
Basic benchmarking |
| 2021 |
120,000 |
170,000 |
Price comparison |
| 2022 |
190,000 |
280,000 |
Competitive tracking |
| 2023 |
300,000 |
450,000 |
Market intelligence |
| 2024 |
475,000 |
700,000 |
Pricing strategy |
| 2025 |
725,000 |
1.1 million |
Automated analysis |
| 2026 |
1.1 million |
1.7 million |
Continuous intelligence |
Figures are hypothetical.
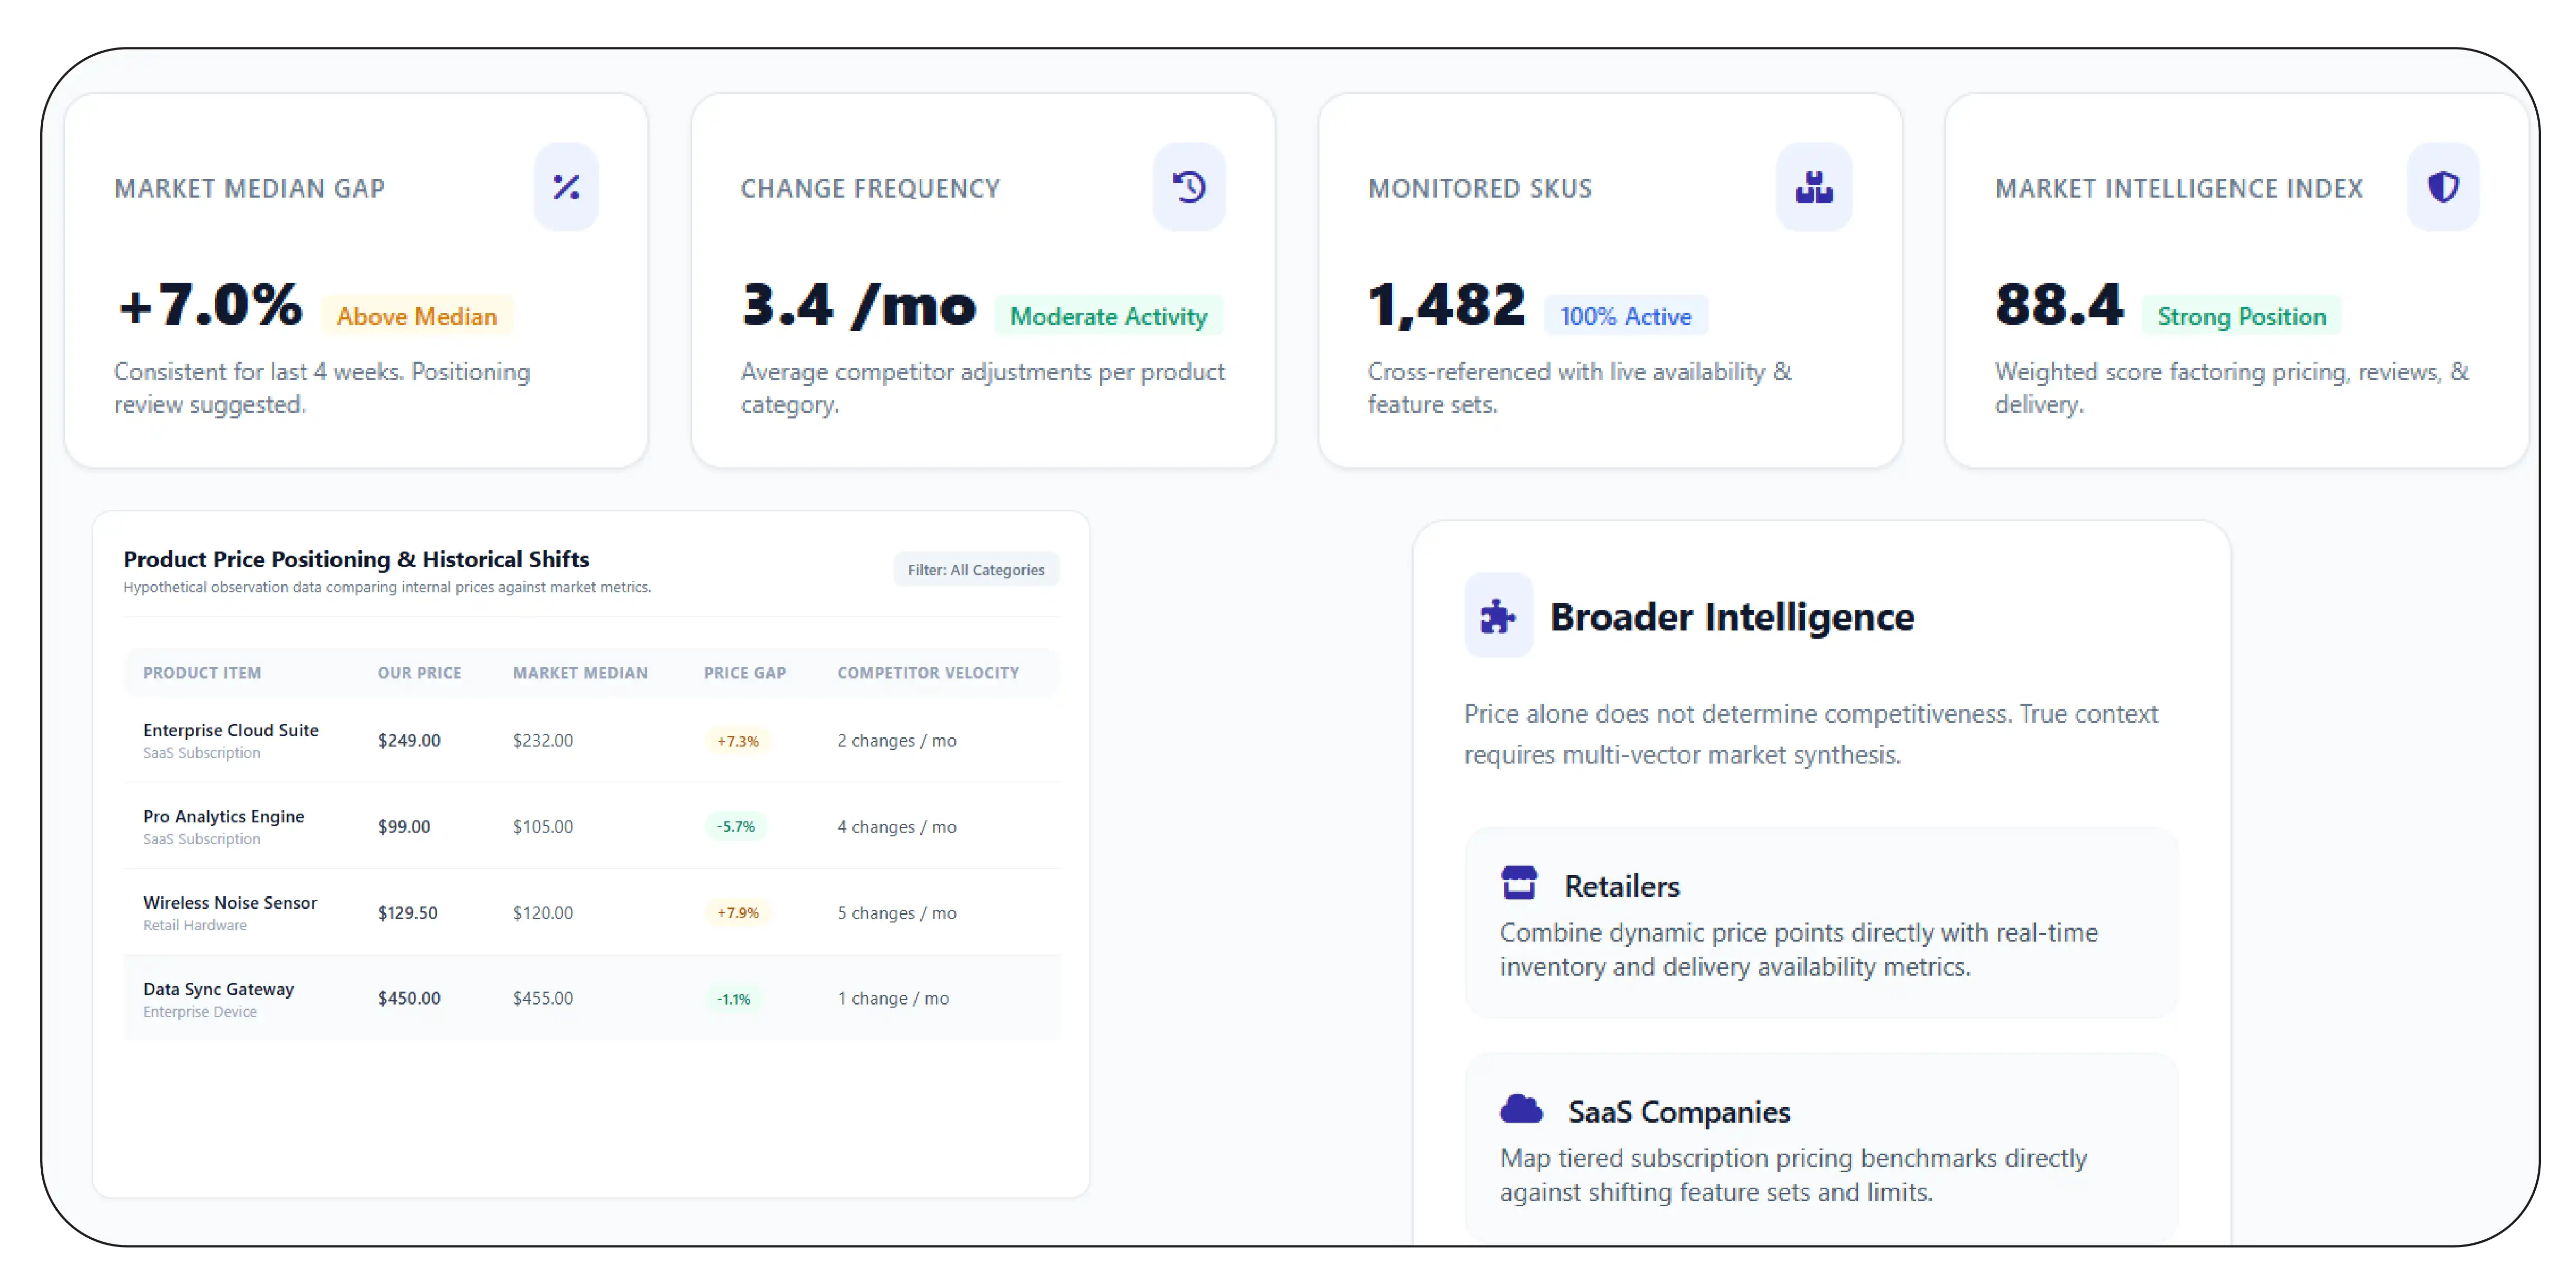
Businesses can calculate price gaps between their products and competitors. They can also track the frequency of competitor price changes.
For example, a product may remain 7% above the market median for several weeks. That could prompt a review of positioning.
However, price alone does not determine competitiveness. Product quality, delivery, availability, ratings, brand strength, features, and customer experience also matter.
This is why price monitoring should connect with broader marketplace intelligence.
A retailer can combine price information with product availability. A SaaS company can combine subscription prices with feature comparisons. A brand can combine competitor prices with ratings and reviews.
This creates a richer competitive picture.
The objective is not to copy competitor prices. It is to understand the market well enough to make informed pricing decisions.
How Can Businesses Build an Effective Pricing Data Pipeline?
A strong pricing system begins with a clear business objective.
Step 1: Define the Products
Identify the products, competitors, categories, or plans that require monitoring.
Step 2: Select Authorized Sources
Choose permitted sources that contain relevant pricing information.
Step 3: Define the Schema
Decide which fields the system needs. Avoid collecting unnecessary information.
Step 4: Create the Collection Layer
Establish recurring data retrieval according to the required refresh schedule.
Step 5: Normalize the Data
Standardize currencies, product identifiers, units, discounts, and dates.
Step 6: Validate Records
Check for duplicates, missing fields, unexpected values, and stale observations.
Step 7: Store Historical Data
Maintain timestamped records for trend analysis.
Step 8: Calculate Price Changes
Compare current observations with previous records.
Step 9: Create Business Rules
Define which changes should generate alerts.
Step 10: Connect the Data to Analytics
Deliver the results to dashboards, databases, pricing tools, or internal applications.
This workflow turns raw data into a repeatable intelligence process.
What Metrics Should a Pricing Team Monitor?
The most useful pricing metrics depend on the business model. However, several measures apply across e-commerce and SaaS markets.
| Metric |
Purpose |
| Current price |
Present competitive position |
| Historical price |
Trend analysis |
| Price change percentage |
Movement detection |
| Market median |
Benchmarking |
| Competitor price gap |
Positioning |
| Discount percentage |
Promotion analysis |
| Availability |
Supply context |
| Price-change frequency |
Competitor behavior |
| Product coverage |
Monitoring quality |
| Data freshness |
Operational reliability |
These metrics can be segmented by product, category, competitor, marketplace, country, or region.
Segmentation helps teams avoid misleading averages.
A premium product should not necessarily be compared with an entry-level product. A monthly SaaS plan should not be compared directly with an annual plan without normalization.
The more consistent the dataset, the more useful the resulting analysis.
How Does Historical Pricing Improve Decision-Making?
Historical pricing provides context that current pricing cannot.
Imagine a competitor's product currently costs $80. Without history, the pricing team cannot know whether this is normal.
Historical observations may reveal that the product normally costs $95 and recently entered a temporary promotion.
Alternatively, the price may have gradually declined from $100 to $80 over several months.
These two scenarios require very different responses.
Historical datasets help businesses identify:
- Long-term price trends.
- Temporary promotions.
- Recurring discounts.
- Competitive price movements.
- Seasonal pricing.
- Category volatility.
- Persistent price gaps.
This makes historical storage a critical component of a pricing data architecture.
How Can Data Quality Improve Price Intelligence?
Pricing intelligence depends on accurate records.
Incorrect product matching can create false price comparisons. Missing timestamps can make historical analysis unreliable. Duplicate records can distort product counts.
A strong data-quality framework should validate:
- Product identity.
- Seller identity.
- Currency.
- Price.
- Discount.
- Availability.
- Timestamp.
- Source.
- Category.
- Product variation.
Businesses should also distinguish between observed prices and actual transaction prices.
A marketplace listing price is not necessarily the final price paid by a customer.
This distinction matters when pricing data is used for strategic decisions.
Why Choose Product Data Scrape?
Product Data Scrape helps businesses build structured pricing and marketplace data workflows that support competitive intelligence, price benchmarking, assortment research, and historical analysis.
A scalable system can reduce repetitive manual work and organize large volumes of pricing observations into consistent datasets.
Price scraping, Price Monitoring SaaS Data workflows can support recurring collection, data normalization, historical storage, change detection, and analytical delivery when appropriate access methods are available.
The focus should remain on business outcomes. Pricing teams need actionable signals, not unnecessary data volume. Structured records can help identify meaningful competitor movements and support better commercial decisions.
Conclusion
Manual price tracking becomes increasingly difficult as product catalogs, competitors, and pricing changes grow. A structured data pipeline can automate recurring collection, normalize records, preserve historical observations, detect changes, and deliver actionable insights.
Businesses can use this infrastructure to monitor competitor prices, identify pricing gaps, understand promotional patterns, and improve competitive positioning.
A strong solution should combine reliable data collection with validation, historical storage, change detection, and clear business rules. It should also respect applicable website terms, permissions, and legal requirements.
The goal is not to react to every competitor movement. It is to understand meaningful market changes and make informed decisions.
A scalable web scraping API market strategy can provide the data foundation needed for automated pricing intelligence across e-commerce, marketplaces, and SaaS businesses.
Build a smarter competitive pricing workflow with Product Data Scrape and turn continuously updated marketplace data into faster, more informed pricing decisions!
FAQs
1. What is Price Monitoring SaaS Data?
It is structured pricing information collected from permitted sources and used to track competitor prices, discounts, availability, product changes, and historical market movements.
2. How can businesses automate price tracking?
Businesses can connect authorized data collection with normalization, validation, historical storage, change detection, dashboards, and alerts to reduce repetitive manual monitoring.
3. Can pricing data support dynamic pricing?
Yes. Current and historical competitor pricing can provide market signals for pricing models, but businesses should combine external data with costs, margins, demand, and internal sales information.
4. What role does Product Data Scrape play?
Product Data Scrape can help organizations create structured pricing datasets for competitive research, benchmarking, monitoring, historical analysis, and broader marketplace intelligence workflows.
5. How often should competitor prices be monitored?
The ideal frequency depends on market volatility. Fast-moving categories may require frequent updates, while stable products may only need daily or weekly monitoring.


 Singapore
 EMAIL
EMAIL
 PHONE
PHONE















.webp)






