Introduction
B2B Brands Monitor 200K+ SKUs Across 5 Countries by combining automated product discovery, recurring availability checks, SKU-level matching, distributor monitoring, and structured historical datasets. The approach helps manufacturers, distributors, industrial suppliers, and MRO brands identify unavailable products, assortment gaps, channel inconsistencies, and changes across international markets without relying on manual checks.
For B2B organizations, the challenge is not simply having a large catalog. A portfolio of 200,000+ SKUs spread across five countries can create millions of potential product-location-channel combinations. Each combination can have different availability, distributor listings, pack configurations, lead times, pricing, and product status.
Out-of-stock monitoring turns these changes into measurable events. Instead of asking whether a product is available at one moment, businesses can determine when it went out of stock, how long the condition persisted, which channels were affected, and whether alternative distributors continued to carry it.
Digital commerce has become increasingly important to B2B manufacturers and distributors. Digital Commerce 360 reported that B2B e-commerce sales were projected to reach $2.61 trillion in 2024, while digital interactions and purchases had become preferred by around 67% of industrial companies, compared with 20% five years earlier. (Digital Commerce 360)
That shift makes product availability a commercial intelligence issue, not merely an inventory issue.
Why Is Large-Scale Product Availability Monitoring Difficult?
When a business operates across several countries, its product catalog is rarely identical everywhere. A single SKU may have different distributor coverage, regional availability, product descriptions, inventory states, and channel listings.
A practical monitoring program therefore needs to answer:
- Which SKUs are currently listed?
- Which products are unavailable?
- Which distributors still have stock?
- Which countries have assortment gaps?
- How long has an item been unavailable?
- Did availability change across multiple channels simultaneously?
- Are equivalent products available under another SKU?
- Which high-value products require immediate attention?
A simple stock-status field is not enough. Historical snapshots are required to identify the difference between a temporary website issue and a genuine stockout.
Example monitoring framework
| Monitoring dimension |
Example data point |
Business use |
| SKU |
ABC-45892 |
Product identification |
| Country |
Germany |
Geographic comparison |
| Distributor |
Distributor A |
Channel visibility |
| Availability |
Out of stock |
Exception detection |
| Lead time |
14 days |
Supply planning |
| Price |
€184.00 |
Commercial comparison |
| Product URL |
Source listing |
Verification |
| Timestamp |
2026-09-28 09:00 |
Historical tracking |
| Alternative SKU |
ABC-45893 |
Substitution analysis |
The data becomes more valuable when every observation is timestamped. A product marked “out of stock” today could return tomorrow. Without historical records, the business cannot distinguish a one-day interruption from a persistent availability problem.
How Can Businesses Build a Reliable Stock Visibility System?
A scalable system starts with a clearly defined product universe. The catalog should contain the SKUs, brands, categories, countries, distributors, and digital channels that require monitoring.
Scrape Stock in the Channel Data Guide 2026 can be structured around five essential dimensions: product identity, channel, geography, availability, and time. The objective is to create a repeatable dataset where each observation represents the condition of a specific product in a specific market and channel.
For businesses attempting to Prevent stockouts, the dataset should go beyond a binary "in stock/out of stock" field. Useful signals include low-stock indicators, backorder messages, estimated delivery dates, replenishment notices, minimum order quantities, and alternative product recommendations where publicly displayed.
Recommended stock fields
| Field |
Why it matters |
| SKU |
Links observations to the product |
| Product name |
Human-readable identification |
| Brand |
Supports brand-level analysis |
| Distributor |
Identifies channel coverage |
| Country |
Enables market comparison |
| Stock status |
Identifies availability |
| Quantity indicator |
Shows potential inventory depth where available |
| Lead time |
Indicates fulfillment constraints |
| Delivery estimate |
Adds customer-facing availability context |
| Timestamp |
Creates historical visibility |
| Source URL |
Enables verification |
2020–2026 development
Between 2020 and 2026, digital commerce became more deeply embedded in manufacturing and distribution. Digital Commerce 360 reported that U.S. manufacturing and distribution e-commerce sales were expected to reach $2.61 trillion in 2024 and that e-commerce would account for about 16% of manufacturing and distribution sales. (Digital Commerce 360)
The same period also exposed the operational importance of product availability. Supply disruptions during the early 2020s made online availability signals more relevant to procurement teams and buyers. By 2024, Digital Commerce 360 reported that 66% of manufacturers surveyed planned to invest in customer portals, while 70% planned to invest in AI for operations. (Digital Commerce 360)
For a modern B2B organization, the implication is clear: availability monitoring should be automated and historical. A scalable workflow can check defined product sources at scheduled intervals, normalize the results, identify status changes, and send exceptions to the appropriate team. This reduces the dependency on employees repeatedly checking distributor pages and provides a consistent evidence trail for stock investigations.
How Does Channel-Level Monitoring Help B2B Sellers Respond Faster?
A manufacturer may have inventory available through one distributor while another distributor shows an unavailable product. If teams only monitor their own website, they may miss important channel-level differences.
B2B brands monitor stock in channel to understand whether products remain discoverable and purchasable across their distribution network. This creates a broader perspective than internal inventory management because the focus is on the customer-facing digital channel.
The concept behind Retailers Use Scraped Data to Beat Stockouts can also be applied to B2B distribution environments: recurring external availability observations can identify product gaps that internal systems may not reveal.
Channel comparison example
| SKU |
Country |
Channel A |
Channel B |
Channel C |
| SKU-1001 |
US |
In stock |
In stock |
Out of stock |
| SKU-1002 |
UK |
Out of stock |
In stock |
In stock |
| SKU-1003 |
France |
Out of stock |
Out of stock |
Out of stock |
| SKU-1004 |
Germany |
In stock |
Low stock |
In stock |
This dataset helps teams prioritize attention. SKU-1003 represents a broader availability issue than SKU-1001, where only one channel is unavailable.
2020–2026 development
The rise of digital B2B buying has made channel visibility increasingly important. Digital Commerce 360 reported that B2B digital sales through e-commerce sites, password-protected sites, and apps grew 17% in 2023 to approximately $2.1 trillion. (Digital Commerce 360)
In 2024, the organization also reported that digital commerce was becoming an important growth mechanism for manufacturers and distributors as business buyers increasingly used digital channels. (Digital Commerce 360)
This creates a practical requirement for availability intelligence. If buyers increasingly discover and purchase industrial products online, an unavailable listing can affect both immediate conversion and future product consideration. Monitoring therefore needs to include multiple distributors and marketplaces where the company's products are visible.
A strong workflow should classify availability events rather than simply count unavailable products. A distributor outage, discontinued SKU, regional restriction, temporary stockout, and website error should not automatically receive the same business priority. Combining status history with product importance, country, distributor, and alternative availability creates a more useful exception-management system.
How Can Companies Scale Product Coverage Across International Markets?
Monitoring thousands of products in one country is already difficult. Monitoring hundreds of thousands of SKUs across multiple countries creates a much larger data-engineering problem.
Businesses that track 200K SKUs across multiple countries need a common schema while allowing for regional differences. The same product may have different currencies, languages, distributor names, product URLs, availability labels, packaging, and regulatory information.
This is where Assortment analytics becomes valuable. Instead of only measuring stock status, teams can analyze how much of their portfolio is visible and available in each market.
Example assortment dashboard
| Metric |
Country A |
Country B |
Country C |
Country D |
Country E |
| Total monitored SKUs |
200,000 |
200,000 |
200,000 |
200,000 |
200,000 |
| Listed SKUs |
184,000 |
176,500 |
191,000 |
168,000 |
182,400 |
| In-stock SKUs |
171,500 |
159,300 |
181,200 |
150,600 |
170,900 |
| Out-of-stock SKUs |
12,500 |
17,200 |
9,800 |
17,400 |
11,500 |
| Availability rate* |
93.2% |
90.3% |
94.9% |
89.6% |
93.7% |
Illustrative example, not reported market data.
This type of analysis lets category and channel teams identify countries where assortment coverage is materially different.
2020–2026 development
Digital Commerce 360 reported in 2024 that manufacturing and distribution businesses were increasing investment in digital commerce and transformation. Its research found that 70% of manufacturers planned to invest in AI for operations and 66% planned to invest in customer portals. (Digital Commerce 360)
Meanwhile, U.S. retail e-commerce continued expanding. The Census Bureau reported adjusted e-commerce sales of $316.1 billion in Q4 2025, representing 16.6% of total retail sales. In Q2 2026, adjusted e-commerce sales reached $340.2 billion and 17.1% of total retail sales. (Census.gov)
For global B2B brands, this reinforces the importance of designing monitoring architecture for scale. A 200K-SKU catalog should not be treated as 200K independent manual tasks. Product records can be organized into priority tiers, geographic groups, channel groups, and update frequencies. High-value or high-velocity SKUs can receive more frequent checks, while stable long-tail products can follow a lower-frequency schedule. This approach controls infrastructure costs while maintaining visibility where it matters most.
How Can Businesses Detect Distribution Gaps Before They Become Commercial Problems?
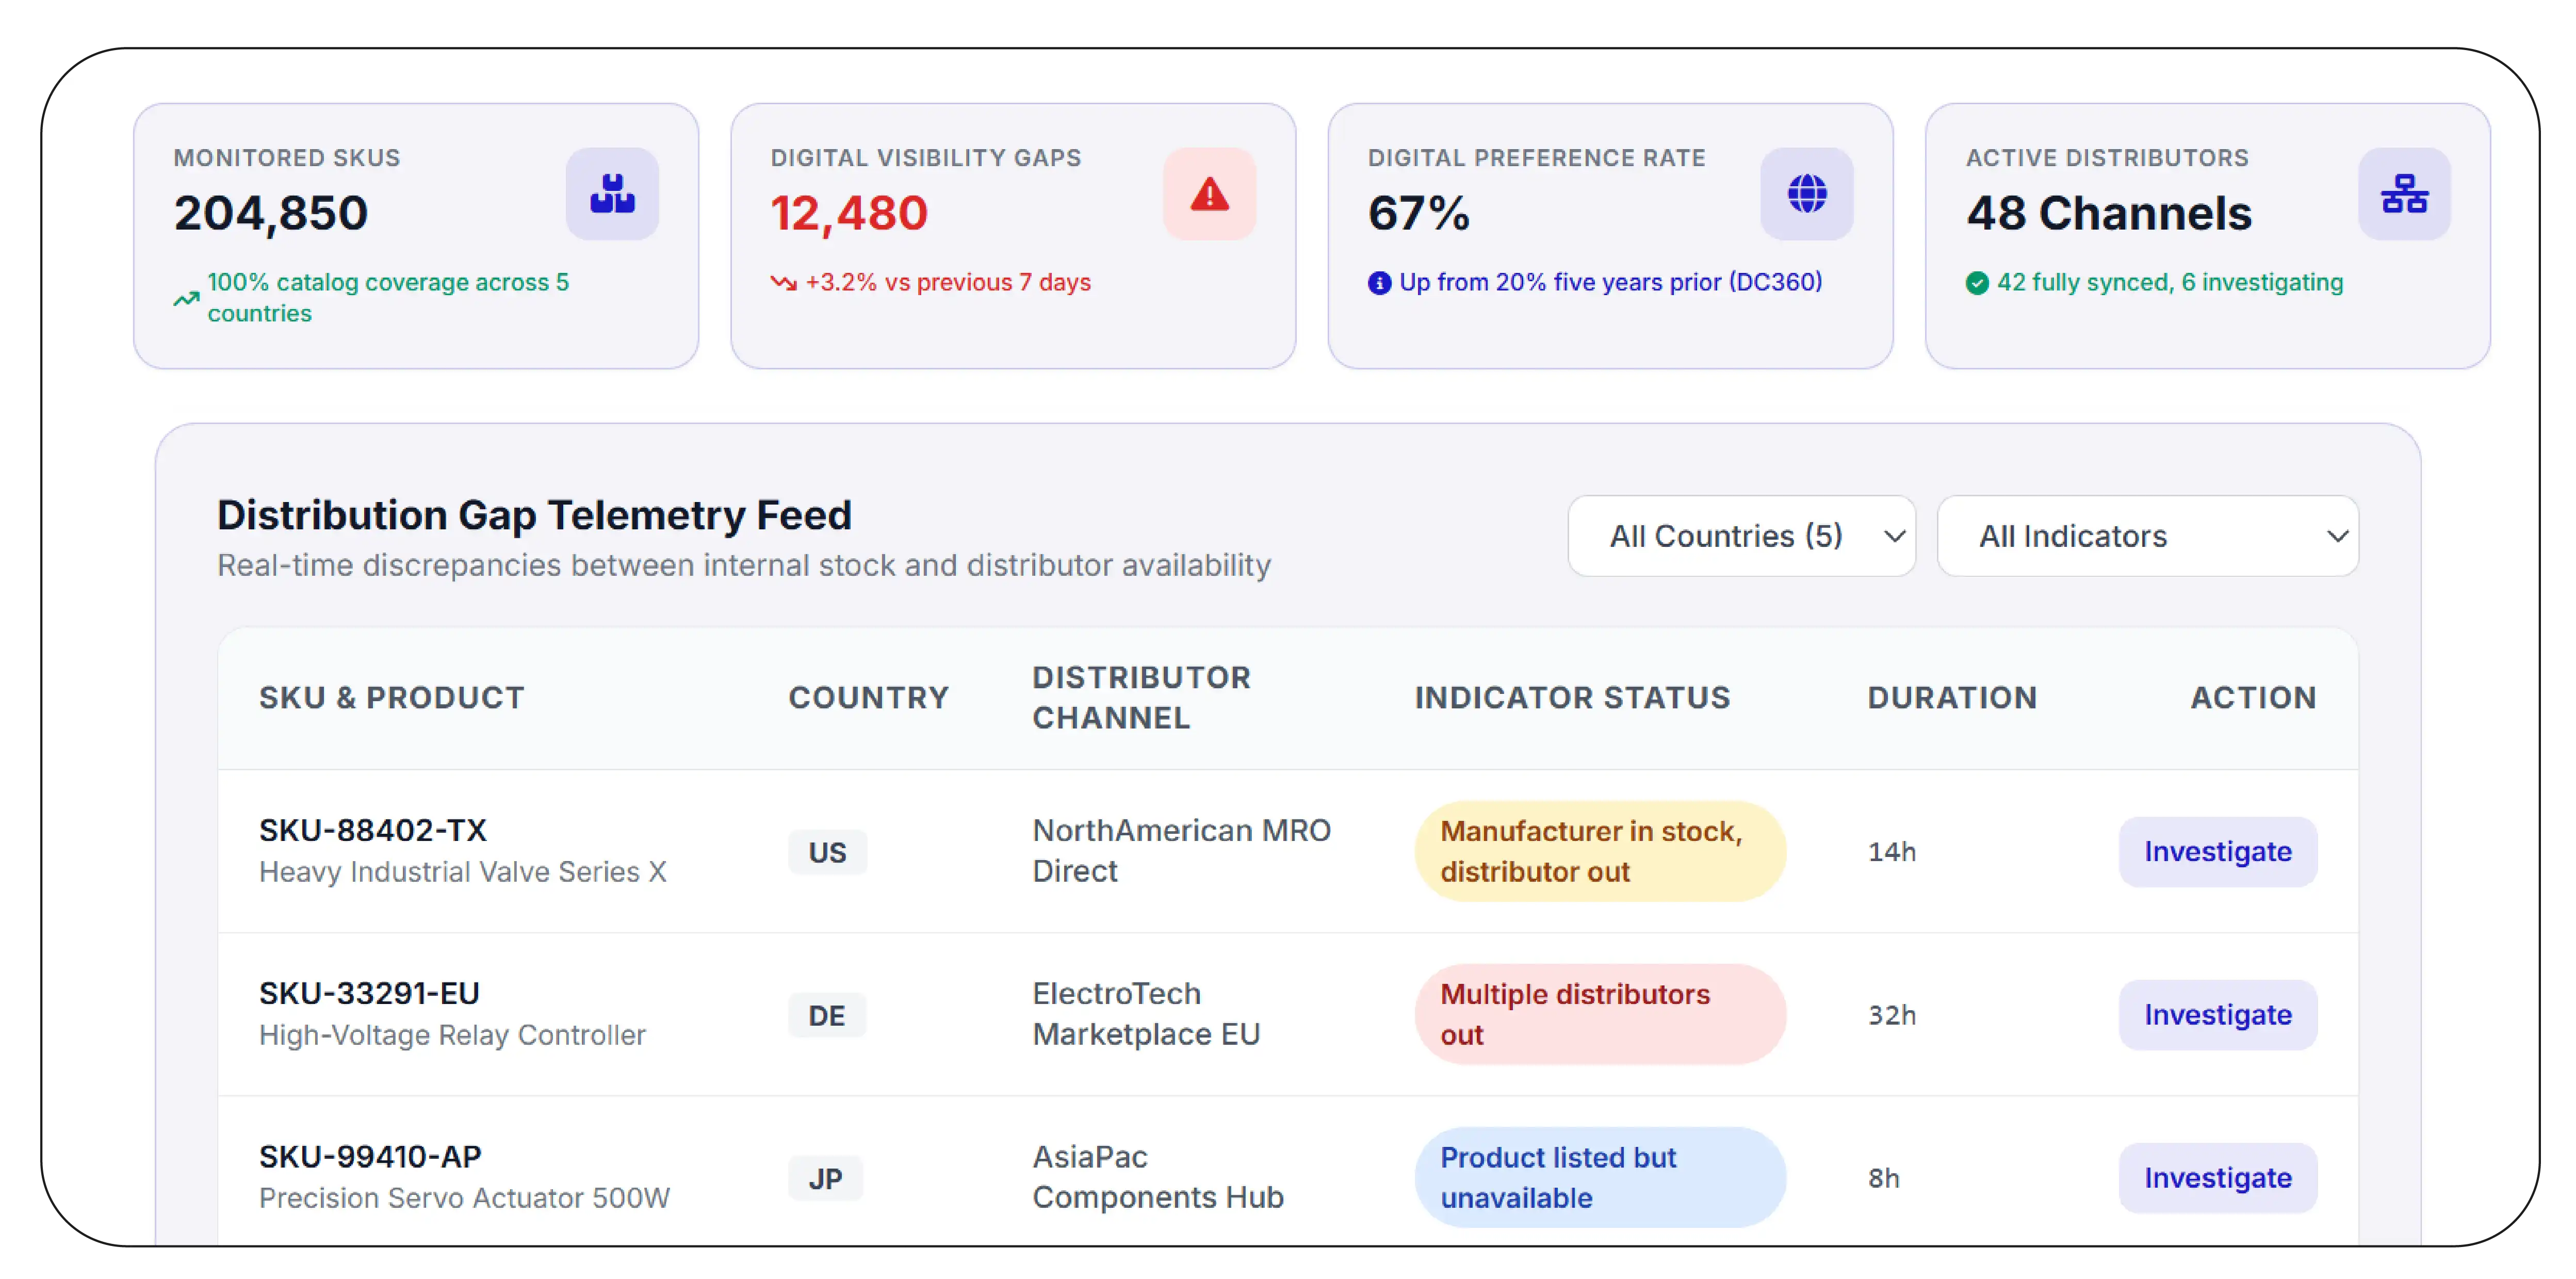
A product may be available in the manufacturer's internal system but unavailable through the distributor that customers actually use. That difference creates a digital shelf visibility gap.
To monitor stock across multiple distribution channels, companies should combine distributor-level observations with product, country, and timestamp information.
The stated use case B2B Brands Monitor 200K+ SKUs Across 5 Countries illustrates the scale at which this approach can become valuable. At this level, businesses need automation, standardized identifiers, and exception-based reporting rather than manually reviewing every listing.
Distribution-gap indicators
| Indicator |
Meaning |
Suggested action |
| Manufacturer in stock, distributor out |
Channel availability gap |
Investigate replenishment |
| Multiple distributors out |
Potential broader supply issue |
Escalate priority |
| Product listed but unavailable |
Digital visibility issue |
Review listing status |
| SKU missing entirely |
Assortment gap |
Verify catalog coverage |
| Alternative SKU available |
Potential substitution |
Surface replacement |
| Lead time increased |
Fulfillment risk |
Monitor more frequently |
2020–2026 development
Supply-chain disruption during the early 2020s highlighted the difference between having inventory somewhere in a network and having the product available to the buyer through a specific purchasing channel. As B2B commerce shifted toward digital interactions, distributor websites and marketplaces became increasingly important customer touchpoints.
Digital Commerce 360 reported that around 67% of industrial companies preferred digital interactions and purchases in 2024, compared with approximately 20% five years earlier. (Digital Commerce 360)
That transition changes the meaning of stock visibility. Availability is no longer purely an internal warehouse metric. It is also a customer-facing digital signal.
A monitoring system can therefore calculate channel coverage, country coverage, distributor availability, and duration of unavailability. Historical records can identify recurring issues with particular distributors or product categories. If a specific group of SKUs repeatedly becomes unavailable on one channel while remaining available elsewhere, the pattern can be escalated for commercial or operational investigation.
The important principle is to separate observation from interpretation. The dataset should report what the channel displayed, when it displayed it, and how long the status persisted. Business teams can then combine those facts with ERP, warehouse, sales, and fulfillment information before deciding on corrective action.
How Can High-Volume Catalogs Be Managed Without Losing SKU-Level Detail?
Large catalogs create a common problem: businesses often choose between detailed monitoring and operational simplicity. A high-level dashboard may show that 8% of products are unavailable, but it does not reveal which products, markets, or distributors account for that number.
When B2B brands monitor hundreds of thousands of SKUs, the data architecture should preserve SKU-level detail while presenting aggregated business metrics.
Useful hierarchy
Level 1 — Global:
Total monitored products, total unavailable products, overall availability rate.
Level 2 — Country:
Availability by country, category, distributor, and product family.
Level 3 — Channel:
Availability by distributor, marketplace, dealer, or digital storefront.
Level 4 — Product:
Individual SKU status, price, lead time, and timestamp.
Level 5 — Event:
Specific status changes and duration.
This hierarchy allows executives to see the overall picture while analysts can investigate individual SKUs.
2020–2026 development
Digital transformation accelerated across manufacturing and distribution during this period. Digital Commerce 360 reported that 66% of surveyed manufacturers expected sales growth in 2024 and 2025, while 70% planned AI investment for operations. (Digital Commerce 360)
B2B e-commerce also became a larger component of manufacturing and distribution sales. Digital Commerce 360 estimated that B2B e-commerce would represent approximately 16% of manufacturing and distribution sales in 2024. (Digital Commerce 360)
These developments increase the importance of structured product data. A catalog monitoring program should retain raw observations while also generating normalized fields for analysis. For example, "Available," "In Stock," "Ready to Ship," and "Ships in 2 Days" may represent different customer-facing states and should not automatically be collapsed into one value without business rules.
Similarly, a missing SKU should not immediately be interpreted as a discontinued product. It could represent a website change, regional assortment difference, temporary listing removal, or collection failure. Automated validation should flag such changes for confirmation rather than turning every anomaly into a business alert.
What Does an Automated Global Monitoring Workflow Look Like?
A large-scale monitoring program requires automation from collection through reporting. automated distributor stock monitoring can continuously capture availability signals, normalize them, compare new observations with historical records, and surface meaningful changes.
The use case B2B Brands Monitor 200K+ SKUs Across 5 Countries requires an architecture that can handle both scale and regional complexity.
Recommended workflow
| Stage |
Activity |
Output |
| Product universe |
Define SKUs and channels |
Monitoring list |
| Collection |
Capture source pages |
Raw records |
| Parsing |
Extract product fields |
Structured data |
| Matching |
Link equivalent products |
Unified SKU |
| Validation |
Check anomalies |
Quality-controlled records |
| Historical storage |
Preserve snapshots |
Time series |
| Analysis |
Calculate availability metrics |
Intelligence |
| Alerts |
Identify critical changes |
Action queue |
| Delivery |
Send structured output |
Dashboard/API/database |
2020–2026 development
The business environment has increasingly favored digital B2B interactions. Digital Commerce 360 reported that B2B e-commerce sales through digital channels increased 17% in 2023, reaching about $2.1 trillion, while its 2024 research projected further growth. (Digital Commerce 360)
The broader digital retail environment has also continued expanding. The U.S. Census Bureau reported that Q2 2026 adjusted e-commerce sales increased 12.2% year over year to $340.2 billion and represented 17.1% of total retail sales. (Census.gov)
For global B2B brands, automation provides a way to convert this growing digital footprint into structured operational intelligence. The workflow should support scheduled collection, retries, duplicate detection, schema validation, country-specific configurations, and historical comparisons.
Most importantly, alerts should be based on business rules rather than every change. A low-priority SKU going out of stock for a few hours may require no intervention. A high-revenue product disappearing from three major distributors may require immediate investigation.
A mature system can therefore score events using factors such as SKU importance, duration, number of affected channels, geographic scope, and availability of alternative products. These scores should guide internal workflows rather than replace human commercial or supply-chain judgment.
Why Choose Product Data Scrape?
A large-scale product monitoring program needs reliable collection, normalization, validation, and delivery. Product Data Scrape can support recurring product and distributor data workflows designed around a company's defined SKU universe and monitoring requirements.
The process can incorporate product identifiers, distributor information, country-level records, availability signals, pricing, lead times, product URLs, and timestamps. Historical snapshots make it possible to distinguish temporary changes from persistent availability gaps.
Stockout Monitoring can be structured around exception-based reporting so sales, supply-chain, category, and channel teams focus on meaningful changes rather than manually reviewing thousands of pages.
For multinational businesses, the workflow can also be segmented by country, channel, category, product priority, and update frequency. This creates a scalable foundation for product visibility while preserving SKU-level evidence for deeper analysis.
Conclusion
Global B2B product visibility requires more than knowing what exists in an internal catalog. Businesses need to understand how products appear, perform, and remain available across distributors, countries, and digital channels. This is particularly important for industrial B2B & MRO data, where large assortments and specialized products can make manual monitoring impractical.
A structured approach combines SKU-level identification, recurring collection, availability tracking, historical snapshots, validation, and exception reporting. It can help commercial teams identify channel gaps, supply teams investigate persistent availability issues, and product teams understand assortment differences.
The result is a more consistent factual view of digital product availability across markets.
Work with Product Data Scrape to build a scalable monitoring workflow for your global SKU catalog, distributors, countries, and digital channels!
FAQs
1. How does large-scale SKU monitoring work?
It combines automated collection, SKU matching, availability extraction, validation, historical storage, and reporting to track product visibility across multiple countries and distribution channels.
2. Why is stock monitoring important for B2B brands?
It helps identify unavailable products, distributor gaps, recurring stock issues, and assortment differences that can affect digital product visibility and customer purchasing opportunities.
3. What data should a distributor monitoring dataset contain?
Core fields include SKU, product name, distributor, country, availability, lead time, price, product URL, timestamp, and relevant stock or delivery indicators.
4. Can Product Data Scrape monitor hundreds of thousands of products?
Yes. Product Data Scrape can support structured, recurring collection workflows designed around large SKU catalogs, multiple markets, distributors, and defined business rules.
5. How frequently should B2B product availability be checked?
Frequency depends on product velocity and business importance. High-priority SKUs can be checked more often, while stable long-tail products can follow scheduled lower-frequency monitoring.


 Singapore
 EMAIL
EMAIL
 PHONE
PHONE


.webp "thumb")













.webp)






