Introduction
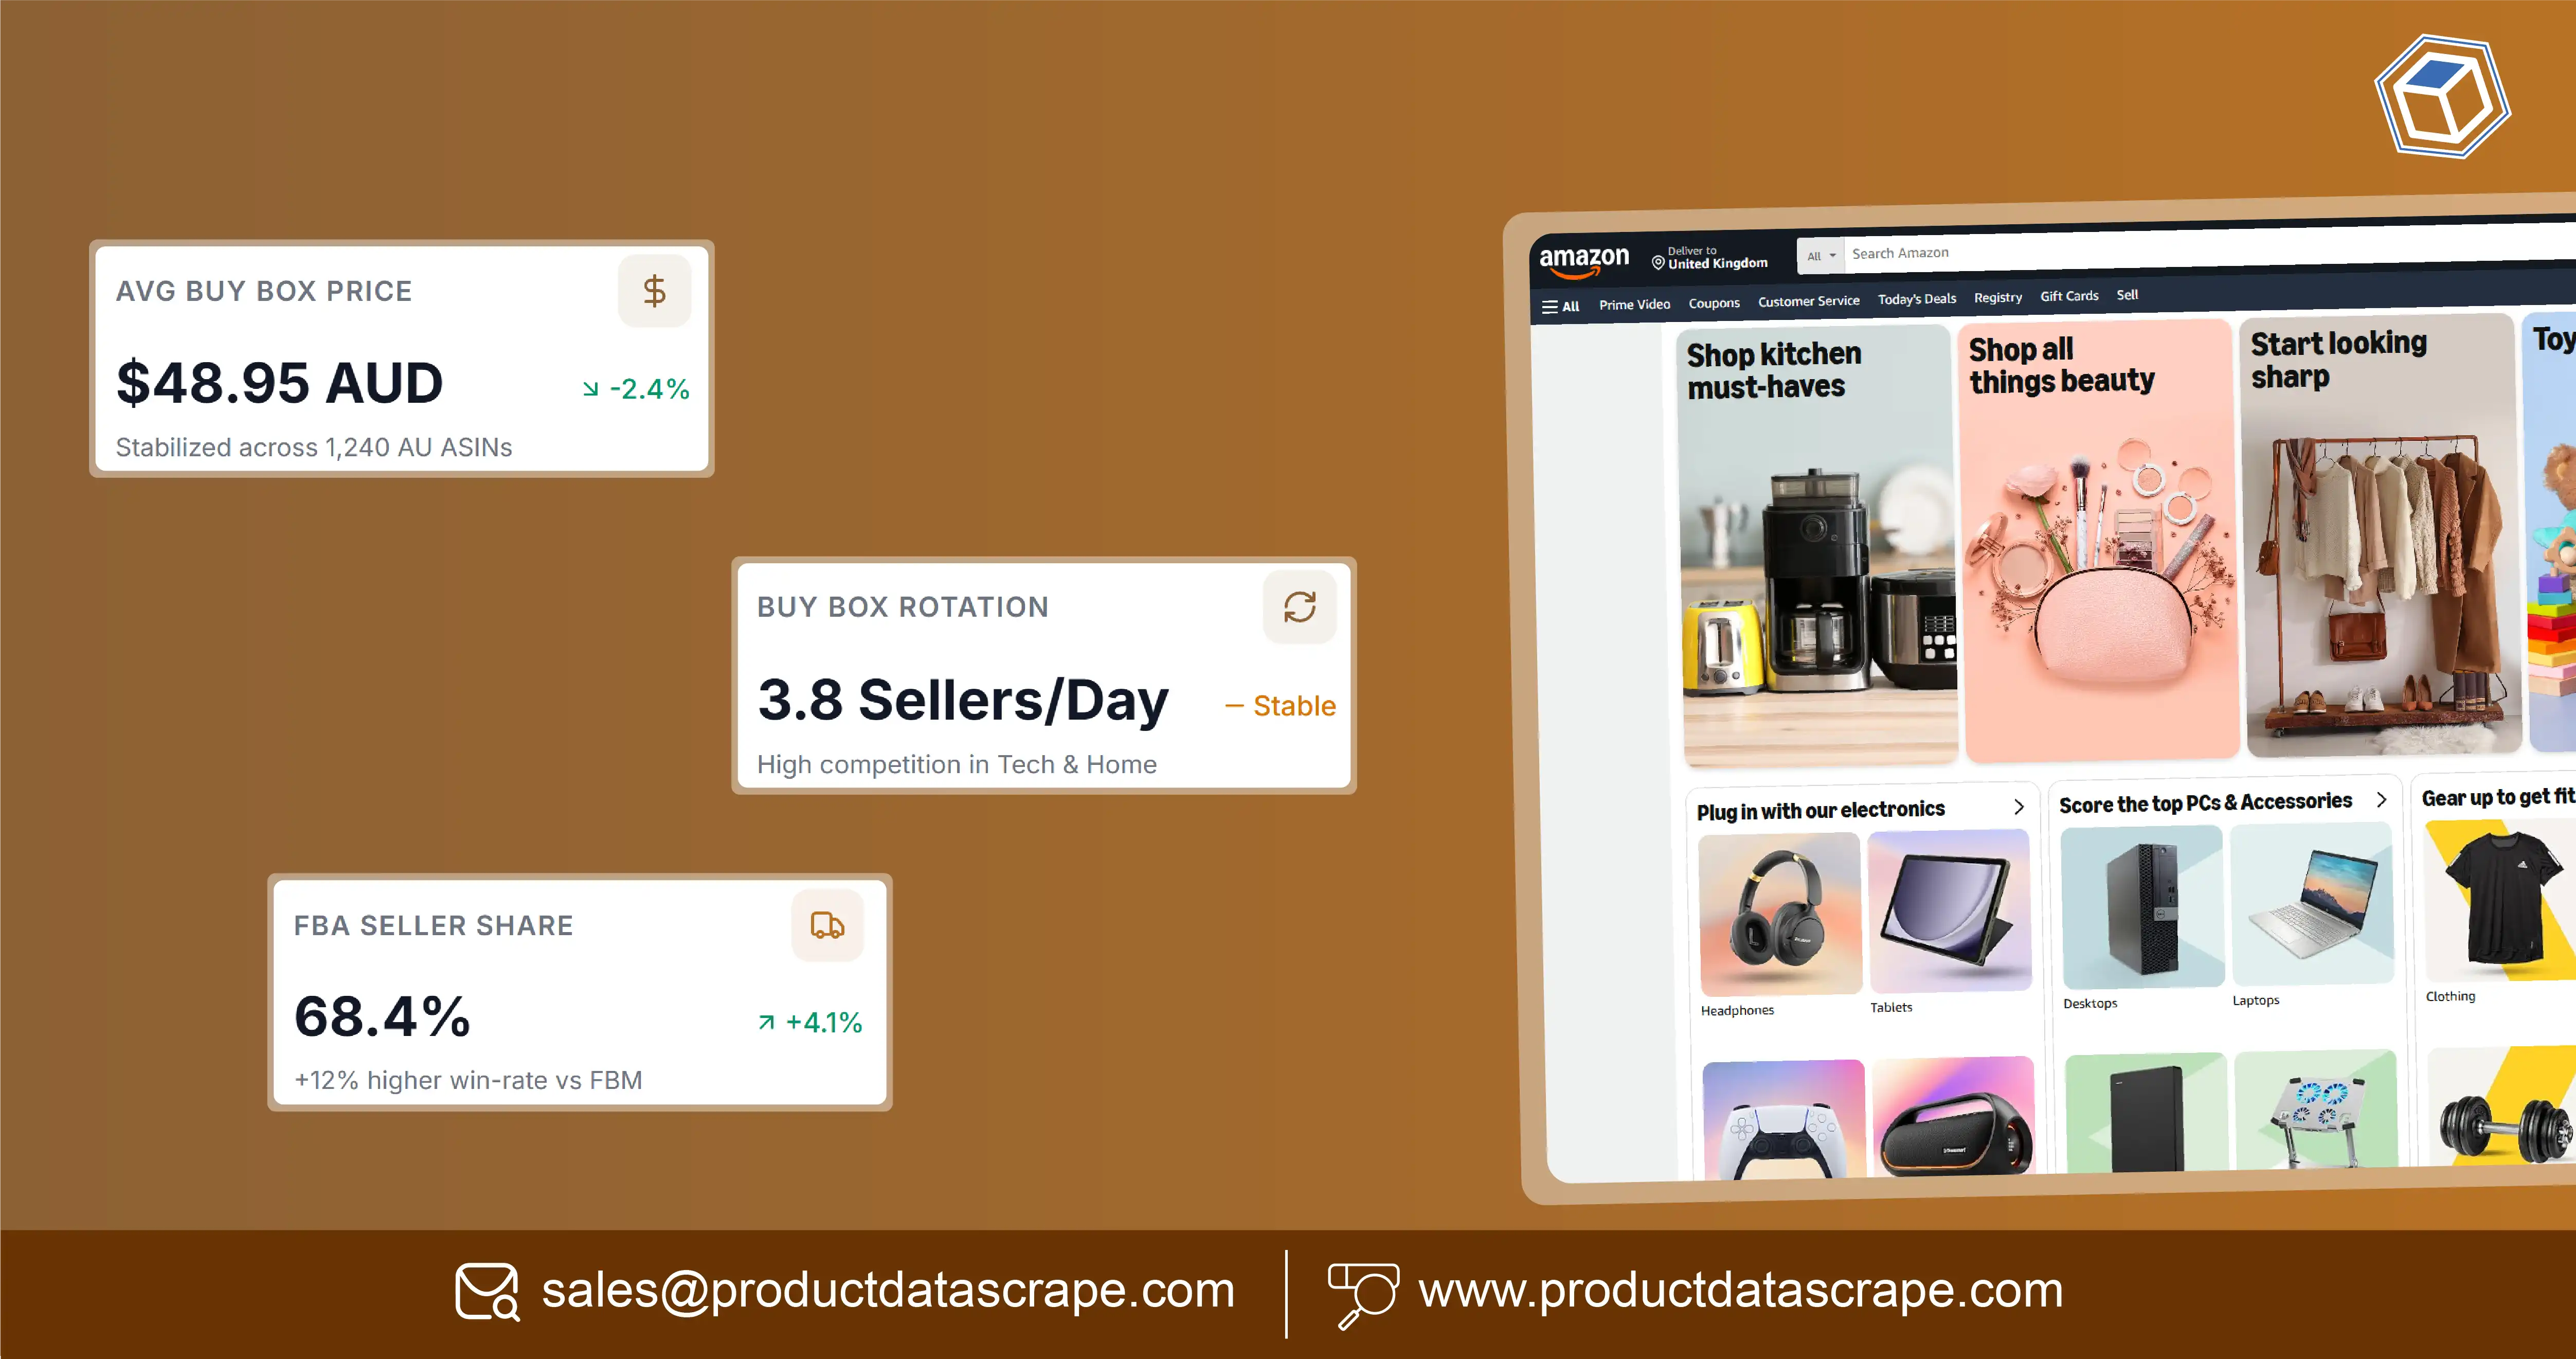
Amazon Australia sellers operate in a competitive e-commerce market where prices, featured offers, seller participation, and fulfillment options influence product positioning. Amazon Australia ASINs Data scraping helps businesses collect structured listing information to monitor these changes and investigate competitor activity. Combining Scraping the Buy Box data with product prices, seller identifiers, and fulfillment indicators creates a useful foundation for analyzing Historical Buy Box & FBA Seller Data.
Australia's online retail market demonstrates why this analysis matters. Australia Post reported that Australians spent A$50.46 billion online in 2020, up 57% year over year. Its 2022 report recorded A$62.3 billion in online spending on physical goods in 2021, while its 2023 report recorded A$63.8 billion for 2022. Subsequent reports recorded A$63.6 billion for 2023 and A$69 billion for 2024. The latest 2026 report states that total online spending reached A$82.6 billion in 2025. These figures reflect broader Australian e-commerce activity, not Amazon Australia sales alone.
For marketplace sellers, the practical challenge is converting frequently changing listing information into reliable historical records. A structured dataset can help identify price movements, review seller changes, compare visible fulfillment options, and prioritize listings that need attention. It also provides a clearer evidence trail for pricing decisions and competitor research.
How can historical listing records reveal competitive changes?

Historical buy box data for Amazon Australia ASINs helps sellers understand how featured offers change across products and observation periods. A current listing shows what is visible at one moment, whereas historical records allow analysts to compare the featured offer, seller details, displayed price, and fulfillment indicators across multiple observations.
This distinction is important for businesses managing hundreds or thousands of ASINs. Manual checks may reveal that a competitor has a lower price today, but they cannot reliably establish how often that competitor has held the featured offer over previous weeks. Historical records make it possible to investigate recurring patterns and identify products that deserve closer monitoring.
Amazon Price Monitoring complements this process by recording price movements alongside changes in visible seller information. For example, a seller may observe a price reduction at approximately the same time that the featured offer changes. That relationship is worth investigating, but it does not prove that price alone caused the change. Availability, fulfillment, delivery promises, offer eligibility, and other marketplace factors may also be relevant.
Australia Post reported that online spending on physical goods reached A$50.46 billion in 2020, a 57% year-over-year increase. In 2021, the figure reached A$62.3 billion, up 23.4% from 2020. These real market figures demonstrate the scale and rapid development of online retail during that period, although they do not establish Amazon-specific Buy Box trends.
For practical analysis, businesses should capture the ASIN, observation timestamp, featured offer price, seller identifier, visible competing offers, fulfillment information, and availability. They should also document missing observations and changes in collection frequency so that gaps are not mistaken for stable pricing or seller ownership.
What can businesses learn by comparing offer history?
Businesses that track buy box history on Amazon.com.au can compare visible offer changes across products and time periods. The objective is to understand how listings behave, identify recurring competitor activity, and investigate changes that could affect pricing or product positioning.
E-commerce data scraping can support this process by collecting structured listing observations for comparison. A well-organized dataset can include timestamps, ASINs, displayed prices, seller identifiers, visible fulfillment methods, availability, and the number of competing offers. Analysts can use these fields to examine whether price movements coincide with seller changes or stock availability.
Australia Post's 2023 report found that Australians spent A$63.8 billion on online goods in 2022, with 9.4 million households shopping online. Its 2024 report subsequently recorded A$63.6 billion in online goods spending in 2023, while 9.5 million households made an online purchase. The reports indicate that online retail remained a substantial market even as annual spending moved slightly lower between those reporting periods.
These national statistics are useful context for e-commerce planning, but they should not be used as a substitute for listing-level Amazon data. They do not show which seller held a particular Buy Box, how many Amazon sellers used Fulfilment by Amazon (FBA), or how often a specific ASIN's featured offer changed.
To make comparisons meaningful, businesses should use consistent sampling intervals and comparable product configurations. A dataset collected once a day cannot be compared directly with one collected several times an hour without accounting for the difference. Analysts should also distinguish observed changes from inferred causes and avoid assuming that every price movement affects sales performance.
How can seller-level measurements support competitor analysis?
An Amazon AU buy box percentage by seller dataset can help businesses measure the proportion of valid observations in which a particular seller's offer appeared as the featured offer. This measure can support seller comparisons, but it must be defined precisely.
A straightforward calculation is:
Observed Buy Box share = (Valid observations showing the seller as the featured offer ÷ Total valid observations) × 100
The resulting percentage represents the seller's share of the observations in the selected dataset. It is not necessarily the seller's share of actual sales, orders, revenue, or customer conversions. Amazon's offer-selection process and the way a listing is observed mean that an observation-based measure should not be presented as an official sales-share metric.
For a reliable comparison, the dataset should record the ASIN, seller identifier, timestamp, displayed price, visible fulfillment method, and whether a featured offer was present. Analysts should apply the same sampling method to each seller and product. They should also retain records where the featured offer is unavailable or cannot be identified, rather than automatically assigning ownership to another seller.
The Australian marketplace context reinforces the value of structured competitor research. Australia Post's 2025 report recorded A$69 billion in online spending during 2024, with 9.8 million households shopping online. Online marketplaces accounted for nearly A$16 billion in spending that year. These are real national marketplace figures, but they cover online marketplaces collectively rather than Amazon Australia alone.
For sellers, the practical value lies in identifying changes worth investigating. A falling observed share could coincide with additional competitors, stock availability changes, or price movements. It should prompt further analysis rather than an automatic conclusion that a seller has lost sales or become less competitive.
Why does frequent observation matter for changing listings?
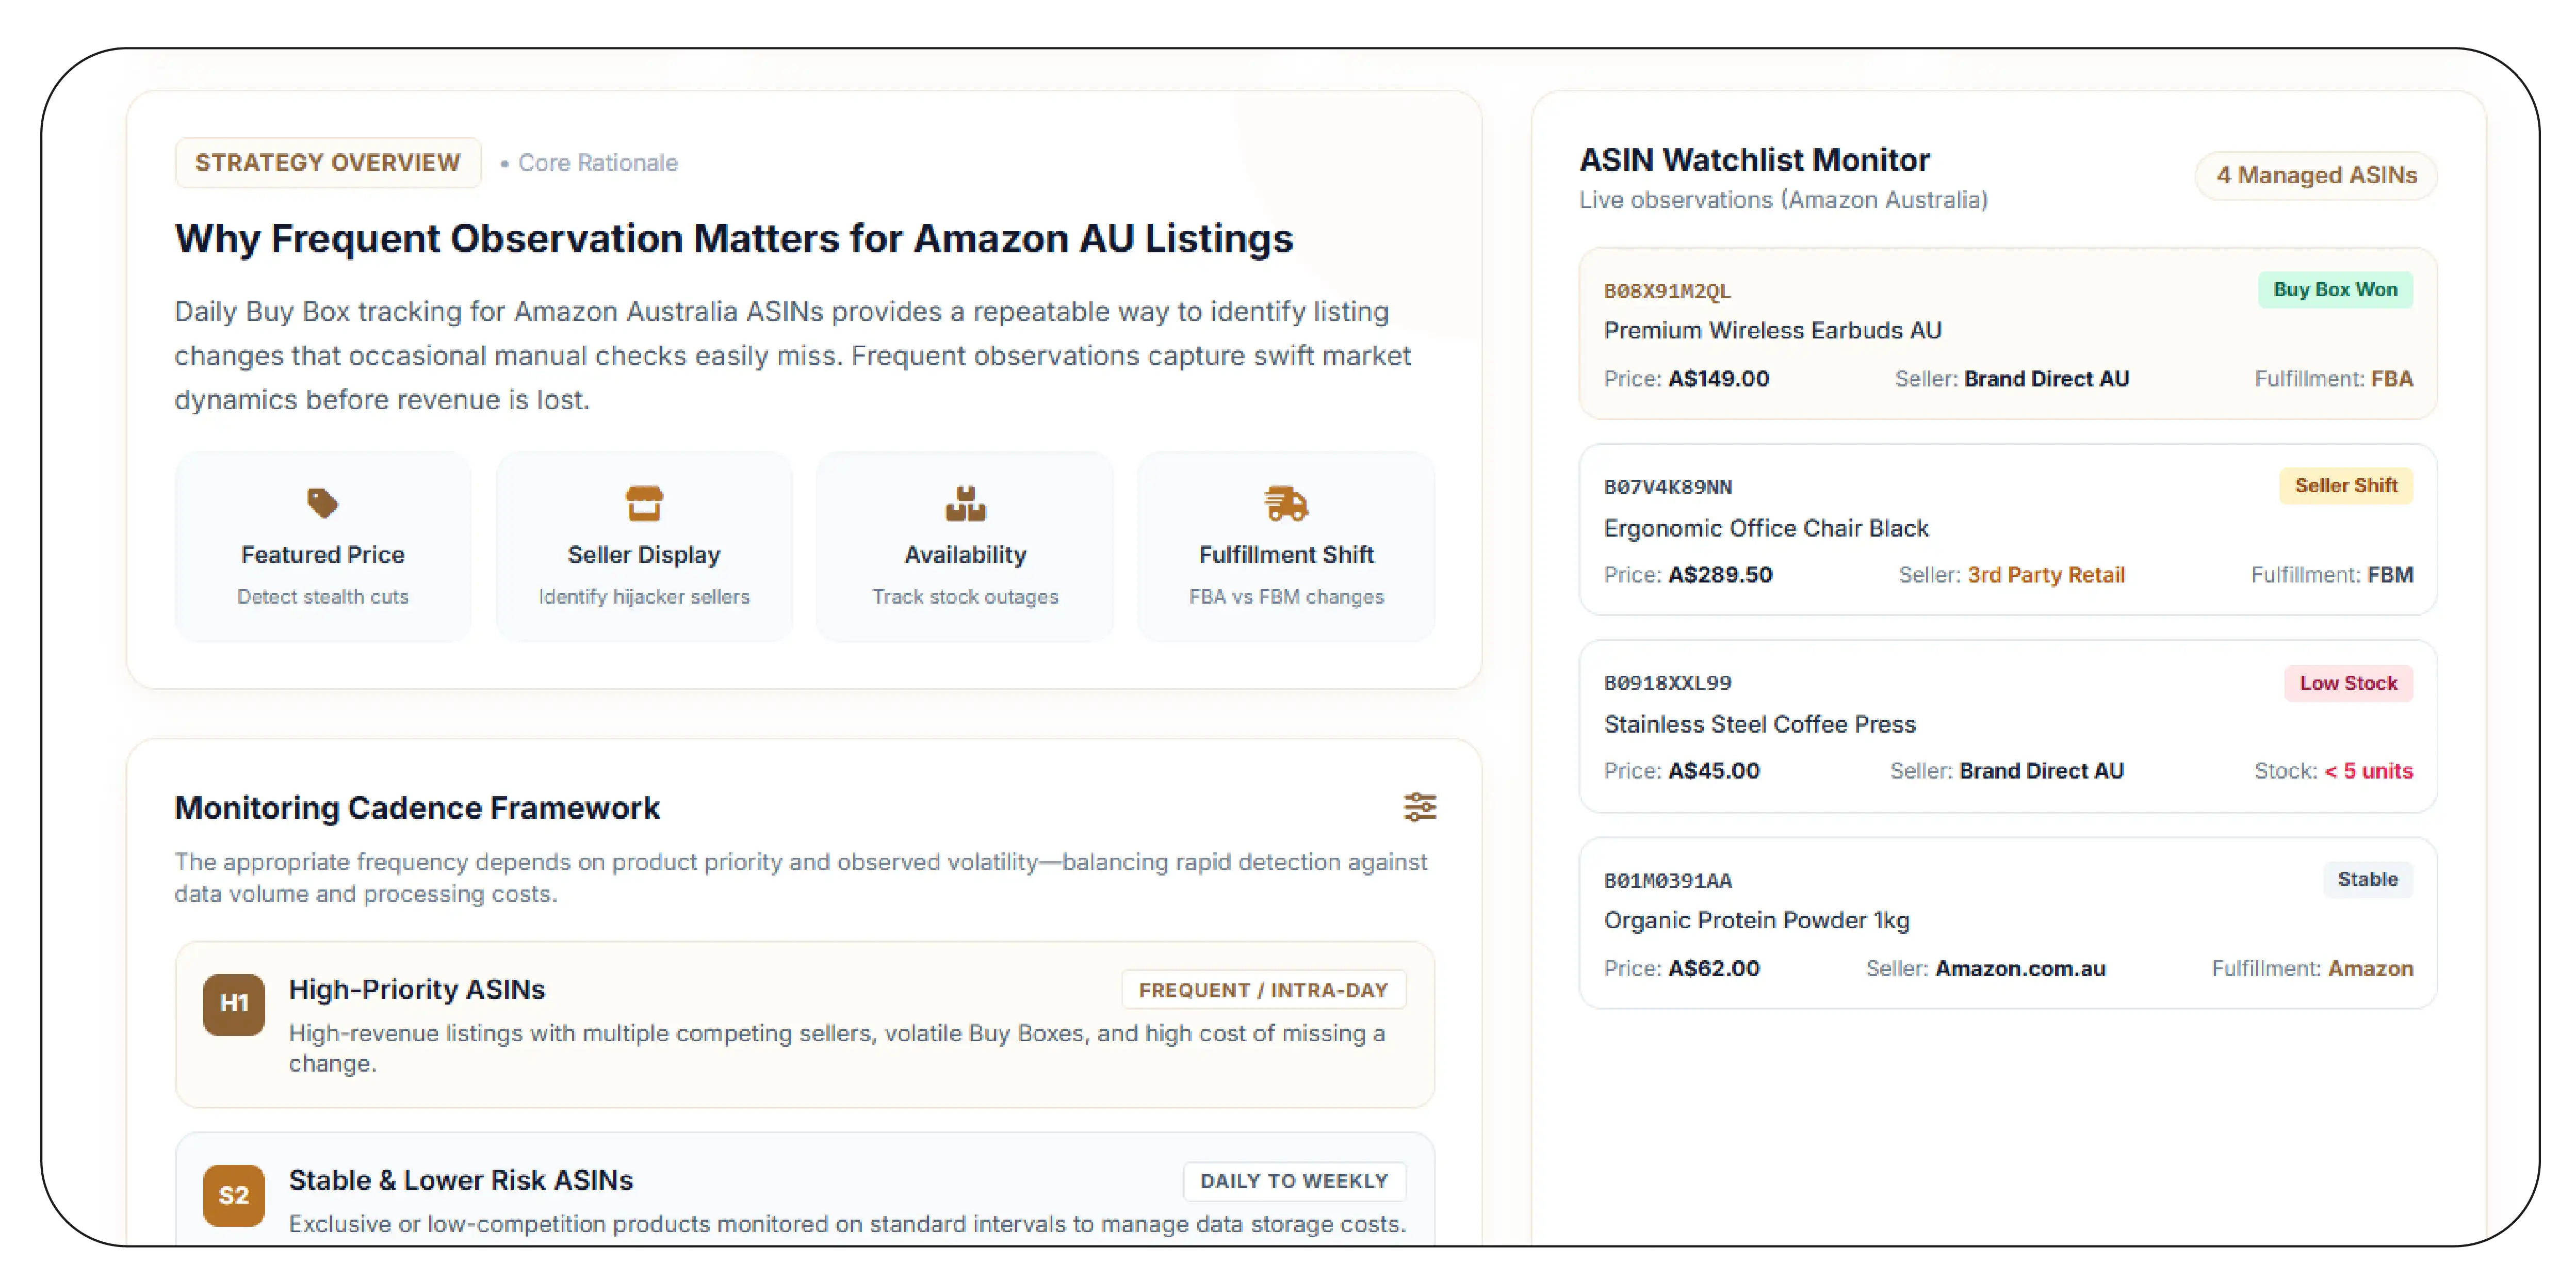
Daily buy box tracking for Amazon Australia ASINs provides a repeatable way to identify listing changes that occasional manual checks may miss. Daily observations can reveal whether the featured offer price has changed, whether a different seller is displayed, or whether availability and fulfillment information have shifted.
The appropriate monitoring frequency depends on the product and the business objective. A high-priority ASIN with multiple competing sellers may warrant more frequent checks, while a stable product may be monitored daily or weekly. More frequent observations can capture short-lived changes, but they also increase data volume and processing requirements.
Australia Post's 2025 e-commerce report recorded A$69 billion in online spending for 2024, a 12% year-over-year increase. It also reported A$2.2 billion in online spending during the Black Friday sales period in 2024, up 10% from the previous year. These figures show that online spending and promotional periods can be important considerations for retail planning, but they do not establish that every Amazon listing experiences the same seasonal pattern.
A practical monitoring workflow should prioritize products based on business importance, observed volatility, and the cost of missing a change. Teams can set alerts for meaningful price movements, changes in the featured seller, reduced offer availability, or shifts in fulfillment information. Thresholds should reflect each product's normal behavior rather than applying the same arbitrary rule to every ASIN.
Timestamp consistency is essential. Each observation should have a clearly defined timezone and collection time. Businesses should retain raw records, document interruptions, and distinguish missing observations from confirmed listing changes. These controls help ensure that reports remain useful when analysts compare performance over time.
How can businesses investigate potential pricing policy issues?
Amazon AU MAP violation monitoring helps brands and authorized distributors identify advertised prices that may require review against their minimum advertised price policies. A monitoring system can compare observed prices with the applicable product-specific threshold and flag potential discrepancies for validation.
Amazon Australia ASINs Data scraping can support this process by collecting timestamps, ASINs, displayed prices, seller identifiers, visible shipping information, and listing URLs. A separate rules engine can compare eligible observations with the relevant policy conditions. Keeping the policy version and effective date helps analysts understand which requirements applied when an observation was recorded.
Real Australian e-commerce data provides context for this work. Australia Post's 2026 report states that online spending reached A$82.6 billion in 2025, up 14% year over year, and that online marketplaces accounted for A$18.9 billion, up 13%. The report describes marketplaces collectively, including platforms such as Amazon and Temu; these figures are not measurements of Amazon Australia's individual sales or pricing compliance.
A potential price alert should not automatically be treated as a confirmed violation. Analysts should check whether the recorded offer is comparable to the product covered by the policy and whether promotions, coupons, shipping charges, bundles, or other displayed terms affect the comparison. They should also verify the seller, observation timestamp, and applicable contractual requirements.
Businesses must distinguish their own MAP policies from Amazon marketplace rules and applicable competition law. A price below a preferred threshold is not, by itself, proof of unlawful conduct or a confirmed policy breach. Appropriate legal or contractual review may be necessary before taking action.
How can long-term price records improve product decisions?
Historical Buy Box data for Amazon AU price analysis allows businesses to compare observed featured-offer prices over time instead of reacting to isolated snapshots. Analysts can review price ranges, median values, percentage changes, and the frequency of visible offer changes to identify patterns that merit further investigation.
Reliable analysis begins with comparable records. The same ASIN should represent the same product configuration, including relevant pack size or bundle details. Teams should document whether displayed prices include shipping, whether discounts are visible, and how unavailable offers are handled. Otherwise, a change in the dataset may reflect a difference in product configuration or collection method rather than a genuine price movement.
Australia's broader online spending figures illustrate why retailers benefit from tracking market conditions carefully. Australia Post recorded A$63.8 billion in online goods spending in 2022 and A$63.6 billion in 2023. Its 2025 report recorded A$69 billion for 2024, while the 2026 report records A$82.6 billion for 2025 under its reported total-online-spending measure. Because report definitions and measures may differ, these figures should be read in the context of their original reports rather than treated as a perfectly uniform series.
For Amazon-specific analysis, national spending data should be combined with actual observations from the ASINs being monitored. This allows teams to distinguish general market context from product-level evidence. Useful outputs include price histories, seller-change timelines, observed offer shares, fulfillment indicators, and records of missing data.
The resulting analysis can inform pricing reviews, competitor research, and product prioritization. It cannot guarantee future Buy Box ownership or prove why Amazon selected a particular offer. Its value is providing consistent evidence for better-informed decisions.
Why Choose Product Data Scrape?
Product Data Scrape helps businesses explore structured product-data collection workflows for marketplace research, price comparisons, and competitor monitoring. A well-planned workflow can consolidate ASIN-level observations, standardize seller and price fields, preserve timestamps, and organize records for reporting. This can reduce repetitive manual research and make large product catalogs easier to analyze.
For brands and distributors, MAP monitoring can flag displayed prices that require further review. Historical listing records can also provide context when investigating changes in offer prices, seller visibility, and fulfillment information. Businesses should define the required fields, collection frequency, data retention period, and delivery format before implementation.
The key is data quality. Consistent observation methods, transparent calculations, documented collection gaps, and validation of important alerts help teams avoid unsupported conclusions. Product-data collection should also comply with applicable access permissions, website terms, and relevant data protection requirements.
Conclusion
Historical Buy Box observations and FBA seller information can help Australian marketplace businesses understand visible offer changes, compare competitors, and investigate product-level pricing patterns. The strongest analysis combines consistent ASIN records with clear metric definitions and transparent data-quality checks. National e-commerce statistics provide valuable market context, but they cannot replace verified Amazon-specific listing observations.
E-commerce data scraping in Australia can help businesses organize marketplace information for ongoing competitor research, historical reporting, and pricing decisions. Amazon Australia ASINs Data scraping becomes more useful when each observation is traceable and the analysis distinguishes verified facts from assumptions.
Ready to strengthen your marketplace research? Contact Product Data Scrape to discuss your requirements for ASIN monitoring, historical Buy Box tracking, and FBA seller data collection!
FAQs
1. What is Amazon Australia ASIN data scraping?
It collects structured information about Amazon product listings, including ASINs, visible prices, seller details, availability, and fulfillment indicators, for marketplace research and historical analysis.
2. Can historical Buy Box data reveal actual sales?
No. Historical observations show which offer was featured when recorded. They do not independently establish order volume, revenue, conversion rates, or a seller's share of actual sales.
3. Is public historical Buy Box data available for every ASIN?
A complete, authoritative public history for every ASIN is not established by the sources reviewed. Businesses generally need their own consistent observations or a suitable data provider.
4. How often should sellers monitor Amazon Australia listings?
Frequency depends on product volatility and business needs. Daily checks can support routine monitoring, while high-priority products may require more frequent observations to capture short-lived changes.
5. How can Product Data Scrape help?
Product Data Scrape can discuss structured collection workflows for product prices, seller information, fulfillment indicators, and historical marketplace research based on specific business requirements.


 Singapore
 EMAIL
 PHONE













.webp)