Introduction
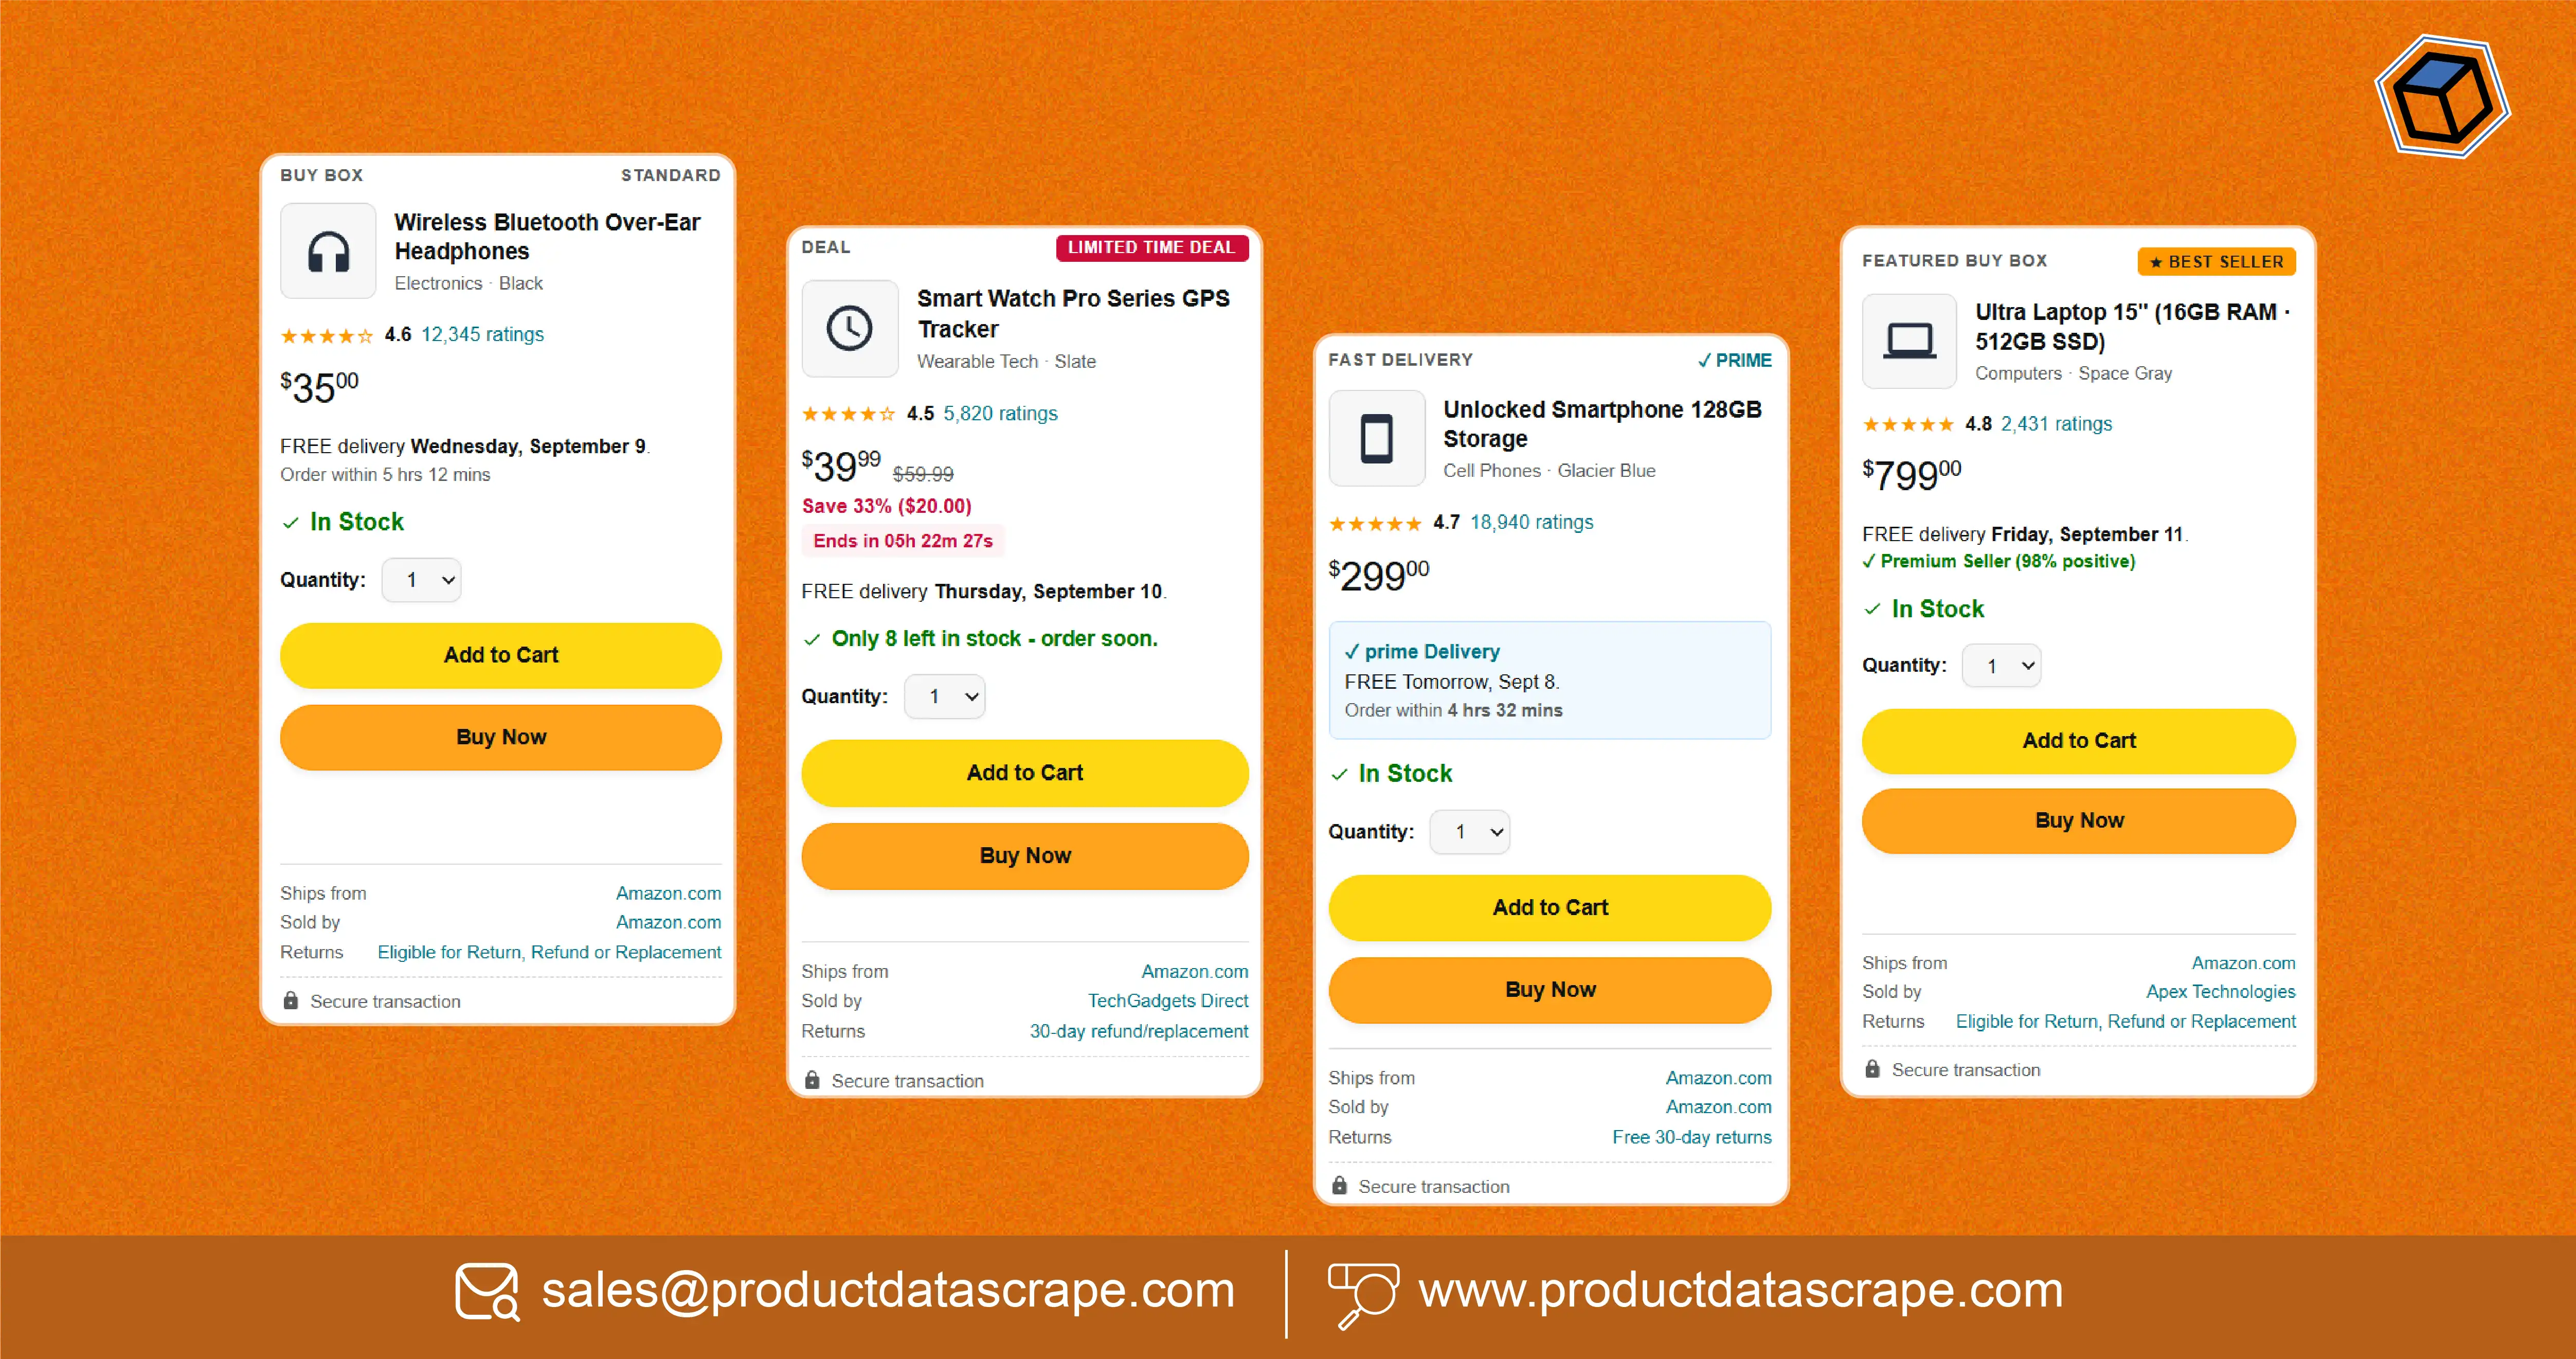
Scraping the Buy Box data for Sellers helps marketplace sellers understand who is winning the Buy Box, what prices competitors are offering, how offer availability changes, and where pricing gaps exist. This visibility allows sellers to make faster pricing, inventory, and competitive decisions instead of relying on manual marketplace checks.
For sellers operating in crowded marketplaces, the Buy Box can directly influence product visibility, conversions, and sales opportunities. Multiple sellers may offer the same product, but only one offer may receive the most prominent purchasing position at a given moment. Monitoring this competitive environment requires more than collecting a product's headline price. Sellers need structured information about offer prices, seller identity, availability, fulfillment signals, ratings, and changes over time.
The challenge is scale. A seller managing hundreds or thousands of SKUs cannot manually inspect every offer every hour. Automated marketplace data collection creates a repeatable way to monitor competitive movements and turn them into actionable seller intelligence.
This article explains how sellers can use Buy Box data to solve pricing challenges, improve offer visibility, monitor competitors, and protect market share through better-informed marketplace decisions.
Why Is Buy Box Data Important for Competitive Pricing?
The Buy Box is a highly competitive marketplace position because several sellers may compete for the same customer transaction. Price is an important variable, but it is not the only factor influencing offer positioning. Seller performance, fulfillment method, inventory availability, delivery expectations, ratings, and marketplace-specific rules can also affect competitiveness.
For pricing teams, the key challenge is determining whether a seller is losing the Buy Box because its price is uncompetitive or because another factor has changed. Historical data can help answer that question.
A useful monitoring system should capture the product identifier, Buy Box seller, current offer price, competing offer prices, seller count, availability, fulfillment information, timestamp, and relevant product attributes. Repeated collection creates a historical record that can reveal patterns instead of isolated observations.
The following table uses hypothetical illustrative data, not audited marketplace statistics, to demonstrate how a seller could structure Buy Box monitoring from 2020 to 2026.
| Year |
Illustrative Offer Monitoring Index |
Average Offers Tracked per SKU |
Price Observation Frequency |
| 2020 |
48 |
4 |
Daily |
| 2021 |
55 |
5 |
Daily |
| 2022 |
63 |
6 |
12-hour |
| 2023 |
71 |
7 |
8-hour |
| 2024 |
80 |
9 |
6-hour |
| 2025 |
89 |
11 |
4-hour |
| 2026 |
95 |
13 |
Hourly |
The purpose of these figures is to illustrate an operational trend: as monitoring becomes more frequent and comprehensive, sellers gain greater visibility into competitive changes. Businesses can then establish pricing thresholds, detect unusual movements, and investigate products where Buy Box performance deteriorates.
How Can Sellers Compare Competing Offer Prices?
Marketplace Buy Box Offer Price Analysis gives sellers a structured view of the prices competing for the same product. Instead of looking only at their own selling price, sellers can compare their offer against the current Buy Box price, other seller offers, and historical pricing patterns.
The first actionable step is to establish a comparable offer set. Product identifiers should be normalized so that sellers are not accidentally comparing different versions, pack sizes, or configurations. Once comparable offers are identified, businesses can calculate the absolute and percentage price difference between their offer and the leading offer.
For example, if a seller is consistently 6% above the leading offer but still wins the Buy Box, reducing the price may unnecessarily sacrifice margin. Conversely, if a seller loses the position whenever its price moves more than 2% above the leading offer, that relationship becomes an important pricing signal.
| Year |
Illustrative Price Gap Index |
Competitive Offers Monitored |
Exception Detection |
| 2020 |
52 |
3 |
Low |
| 2021 |
58 |
4 |
Low |
| 2022 |
65 |
5 |
Moderate |
| 2023 |
73 |
6 |
Moderate |
| 2024 |
81 |
8 |
High |
| 2025 |
89 |
10 |
High |
| 2026 |
94 |
12 |
Very High |
These figures are hypothetical and demonstrate how monitoring maturity can develop. Sellers can use the resulting dataset to identify products where they are consistently overpriced, underpriced, or operating within a competitive pricing range.
The objective should not always be to become the cheapest seller. Instead, sellers should determine the price range that supports competitiveness while protecting margin. This is where historical Buy Box data becomes more valuable than a single current price.
How Can Seller Intelligence Improve Marketplace Decisions?
Buy Box Seller Intelligence helps sellers understand the competitive structure behind a product listing. Knowing that another seller has taken the Buy Box is useful, but knowing how often that seller wins, how its price changes, and whether it maintains inventory provides much deeper insight.
Sellers can build profiles around recurring competitors. These profiles may include offer frequency, historical prices, Buy Box appearances, availability patterns, fulfillment information, ratings, and changes in seller participation. This allows businesses to distinguish between occasional competitors and sellers that consistently influence a category.
At a broader level, Marketplace selling intelligence can combine Buy Box information with catalog, seller, rating, review, and availability data. This creates a more comprehensive view of marketplace competition.
| Year |
Illustrative Seller Intelligence Index |
Seller Profiles Tracked |
Historical Coverage |
| 2020 |
45 |
100 |
3 months |
| 2021 |
53 |
180 |
6 months |
| 2022 |
62 |
300 |
9 months |
| 2023 |
71 |
500 |
12 months |
| 2024 |
80 |
800 |
18 months |
| 2025 |
89 |
1,200 |
24 months |
| 2026 |
95 |
1,800 |
30 months |
These are clearly hypothetical planning figures. Their purpose is to show how historical seller intelligence can expand from basic competitor identification into longitudinal analysis.
The practical benefit is prioritization. Sellers can identify which competitors deserve attention, which products experience frequent competitive disruption, and where pricing decisions should be reviewed first. This prevents teams from treating every seller or every SKU as equally important.
How Can Amazon Pricing Data Reveal Competitive Opportunities?
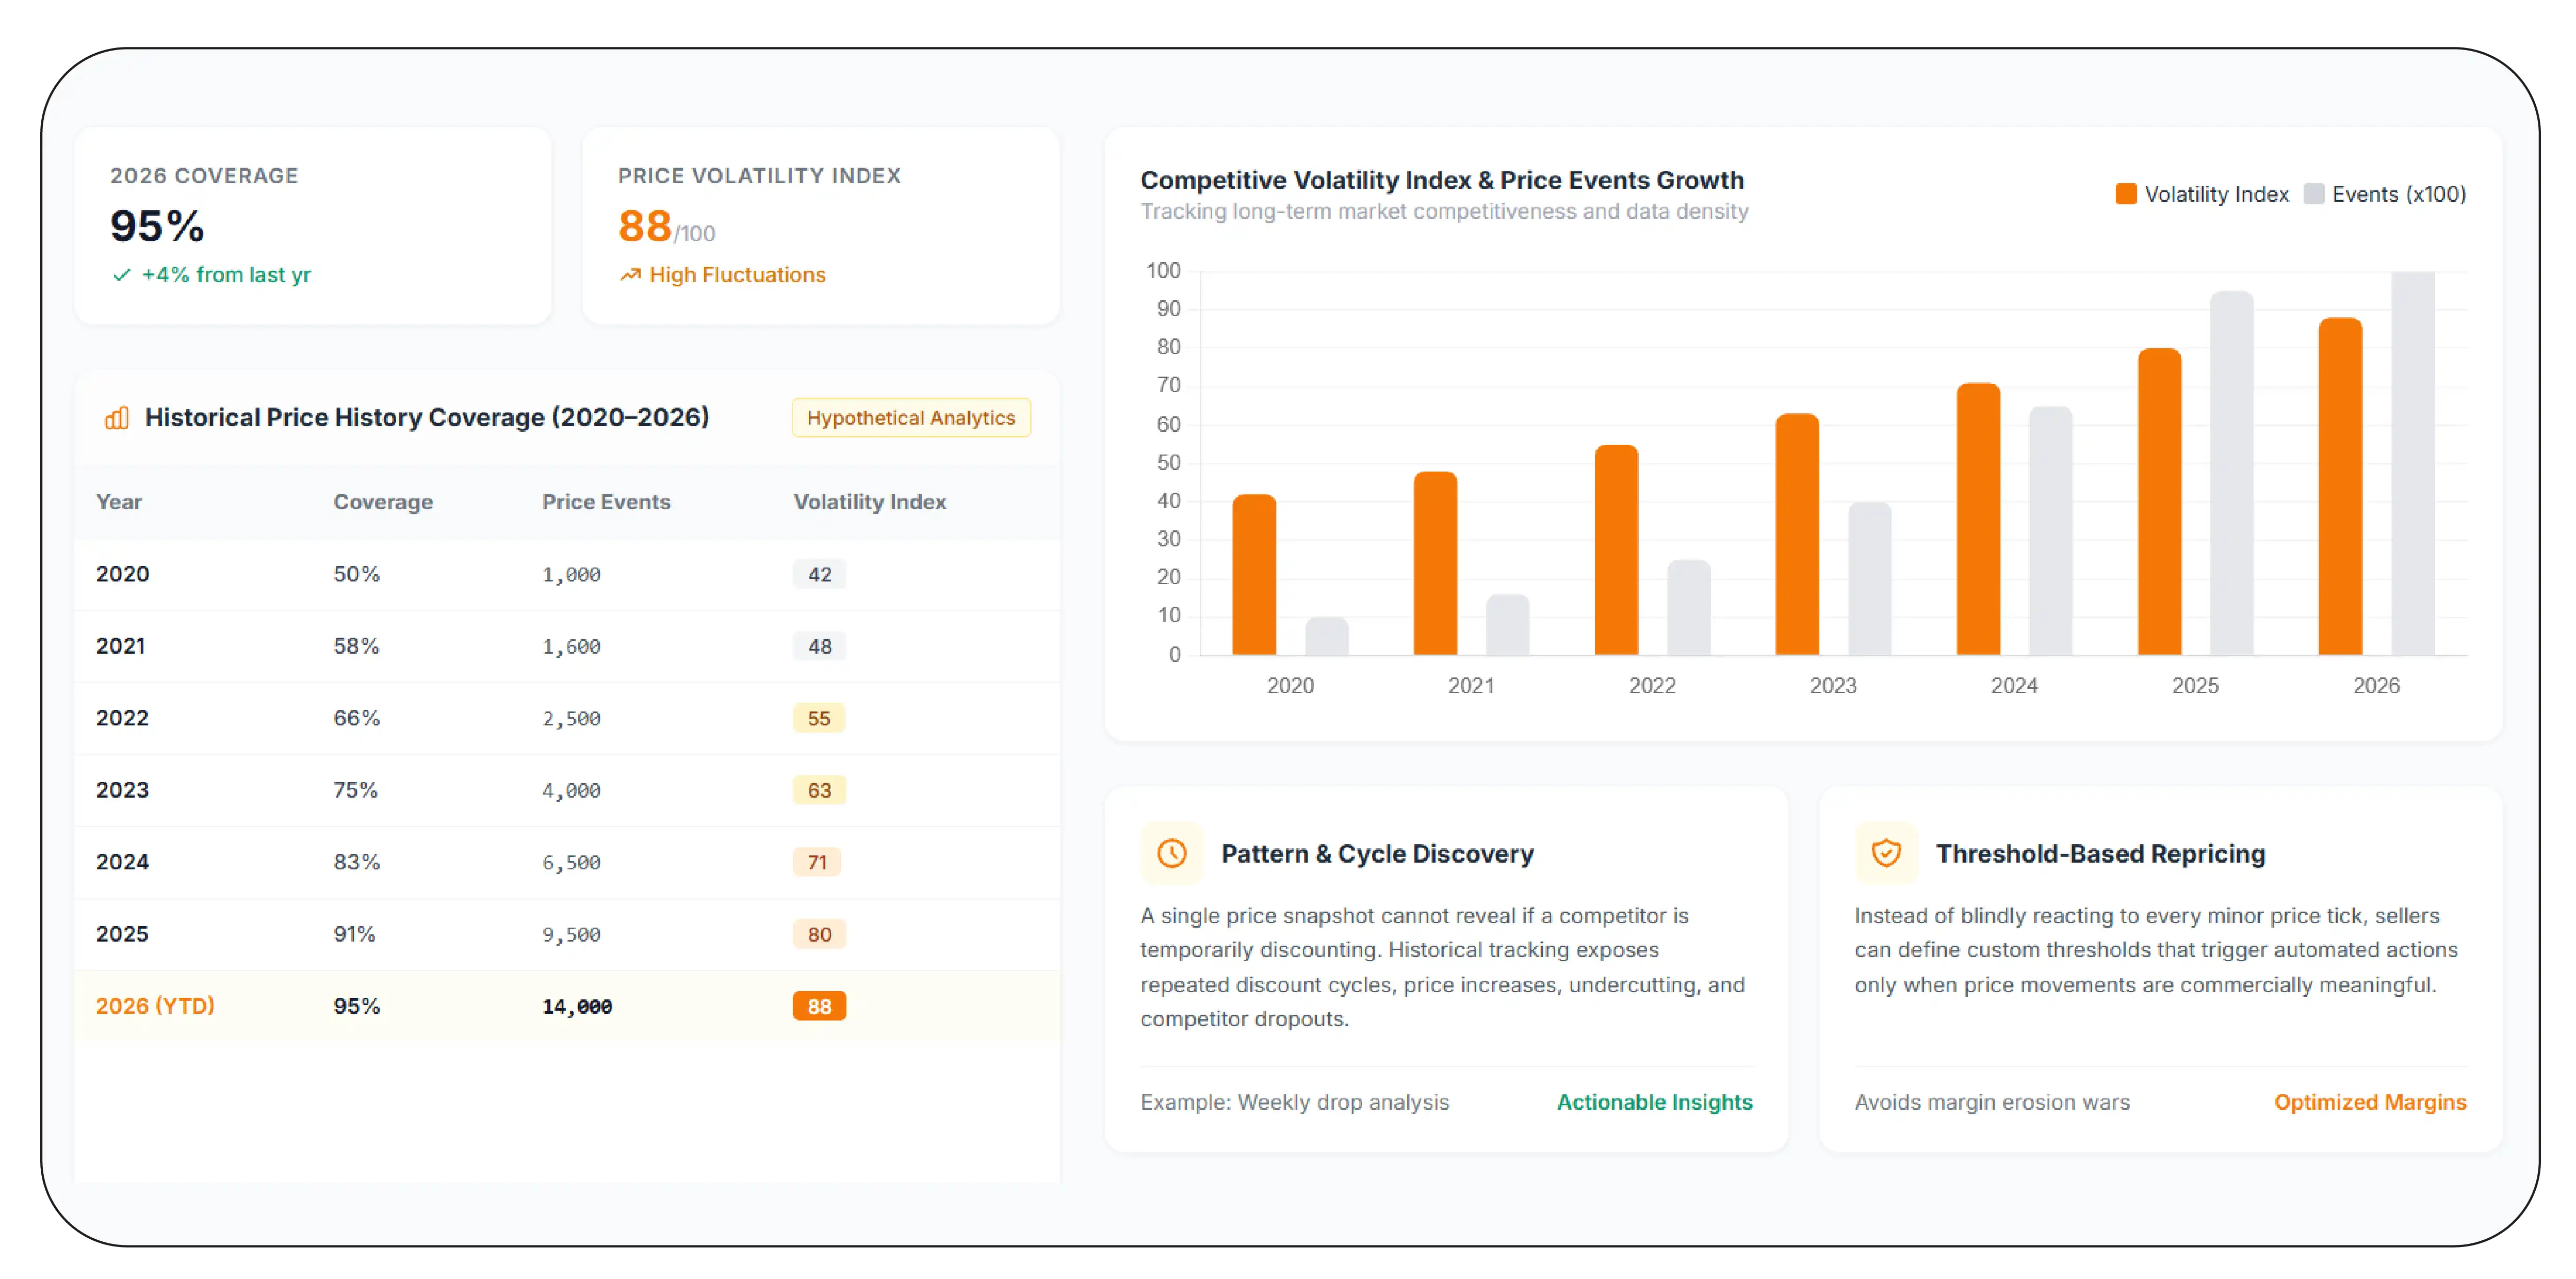
Amazon Buy Box Pricing Data can provide a detailed historical perspective on how offer prices move around individual products. For sellers, the value comes from connecting price observations with timestamps and seller information.
A single price snapshot cannot explain whether a competitor's price is temporarily discounted or part of a long-term strategy. Historical observations can reveal repeated discount cycles, price increases, price undercutting, and periods when a seller disappears from the offer set.
A useful dataset should capture the Buy Box price and competing prices at regular intervals. It can then calculate metrics such as minimum observed price, maximum observed price, median competitive price, price volatility, seller price gap, and frequency of Buy Box changes.
| Year |
Illustrative Price History Coverage |
Price Events Captured |
Competitive Volatility Index |
| 2020 |
50% |
1,000 |
42 |
| 2021 |
58% |
1,600 |
48 |
| 2022 |
66% |
2,500 |
55 |
| 2023 |
75% |
4,000 |
63 |
| 2024 |
83% |
6,500 |
71 |
| 2025 |
91% |
9,500 |
80 |
| 2026 |
95% |
14,000 |
88 |
The figures are hypothetical and intended only as an analytical illustration.
Historical price data can help sellers distinguish normal price movement from unusual competitive behavior. For instance, if a competitor repeatedly reduces its offer at the same time every week, a seller can investigate whether the pattern reflects promotions, inventory management, or another pricing strategy.
This information supports better repricing rules. Instead of reacting to every price change, sellers can define thresholds that trigger action only when a movement is commercially meaningful.
How Can Sellers Track Price Changes Without Manual Monitoring?
Buy Box Price Change Tracking turns pricing intelligence into a continuous monitoring process. Marketplace prices can change frequently, making periodic manual checks insufficient for sellers managing large catalogs.
A practical tracking system records each observation with a timestamp. When a new observation differs materially from the previous value, the system can classify the event as a price increase, decrease, Buy Box transition, seller entry, seller exit, or availability change.
This historical structure enables businesses to calculate price-change frequency and identify products with unusually high volatility.
| Year |
Illustrative Price Event Index |
Automated Change Detection |
Manual Monitoring Requirement |
| 2020 |
40 |
20% |
Very High |
| 2021 |
49 |
29% |
High |
| 2022 |
59 |
39% |
High |
| 2023 |
69 |
51% |
Moderate |
| 2024 |
79 |
64% |
Moderate-Low |
| 2025 |
89 |
78% |
Low |
| 2026 |
96 |
90% |
Very Low |
These figures are hypothetical benchmarks illustrating the potential impact of automation.
Sellers can use alerts to prioritize meaningful events. A small change of a few cents may not require intervention, while a significant competitor reduction could require immediate review. Threshold-based monitoring prevents pricing teams from being overwhelmed by insignificant changes.
The same system can support historical reporting. Teams can examine which products experienced the most price volatility, which competitors were most active, and which SKUs repeatedly lost competitive positioning.
How Can Sellers Improve Visibility Into Marketplace Offers?
Amazon Product Offer Visibility helps sellers understand the complete competitive offer environment rather than focusing exclusively on the Buy Box winner.
A product may have several sellers offering different prices, fulfillment options, shipping conditions, and availability. Monitoring the entire offer set provides context for understanding why one seller may be more competitive than another.
Offer visibility is particularly useful when the leading price does not tell the complete story. A seller may be slightly more expensive but offer faster fulfillment, stronger seller ratings, or better availability. Therefore, competitive analysis should preserve multiple offer attributes instead of reducing the marketplace to a single price.
| Year |
Illustrative Offer Visibility Index |
Offers Identified per Product |
Attribute Coverage |
| 2020 |
46 |
3 |
45% |
| 2021 |
54 |
4 |
52% |
| 2022 |
63 |
5 |
61% |
| 2023 |
72 |
6 |
70% |
| 2024 |
81 |
8 |
79% |
| 2025 |
90 |
10 |
88% |
| 2026 |
96 |
12 |
94% |
The numbers are hypothetical and illustrate the relationship between broader offer coverage and analytical depth.
Sellers can use this information to identify crowded products, monitor new competitors, compare fulfillment conditions, and prioritize SKUs with changing competitive structures. Better offer visibility also helps category managers understand whether marketplace competition is intensifying or stabilizing.
How Can Sellers Turn Buy Box Data Into Action?
the Buy Box should be viewed as a dynamic competitive environment rather than a fixed status. A seller can win the position today and lose it tomorrow because of price movement, inventory changes, fulfillment differences, seller performance, or marketplace conditions.
Scraping the Buy Box data for Sellers creates the historical visibility needed to understand these changes. Once data is collected consistently, sellers can build dashboards that show current Buy Box ownership, competitor price gaps, seller counts, offer changes, and historical trends.
| Year |
Illustrative Buy Box Intelligence Index |
Automated Alerts |
Decision Cycle |
| 2020 |
44 |
10% |
Weekly |
| 2021 |
52 |
18% |
Weekly |
| 2022 |
61 |
29% |
3–5 days |
| 2023 |
70 |
42% |
1–3 days |
| 2024 |
80 |
58% |
Daily |
| 2025 |
90 |
76% |
Same day |
| 2026 |
96 |
90% |
Near real time |
These are hypothetical figures designed to demonstrate an evolving operating model.
The most effective approach is to connect monitoring with clear business actions. A major price gap can trigger a repricing review. A sudden seller entry can trigger competitive analysis. A repeated Buy Box loss can trigger an investigation into price, fulfillment, inventory, or seller performance.
The goal is not simply to collect more marketplace data. The goal is to create a decision system where relevant changes are detected, interpreted, prioritized, and acted upon.
Why Choose Product Data Scrape?
Product Data Scrape can support sellers and brands with structured marketplace data for competitor monitoring, offer analysis, pricing intelligence, and seller research. A scalable data workflow can capture product details, prices, seller information, availability, ratings, reviews, and other marketplace signals. These datasets can be normalized and organized for dashboards, analytics platforms, pricing systems, and research workflows. Automated collection reduces dependence on manual marketplace checks and helps teams maintain historical records for trend analysis. Businesses can also define category-specific fields and monitoring frequencies according to their competitive objectives. This creates a practical foundation for pricing analysis, seller intelligence, assortment monitoring, and marketplace decision-making across large product catalogs.
Real-time price tracking allows sellers to react to meaningful competitive changes faster than periodic manual research. When pricing information is refreshed frequently, teams can identify sudden competitor reductions, new seller entries, Buy Box transitions, and unusual offer movements.
Scraping the Buy Box data for Sellers supports this workflow by providing structured observations that can feed pricing dashboards, analytics systems, alerts, and decision engines. Sellers can establish rules for when an event should trigger an action.
For example, a seller may monitor products where the competitive price falls more than a predefined percentage below its own price. Another rule could identify SKUs where the seller repeatedly loses the Buy Box despite maintaining a similar price. A third could flag products where the number of active offers increases rapidly.
The key is not maximum data frequency for every product. High-volume monitoring should be reserved for strategically important or highly volatile SKUs, while lower-priority products can be checked less frequently. This creates a cost-efficient monitoring strategy while maintaining visibility where it matters most.
Conclusion
Competitive pricing decisions become difficult when sellers cannot see how Buy Box offers change over time. Real-time price tracking provides the timely observations needed to identify price gaps, seller movements, offer changes, and competitive opportunities. Scraping the Buy Box data for Sellers turns these observations into structured intelligence that can support pricing, inventory, promotions, and marketplace strategy.
The strongest approach combines historical data, automated monitoring, seller-level analysis, and actionable alerts rather than relying on isolated price snapshots.
Work with Product Data Scrape to build scalable Buy Box data pipelines that help your team monitor competitors, improve pricing decisions, and respond faster to marketplace changes!
FAQs
1. What is Buy Box data?
Buy Box data includes information about the leading marketplace offer, competing seller prices, seller identity, availability, and related offer attributes used for competitive marketplace analysis.
2. Why should sellers monitor Buy Box prices?
Monitoring Buy Box prices helps sellers identify competitive gaps, understand price movements, detect seller changes, and make informed repricing decisions without depending entirely on manual marketplace research.
3. Can Buy Box data support repricing?
Yes. Historical and current Buy Box observations can help sellers establish competitive price thresholds, identify meaningful price gaps, and develop rules for automated or assisted repricing.
4. How can Product Data Scrape help sellers?
Product Data Scrape can provide structured marketplace datasets containing product, seller, price, availability, and offer information that businesses can use for competitive analysis and pricing intelligence.
5. How often should Buy Box data be collected?
Collection frequency depends on category volatility, catalog size, and business objectives. High-priority products may require frequent monitoring, while stable products can be checked at longer intervals.


 Singapore
 EMAIL
EMAIL
 PHONE
PHONE
















.webp)






