Introduction
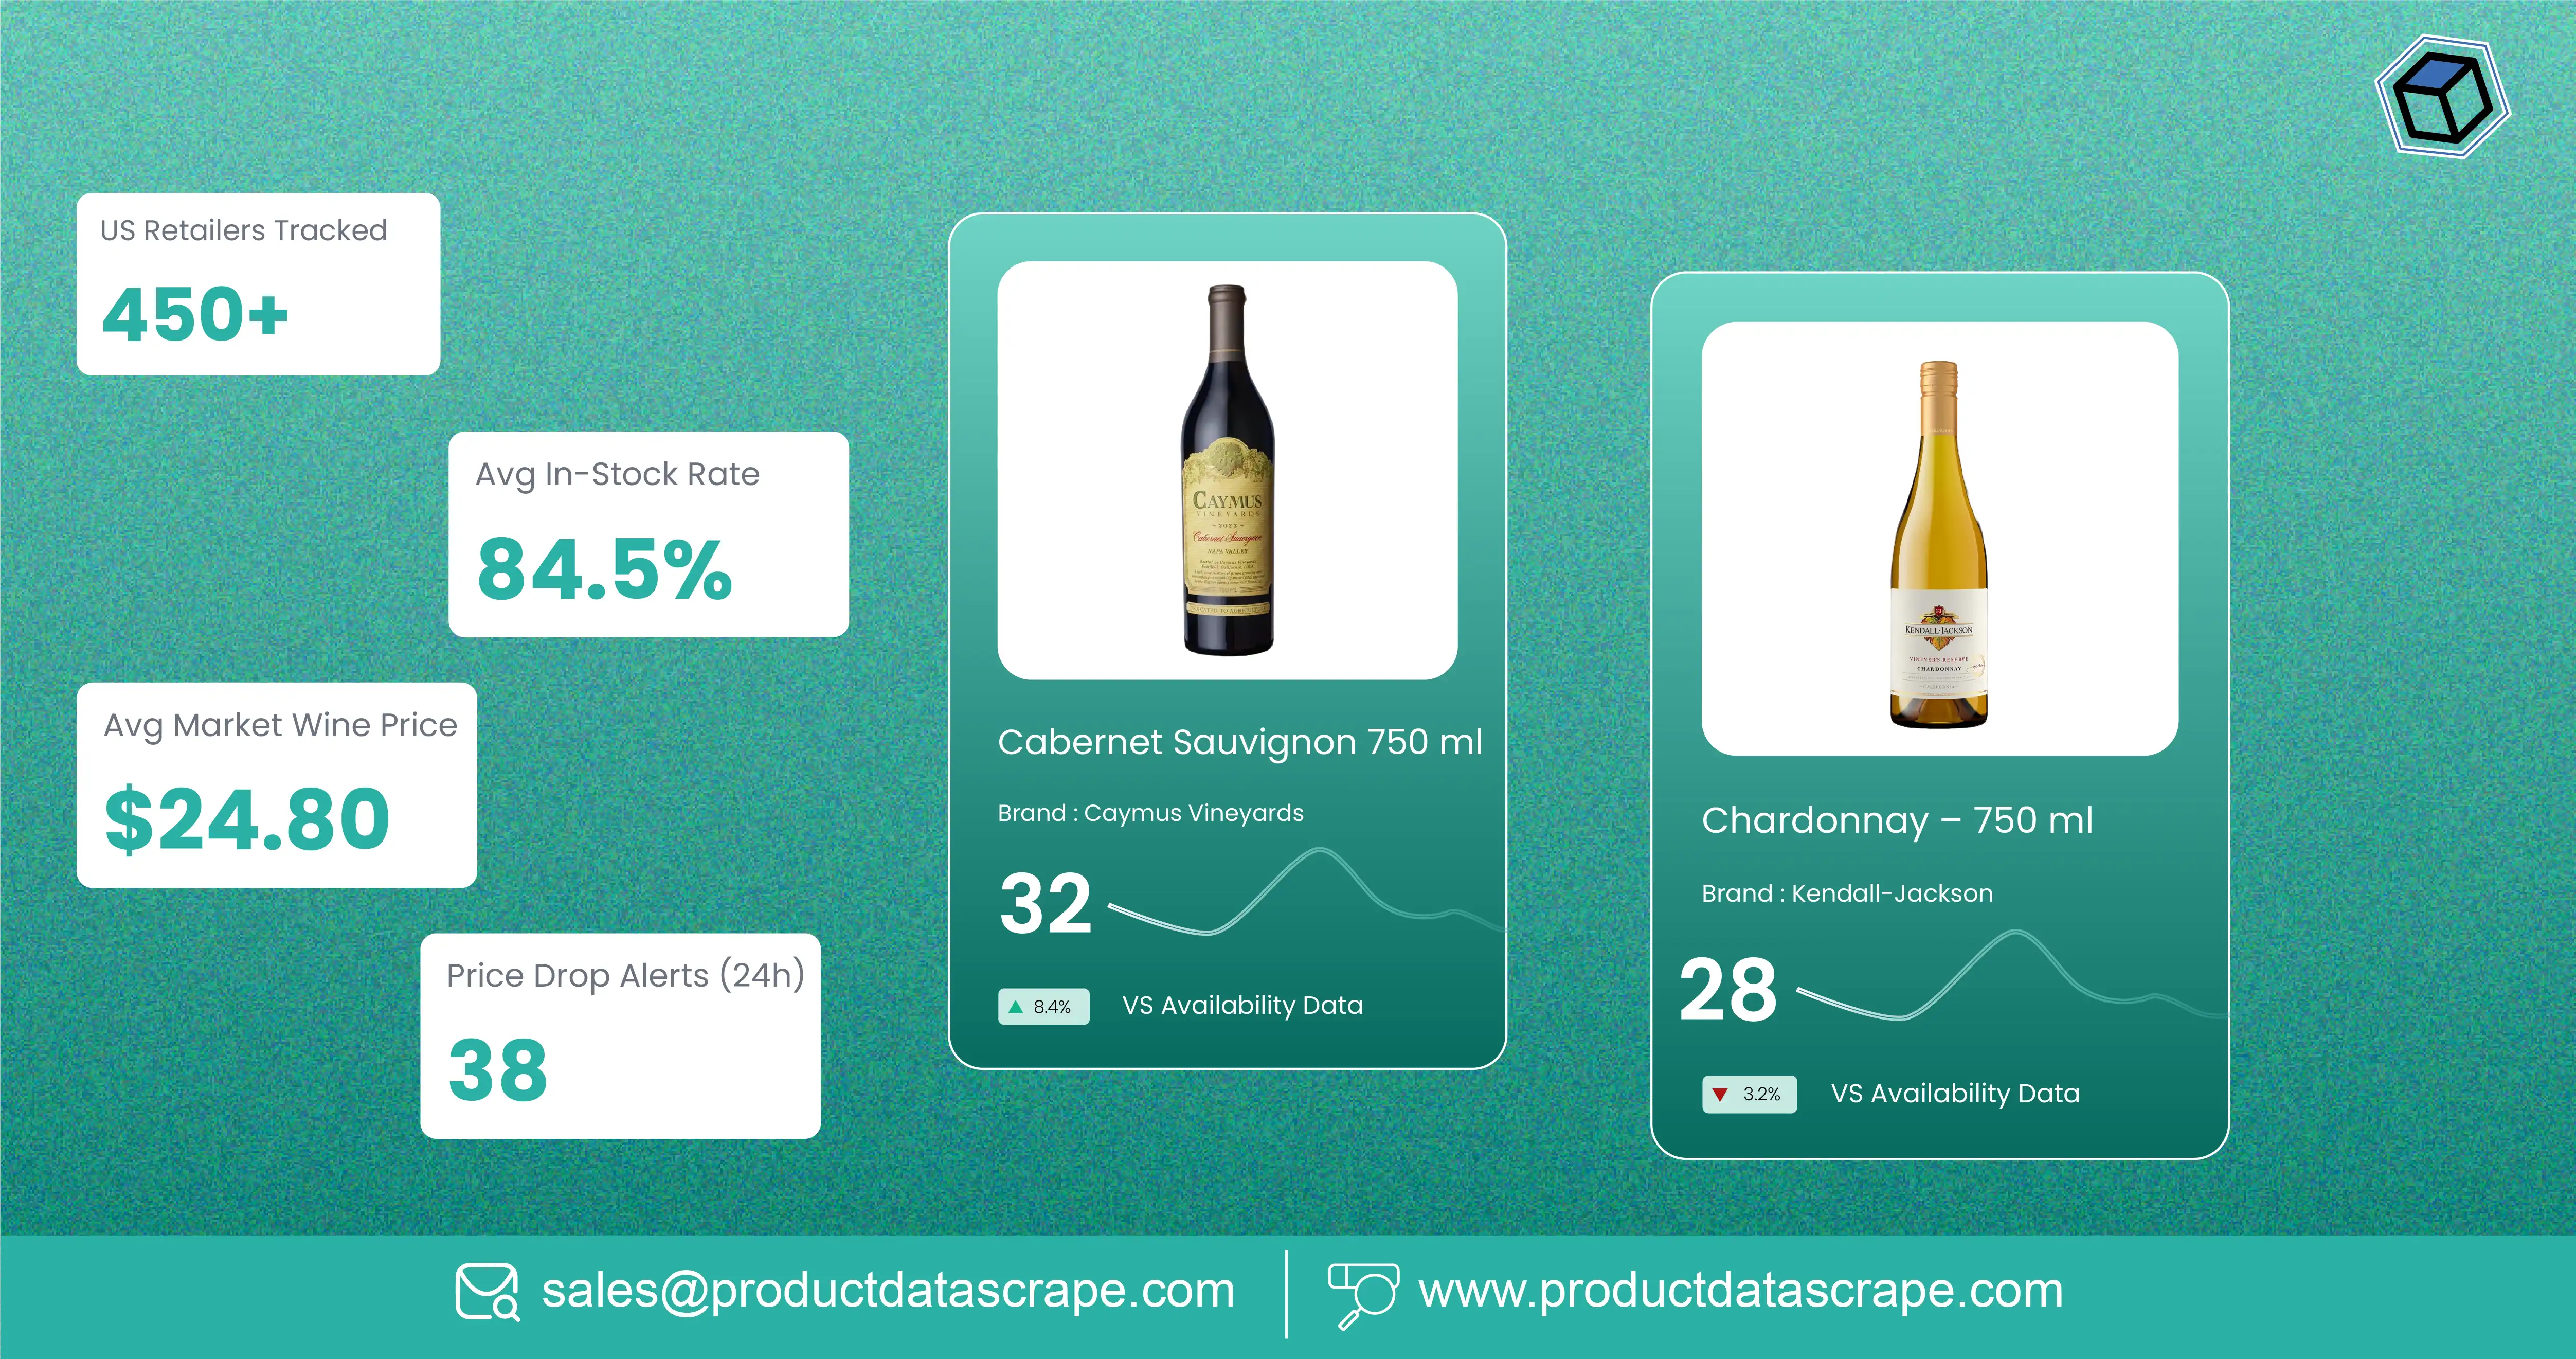
Retailers can solve wine price visibility gaps by continuously collecting product, price, promotion, availability, and competitor data across U.S. chains and converting it into structured, comparable intelligence. A Wine Retail price tracking API US chains 2026 solution can automate this process across thousands of SKUs and multiple retail channels.
The U.S. wine market has experienced changing demand patterns, inventory pressure, shifting consumer preferences, and greater price sensitivity. Wine Institute data shows U.S. wine consumption declined from 1.04 billion gallons in 2020 to 870 million gallons in 2024. Meanwhile, the 2026 Silicon Valley Bank industry report estimated 2025 U.S. wine sales at approximately 329 million cases and $74.3 billion, down from 335.9 million cases and $75.5 billion in 2024.
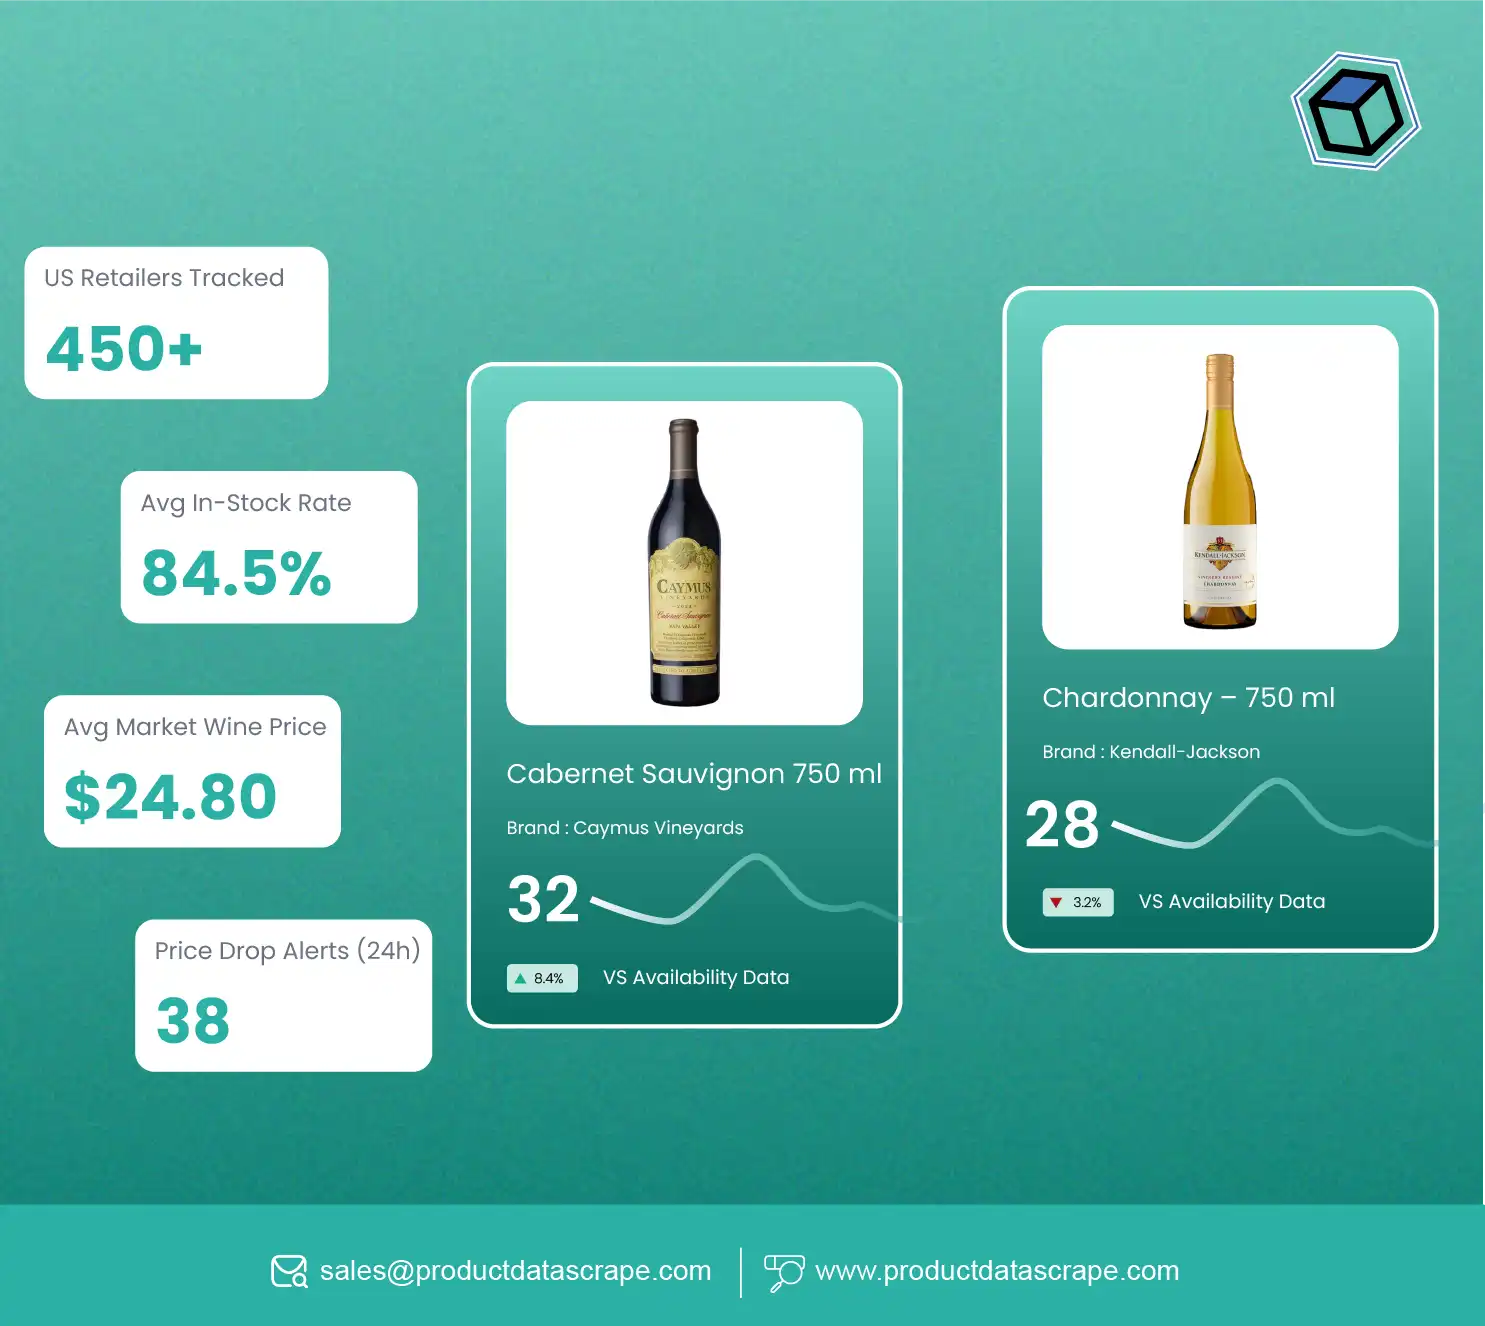
For brands and retailers, these changes make timely pricing intelligence increasingly important. A Wine.com Scraping API for the US can provide structured online catalog information covering wine names, brands, bottle sizes, prices, discounts, ratings, availability, and other attributes.
The objective is not simply to collect prices. It is to understand how prices move across retailers, regions, product categories, pack sizes, and promotional periods.
How Has U.S. Wine Retail Pricing Changed Since 2020?
The shift from pandemic-era demand to a more cautious consumer environment has made historical price tracking more valuable. Retailers and beverage brands need longitudinal datasets rather than isolated price snapshots.
Wine Price Tracking Across US Retailers chains enables businesses to monitor the same or comparable products across national, regional, and online retailers. A structured Wine & Beer Product Dataset can include SKU, product name, producer, varietal, vintage, bottle size, pack configuration, price, discount, availability, rating, retailer, location, and timestamp.
| Year |
U.S. wine consumption |
Market signal |
| 2020 |
1.04B gallons |
Pandemic-era consumption surge |
| 2021 |
1.06B gallons |
Highest level in the 2020–2024 period |
| 2022 |
988M gallons |
Consumption began moderating |
| 2023 |
901M gallons |
Continued decline |
| 2024 |
870M gallons |
Lower consumption and greater price sensitivity |
| 2025 |
~329M cases |
Industry value estimated at ~$74.3B |
| 2026 |
Current-year monitoring |
Focus shifts toward stabilization and price discipline |
The historical figures show why current pricing cannot be interpreted without context. From 2020 through 2022, retailers operated in a very different demand environment. By 2023 and 2024, consumption had fallen materially, while 2025 industry estimates showed additional pressure.
For 2026, retailers can use historical SKU-level observations to identify whether price changes are temporary promotions or longer-term repositioning. The dataset can also separate regular prices from sale prices, helping analysts calculate discount depth and promotion frequency.
This approach is particularly useful for category managers comparing Cabernet Sauvignon, Chardonnay, Pinot Noir, sparkling wine, rosé, and other segments. Instead of manually checking retailer websites, businesses receive standardized observations that can feed pricing dashboards and competitive-monitoring workflows.
What Can a Pricing API Reveal About Beverage Competition?
A pricing API becomes more valuable when it connects price observations with product attributes, retailer information, and historical records. Beverage brands can then analyze not only what a bottle costs but also why its position in the market is changing.
A Wine Pricing API for Beverage Brands can provide structured records that are refreshed according to business requirements. When combined with Alcohol data, the resulting dataset can support assortment analysis, competitive benchmarking, promotion monitoring, and product-level market research.
| Year |
Market development |
Data opportunity |
| 2020 |
Online purchasing accelerated |
Establish digital price baselines |
| 2021 |
Consumption reached 1.06B gallons |
Track high-demand assortments |
| 2022 |
Consumption moderated to 988M gallons |
Monitor normalization |
| 2023 |
Consumption fell to 901M gallons |
Identify competitive discounting |
| 2024 |
Consumption reached 870M gallons |
Compare price and volume signals |
| 2025 |
Industry value estimated at $74.3B |
Benchmark price tiers |
| 2026 |
Market enters another adjustment phase |
Automate ongoing monitoring |
The technical advantage is consistency. A beverage company may want to collect the same fields from hundreds of retailers every day, week, or month. API-based collection can standardize naming conventions, normalize bottle sizes, identify duplicate products, and preserve historical observations.
For example, a 750 ml Cabernet Sauvignon listed at $19.99 and a 750 ml equivalent listed at $24.99 should not simply be treated as two unrelated records. Matching logic can connect brand, producer, varietal, vintage, bottle size, UPC where available, and other identifiers.
This creates a reliable foundation for comparing price changes. Brands can also monitor whether competitors are using discounts, multi-buy offers, loyalty pricing, or temporary promotions.
The resulting data can support pricing teams, category managers, distributors, beverage brands, market researchers, and e-commerce analysts that need repeatable market visibility.
How Can Retailers Turn Price Collection Into Market Intelligence?
Collecting prices is only the first step. The greater value comes from transforming repeated observations into indicators that show where prices are moving, which products are becoming more competitive, and where assortment gaps exist.
A Wine Market Price Intelligence API can combine current and historical observations into a structured analytical layer. The Wine Retail price tracking API US chains 2026 approach can help businesses monitor price changes across retailers, locations, product categories, and time periods.
| Year |
Observable market trend |
Recommended intelligence focus |
| 2020 |
1.04B gallons consumed |
Establish baseline prices |
| 2021 |
1.06B gallons consumed |
Monitor demand-driven pricing |
| 2022 |
988M gallons |
Detect normalization |
| 2023 |
901M gallons |
Track competitive promotions |
| 2024 |
870M gallons |
Compare price elasticity signals |
| 2025 |
~$74.3B estimated industry value |
Monitor price-tier movement |
| 2026 |
Stabilization remains a key theme |
Track real-time competitive changes |
An effective intelligence model can calculate several indicators:
- Average selling price by retailer
- Median price by SKU
- Minimum and maximum observed price
- Discount percentage
- Promotion frequency
- Price gap versus competitors
- Price movement by region
- Out-of-stock frequency
- Assortment overlap
- Premium versus value-tier positioning
These indicators help answer practical questions. Is a retailer consistently cheaper for a particular brand? Is a promotion available nationwide or only in selected markets? Are premium wines holding price better than value products? Is a competitor expanding its assortment while reducing prices?
For analysts, historical data also makes anomaly detection possible. A sudden 15% price drop can be flagged for review rather than discovered manually after the promotion has ended.
This is especially useful in a market where reported industry sales and consumption have weakened. When demand changes, pricing and promotional behavior can become important signals of competitive positioning.
How Can Brands Compare Wine Prices Across Different Retailers?
Retail price comparison becomes difficult when retailers use different product names, pack formats, promotional rules, and regional availability. Normalization is therefore essential to make comparisons meaningful.
Wine Product Price Comparison Across Retailers allows brands to evaluate the market position of comparable products instead of relying on isolated retailer screenshots or manually collected observations.
| Comparison field |
Example analytical use |
| Product name |
Identify matching listings |
| Brand/producer |
Compare brand positioning |
| Varietal |
Benchmark category pricing |
| Vintage |
Separate vintage-specific products |
| Bottle size |
Normalize price-per-volume |
| Retailer |
Identify competitive gaps |
| Region/store |
Measure geographic variation |
| Regular price |
Establish baseline |
| Sale price |
Measure promotional depth |
| Availability |
Identify supply gaps |
| Timestamp |
Build historical trends |
From 2020 to 2022, businesses could use price data to understand pandemic-era changes and the subsequent normalization period. During 2023 and 2024, declining U.S. consumption made competitive pricing more important to monitor. In 2025, SVB estimated industry value at $74.3 billion and volume at approximately 329 million cases. In 2026, businesses can use these historical benchmarks to assess whether observed retailer pricing reflects broader market changes or retailer-specific decisions.
A normalized comparison should account for bottle size. Comparing a 750 ml bottle with a 1.5-liter format without adjustment can produce misleading conclusions. The same applies to multi-bottle packs, case pricing, loyalty discounts, and temporary promotions.
A strong dataset therefore converts raw listings into comparable metrics. Retailers and brands can calculate price indexes, promotional intensity, average competitive gaps, and price-per-liter indicators.
The result is a more useful benchmark for category management and pricing strategy.
Why Does Regional Price Intelligence Matter in the U.S.?
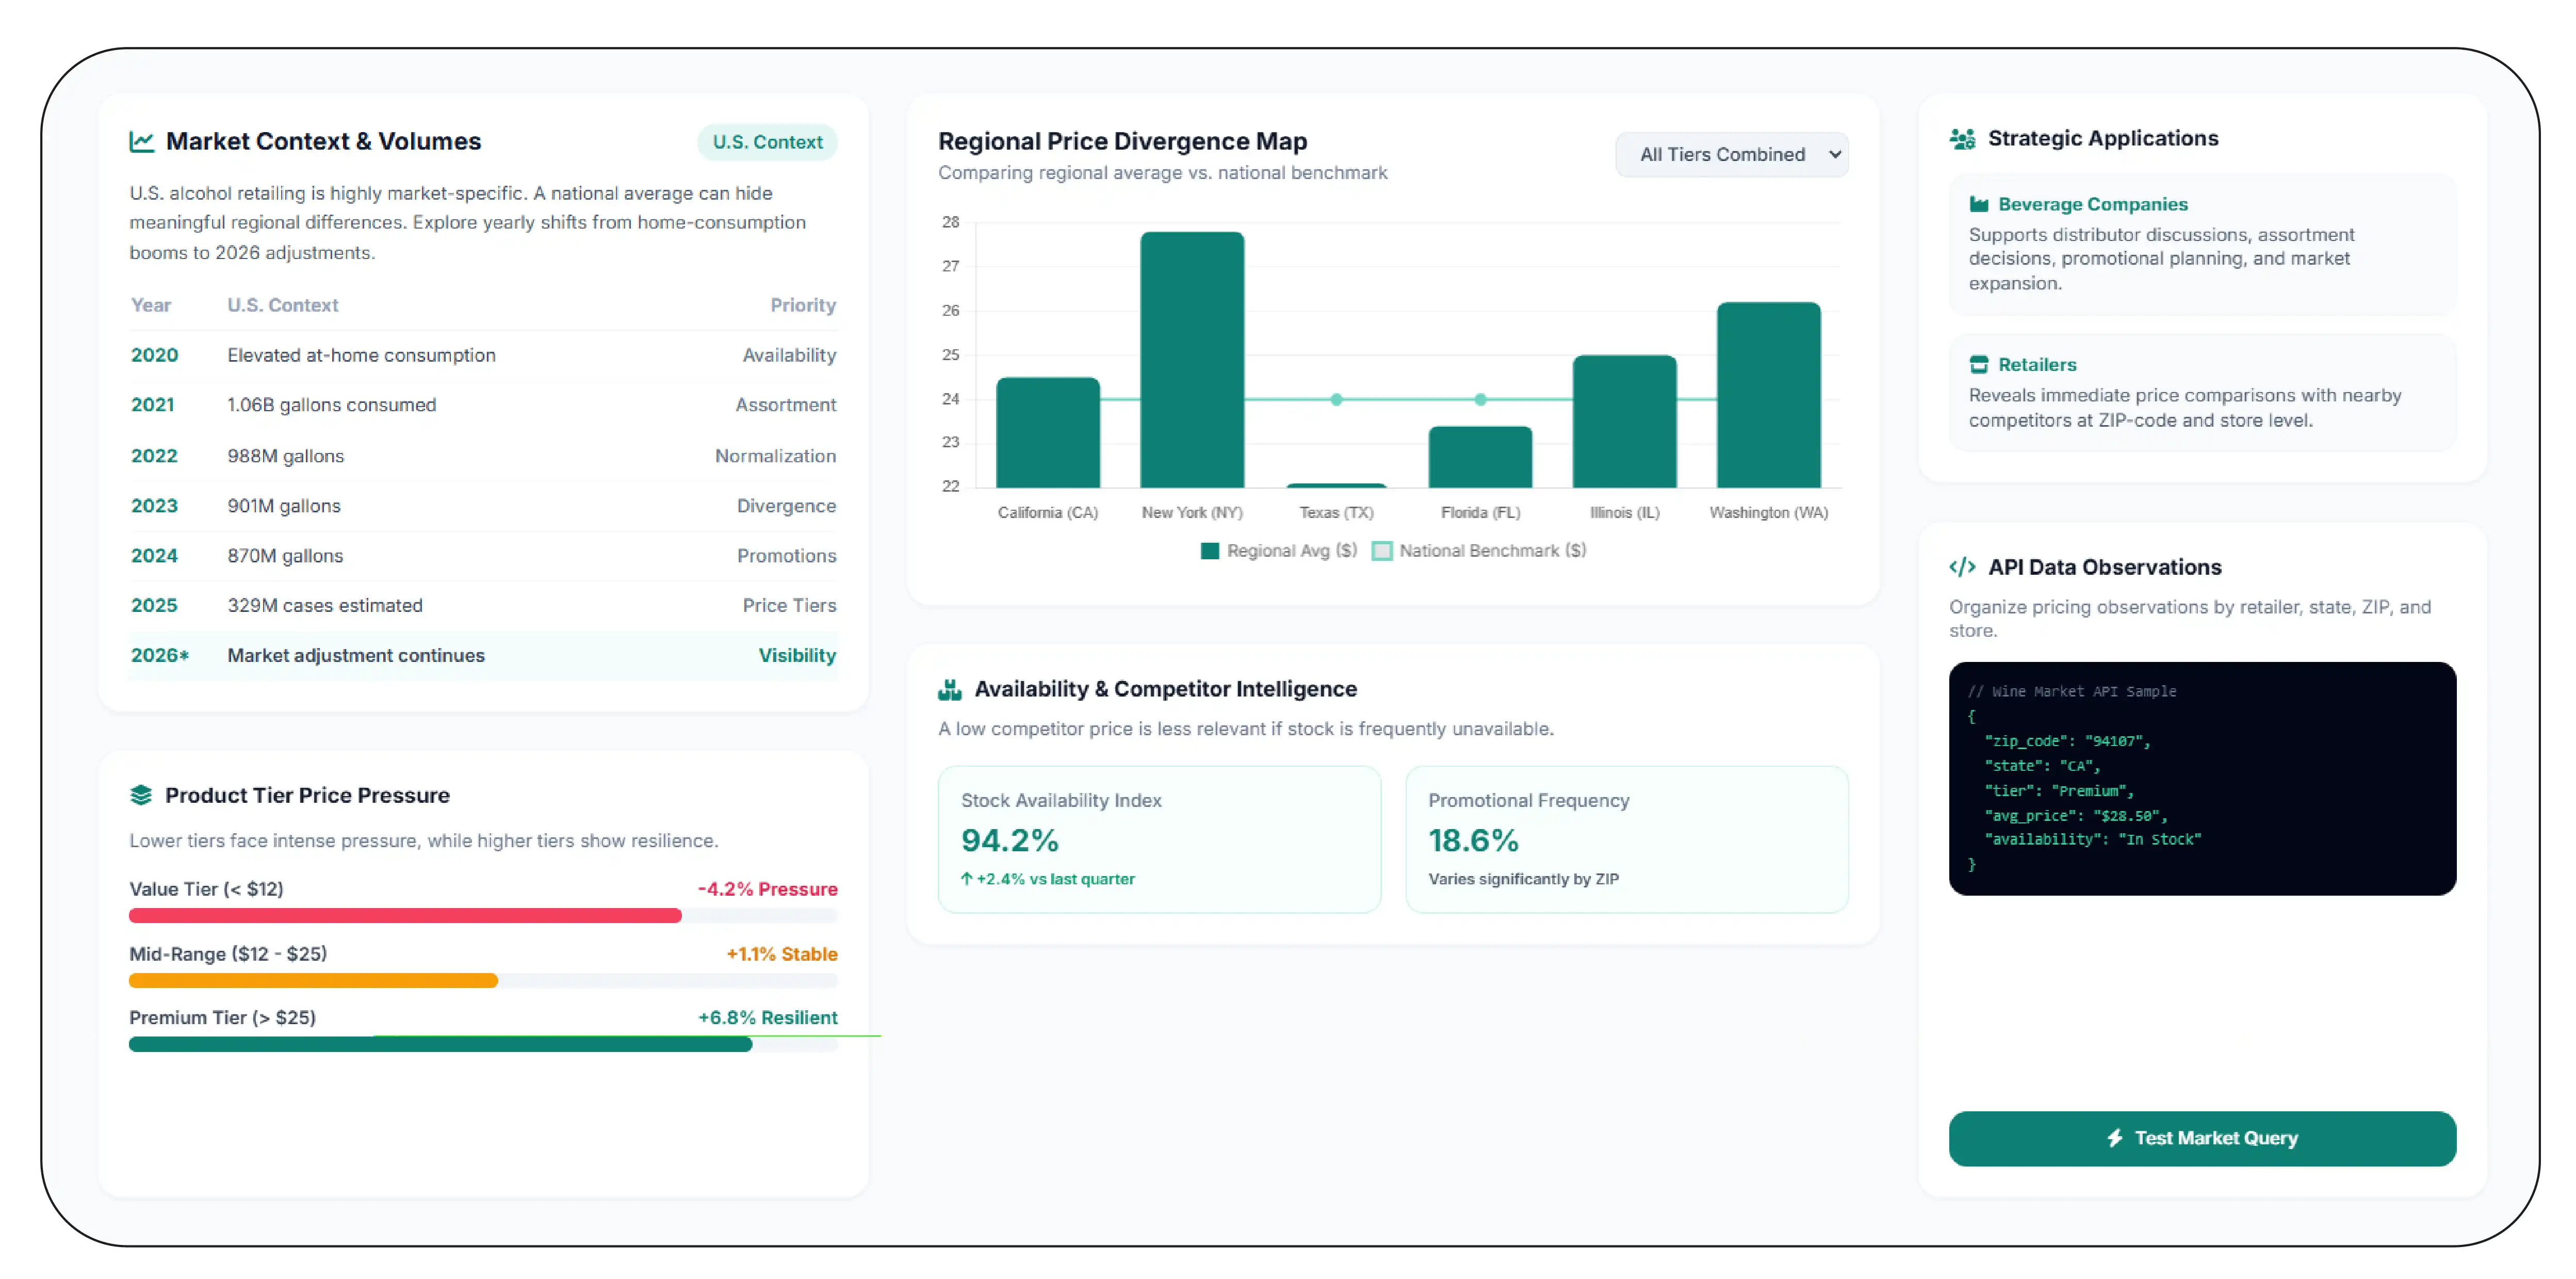
U.S. alcohol retailing is highly market-specific. Availability, distribution structures, retailer footprints, promotions, and local conditions can differ substantially by state and location.
A Wine us Market Price Intelligence API can help organizations organize pricing observations by retailer, state, ZIP code, store, market, and product category.
| Year |
U.S. market context |
Regional data priority |
| 2020 |
Elevated at-home consumption |
Monitor local availability |
| 2021 |
1.06B gallons consumed |
Track assortment expansion |
| 2022 |
988M gallons |
Compare regional normalization |
| 2023 |
901M gallons |
Identify price divergence |
| 2024 |
870M gallons |
Monitor promotional variation |
| 2025 |
329M cases estimated |
Analyze regional price tiers |
| 2026 |
Market adjustment continues |
Maintain location-level visibility |
A national average can hide meaningful regional differences. A wine brand may have a strong price position in one market while facing a substantial discount gap in another. Regional monitoring can expose these differences.
For beverage companies, location-level intelligence can support distributor discussions, assortment decisions, promotional planning, and market expansion analysis. For retailers, it can reveal how their prices compare with nearby competitors.
The data can also be segmented by premium, mid-range, and value products. This is important because recent industry reporting indicates that lower price tiers have faced particular pressure, while some higher price tiers have shown greater resilience.
A regional dataset can additionally capture availability. A low competitor price is less relevant if the product is frequently unavailable. Combining price and availability therefore produces a more complete competitive picture.
In 2026, the goal is not simply to know the national average price. It is to understand where pricing differs, how frequently it changes, and whether those changes correspond with availability and promotions.
How Can Large Retail Catalogs Be Monitored at Scale?
Large beverage retailers can carry thousands of wine products across multiple locations. Manual monitoring becomes difficult when prices, inventory status, promotions, and product information change frequently.
A Total Wine Product Data Scraper can help collect structured catalog information at scale, while the Wine Retail price tracking API US chains 2026 framework can organize recurring observations into a consistent monitoring pipeline.
Total Wine & More states that it operates 300 superstores across 30 states and the District of Columbia, with more than 8,000 wines listed in its stores. This illustrates the potential scale of catalog monitoring for a large beverage retailer.
| Year |
Data-monitoring priority |
| 2020 |
Capture online assortment changes |
| 2021 |
Expand SKU and promotion tracking |
| 2022 |
Standardize product matching |
| 2023 |
Increase competitive price monitoring |
| 2024 |
Add regional and availability signals |
| 2025 |
Strengthen price-tier analysis |
| 2026 |
Automate continuous competitive intelligence |
A scalable workflow typically begins with retailer and category selection. Product URLs are then collected and parsed for fields such as product title, brand, varietal, vintage, bottle size, price, discount, availability, ratings, and retailer location.
The next stage is normalization. Product names are standardized, duplicate listings are identified, and product identifiers are mapped wherever available. Historical records are retained so businesses can compare today's price with previous observations.
Automated validation is equally important. If a retailer changes its page structure, missing values or abnormal price changes should be flagged instead of silently entering the dataset.
For large catalogs, scheduling can be configured around business needs. Daily monitoring may be appropriate for highly competitive products, while weekly or monthly collection may be sufficient for slower-moving categories.
This creates a repeatable data pipeline that turns a large retail catalog into an actionable competitive intelligence resource.
Why Choose Product Data Scrape?
Product Data Scrape can support businesses that need structured, scalable retail intelligence rather than isolated data snapshots. A monitoring solution can be designed around selected retailers, categories, geographic markets, SKUs, and collection frequencies.
A Wine.com Liquor Market Analytics Dataset can combine product attributes, prices, promotions, availability, and historical observations for analytical use.
The workflow can include source discovery, automated extraction, product matching, data normalization, validation, historical storage, and delivery through business-ready formats or APIs.
For beverage brands, distributors, retailers, and market researchers, this approach reduces repetitive manual monitoring and creates a consistent dataset for dashboards and competitive analysis.
What Should Businesses Expect From Wine Pricing Intelligence in 2026?
The U.S. wine industry entered 2026 after several years of changing consumption patterns. Wine Institute data shows consumption fell from 1.06 billion gallons in 2021 to 870 million gallons in 2024. SVB's 2026 report estimated 2025 industry sales at approximately 329 million cases and $74.3 billion.
These figures do not directly represent individual retailer prices. Instead, they provide market context for why continuous price monitoring matters.
A retailer or brand can use Web Scraping Wine Pricing Trends to identify changes in average prices, promotional frequency, price gaps, assortment breadth, and regional variation. The data becomes more useful when collected consistently over time.
The 2026 market environment also makes segmentation important. Businesses should distinguish value, mainstream, and premium products rather than calculating one broad average. They should also track bottle size, vintage, retailer, location, and promotion status.
The most actionable setup combines current observations with historical records. That allows analysts to identify whether a price is normal, promotional, unusually high, or unusually low relative to the same SKU's historical range.
For buyers and category managers, the practical benefit is faster visibility. Instead of waiting for periodic reports, teams can access structured observations and investigate changes as they occur.
Conclusion
Wine pricing has become increasingly data-dependent as U.S. consumption patterns, consumer preferences, inventories, and competitive dynamics continue to evolve. A structured pricing dataset allows businesses to move beyond occasional manual checks and build continuous visibility across retailers and markets.
The combination of product matching, price monitoring, promotion tracking, availability analysis, regional segmentation, and historical records creates a practical foundation for competitive intelligence.
A Wine Retail price tracking API US chains 2026 solution can help businesses transform fragmented retail listings into standardized information for pricing analysis and market monitoring.
Partner with Product Data Scrape to build scalable wine pricing datasets and turn retailer-level market data into actionable competitive intelligence!
Frequently Asked Questions
1. What does a wine retail price tracking API provide?
It can provide structured product prices, discounts, availability, product attributes, retailer information, timestamps, and historical observations for competitive pricing analysis.
2. Why track wine prices across multiple U.S. retailers?
Multi-retailer monitoring helps brands identify price gaps, promotional differences, assortment changes, regional variations, and competitive positioning across markets.
3. How frequently should wine prices be monitored?
Daily monitoring suits fast-changing categories and promotional campaigns. Weekly or monthly collection can work for slower-moving products and longer-term market analysis.
4. Can Product Data Scrape monitor large wine catalogs?
Yes. Product Data Scrape can structure monitoring around selected retailers, categories, SKUs, geographic markets, attributes, and collection schedules.
5. What fields should a wine pricing dataset contain?
Useful fields include product name, brand, varietal, vintage, bottle size, price, discount, availability, retailer, location, product URL, identifier, timestamp, and historical price.


 Singapore
 EMAIL
EMAIL
 PHONE
PHONE


.webp "thumb")













.webp)






