Introduction
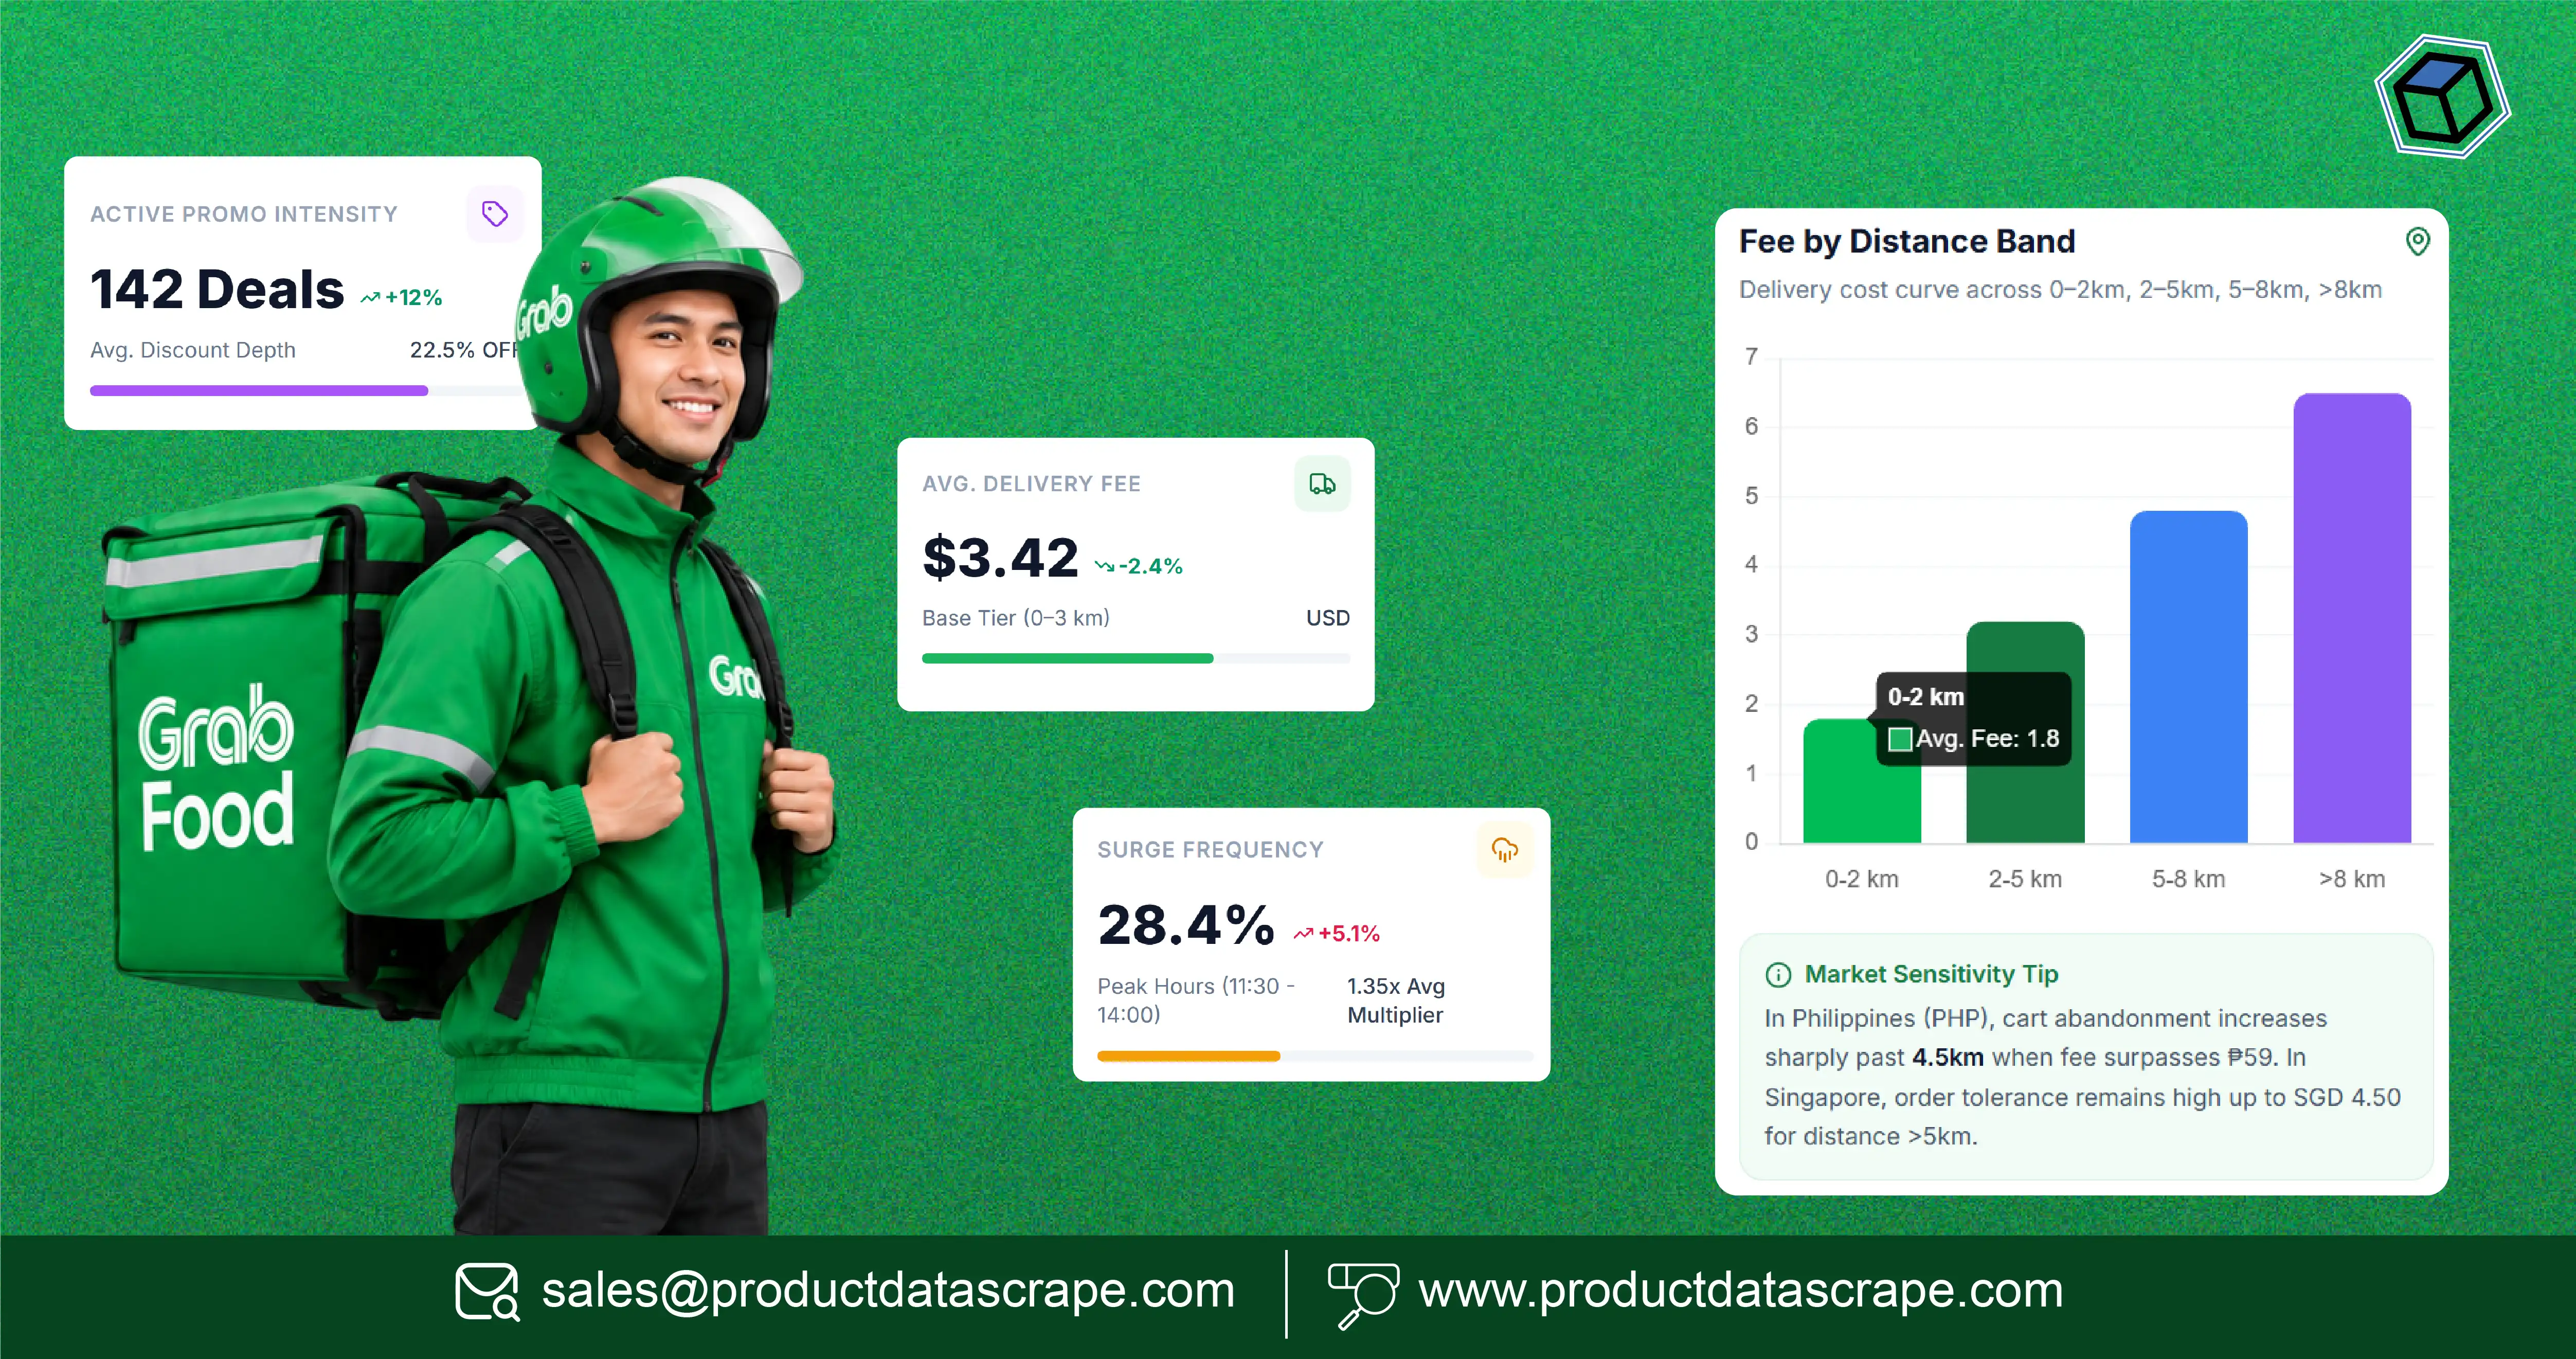
Grabfood Tracking delivery fee data Philippines Singapore Malaysia helps restaurants, food brands, delivery platforms, and market analysts monitor changing delivery charges, promotions, restaurant availability, and delivery-time patterns across three important Southeast Asian markets. The core value is simple: businesses can compare market conditions using structured, timestamped data instead of relying on occasional manual checks.
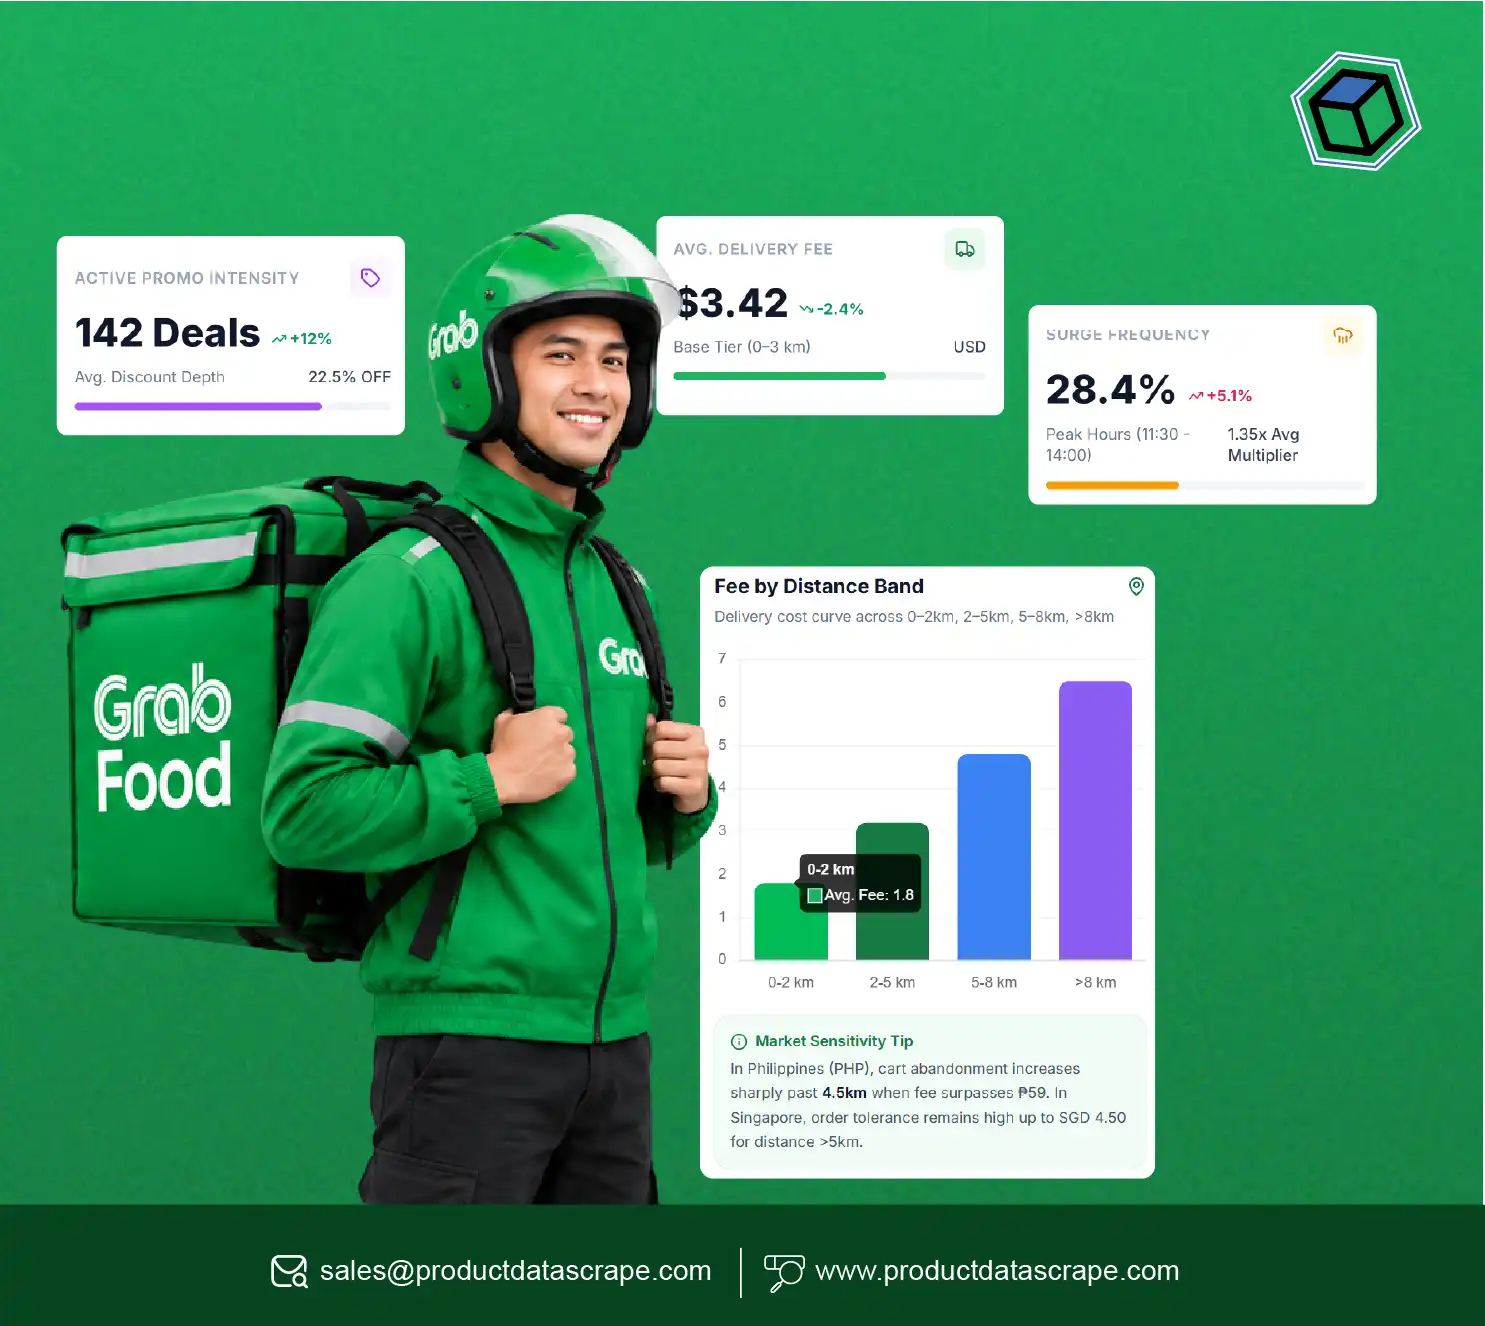
Grab states that GrabFood delivery fees are influenced by factors including distance, while its 2023 explanation of dynamic pricing says fees can change based on live demand, driver-partner supply, weather, traffic, and other real-time conditions. Grab also introduced timestamps showing when a delivery fee was set. (Grab Help Centre)
This makes delivery-fee monitoring particularly useful for businesses that operate across the Philippines, Singapore, and Malaysia. A fee that appears attractive at one time or location may change later because of operational conditions or promotions.
The broader market is also substantial. Momentum Works estimated Southeast Asia's food-delivery GMV at US$19.3 billion in 2024, up 13% year over year. Grab's estimated regional market share reached 53.9% in 2024. (Momentum Works)
For brands, the objective is therefore not simply to record a delivery fee. It is to understand when fees change, where they change, how promotions affect them, and how those differences influence competitive positioning.
How can brands monitor delivery costs in the Philippines?
The Philippines presents a diverse delivery environment where distance, location, restaurant coverage, demand conditions, and promotions can affect the final customer experience. Consistent data collection can help brands understand these variations at a granular level.
Scrape GrabFood Philippines Delivery Fees enables businesses to structure delivery observations around restaurants, locations, order conditions, delivery charges, promotions, and timestamps. A Grocery Datasets layer can further extend monitoring to grocery and convenience-oriented products available through relevant delivery categories.
Grab's Philippines consumer information states that delivery fees are calculated according to the distance between pickup and drop-off locations, while the final amount is visible before checkout. (Grab)
| Year |
Market/data context |
Monitoring opportunity |
| 2020 |
Pandemic accelerated digital food ordering |
Establish delivery-fee baselines |
| 2021 |
Online ordering remained important |
Expand restaurant and location coverage |
| 2022 |
Food-delivery platforms entered a more mature phase |
Track competitive pricing |
| 2023 |
Grab introduced delivery-fee timestamps |
Analyze fee-setting periods |
| 2024 |
Southeast Asian food delivery GMV reached $19.3B |
Increase cross-market benchmarking |
| 2025 |
Delivery platforms increasingly focused on profitability |
Monitor subsidy and promotion changes |
| 2026 |
Grab continues expanding data and merchant capabilities |
Build continuous market monitoring |
For a Philippine dataset, businesses can collect restaurant name, cuisine, location, delivery fee, minimum order amount, estimated delivery time, promotion, free-delivery eligibility, menu information, and timestamp where publicly available.
The most useful analysis compares similar restaurants across locations. For example, a restaurant chain with outlets in Metro Manila may show different delivery conditions depending on the customer's location. Monitoring those observations over time can reveal geographic pricing patterns.
Grocery monitoring adds another dimension. Businesses can compare food-service delivery with grocery-oriented delivery, track promotional mechanics, and identify whether delivery-fee changes coincide with basket-value requirements.
Historical collection is important because a single observation cannot establish a trend. A weekly or daily dataset can reveal recurring peak-period changes, promotional windows, and location-level differences.
How does Singapore delivery pricing vary by location and time?
Singapore's compact geography does not eliminate delivery-price variation. Grab says delivery fees depend on factors such as distance, and its Singapore platform provides exact delivery charges before checkout. (Grab)
GrabFood Singapore Delivery Pricing Tracking Data can help businesses compare delivery charges across restaurants, customer locations, time periods, promotions, and delivery zones. Real-time price tracking is particularly relevant because Grab describes delivery fees as dynamic and affected by changing marketplace conditions. (Grab)
| Year |
Singapore market context |
Data priority |
| 2020 |
Digital food ordering expanded |
Capture online delivery baselines |
| 2021 |
Consumer adoption remained elevated |
Track restaurant coverage |
| 2022 |
Market entered a more mature phase |
Compare platform pricing |
| 2023 |
Grab introduced fee-setting timestamps |
Add temporal fee analysis |
| 2024 |
Regional delivery GMV reached $19.3B |
Benchmark market dynamics |
| 2025 |
Profitability became a stronger platform focus |
Monitor promotions and fees |
| 2026 |
Grab expanded merchant-focused initiatives |
Connect pricing with merchant intelligence |
Singapore's market also provides an example of geographic segmentation. Grab divides the island into 11 GrabFood zones, including Central, East, West, North, Northeast, Downtown, and others. Grab says these zones help merchant-partners understand local trends and participate in delivery campaigns with varying fee-funding arrangements. (Grab)
This makes zone-level monitoring useful. Instead of treating Singapore as one uniform market, analysts can compare delivery charges and promotional availability by zone.
Businesses can also track free-delivery campaigns separately from standard delivery fees. Grab's Singapore platform promotes free-delivery offers subject to conditions such as participating stores and minimum spending requirements. (Grab)
A structured dataset can therefore distinguish:
- Standard delivery fee
- Discounted delivery fee
- Free delivery
- Minimum spend
- Promotion code
- Restaurant zone
- Estimated delivery time
- Observation timestamp
This enables businesses to determine whether an apparent price difference is a permanent pricing characteristic or simply the result of a temporary promotion.
Why is Malaysian delivery-charge monitoring important?
Malaysia is one of the key food-delivery markets in Southeast Asia, and changing platform economics make competitive monitoring valuable for restaurant groups, consumer brands, and market researchers.
GrabFood Malaysia Delivery Charge Extraction can organize delivery-fee observations by restaurant, location, order conditions, promotions, and time. Competitive pricing data then allows businesses to compare delivery economics across brands and locations rather than looking at individual listings in isolation.
Momentum Works reported that Malaysia's food-delivery GMV grew 9% year over year in 2023, while Grab accounted for a significant share of Southeast Asian food-delivery activity. (Low Down)
| Year |
Malaysia/Southeast Asia context |
Business intelligence use |
| 2020 |
Delivery adoption accelerated |
Build initial market benchmarks |
| 2021 |
Digital ordering remained important |
Expand restaurant coverage |
| 2022 |
Regional growth moderated |
Monitor competitive pricing |
| 2023 |
Malaysia food-delivery GMV grew 9% |
Compare market-level changes |
| 2024 |
Southeast Asian food delivery GMV reached $19.3B |
Track regional competition |
| 2025 |
Regional market growth accelerated to 13% |
Increase monitoring frequency |
| 2026 |
Platform strategies continue evolving |
Maintain continuous fee intelligence |
The Malaysian dataset can be segmented by major urban areas, restaurant categories, cuisines, and delivery distances. This creates a stronger foundation for comparing delivery costs.
For restaurant groups, the analysis can answer whether delivery fees are consistent across branches. For brands, it can show how competitors position themselves when delivery costs are included in the customer experience.
Competitive pricing analysis should also consider the total checkout economics. A low menu price combined with a high delivery fee may create a different consumer proposition than a slightly higher menu price with lower delivery costs.
Therefore, the dataset should ideally capture menu price, delivery fee, discounts, minimum order requirements, promotions, and estimated delivery time.
Over time, these records can help identify changes in pricing behavior. Businesses can investigate whether fees rise during specific periods, whether promotional delivery pricing becomes more frequent, and whether certain restaurant categories use free-delivery incentives more aggressively.
How can weekly monitoring reveal recurring delivery patterns?
Daily delivery prices can fluctuate. Weekly monitoring adds the historical context needed to determine whether a change is temporary or part of a recurring pattern.
GrabFood Weekly Delivery Fee Data Scraping can create a recurring observation layer for restaurants, delivery fees, promotions, and geographic markets. Delivery fee & time tracking adds an operational dimension by connecting the charge with the expected delivery window.
| Year |
Monitoring evolution |
Useful weekly insight |
| 2020 |
Rapid digital adoption |
Identify baseline delivery conditions |
| 2021 |
Wider restaurant participation |
Compare broader restaurant sets |
| 2022 |
More mature competition |
Track recurring price differences |
| 2023 |
Dynamic fee timestamp introduced |
Analyze fee timing |
| 2024 |
Regional GMV rebounded strongly |
Increase competitive benchmarking |
| 2025 |
Southeast Asian food delivery grew 13% |
Monitor promotional intensity |
| 2026 |
Dynamic marketplace conditions continue |
Build automated recurring datasets |
Weekly data is especially valuable because it prevents analysts from overreacting to one unusual observation. A fee observed during heavy rain, peak demand, or a promotional campaign may not represent the normal market condition.
A seven-day or four-week dataset can calculate:
- Average weekly delivery fee
- Median delivery fee
- Highest observed fee
- Lowest observed fee
- Average estimated delivery time
- Promotion frequency
- Free-delivery frequency
- Restaurant availability
- Fee change percentage
- Location-level variation
The same restaurant can then be compared across different weeks and markets.
For example, an analyst could identify that a restaurant frequently offers free delivery on weekends but applies standard fees during weekdays. Another restaurant might maintain a stable fee but offer menu-level discounts instead.
This distinction matters for competitive analysis. Businesses should not evaluate delivery pricing without considering promotional mechanics.
Weekly monitoring can also identify anomalies. A sudden increase in delivery time combined with a higher fee may indicate a temporary operational condition. Repeated increases at the same time each week may indicate a recurring demand pattern.
How can businesses compare delivery costs across all three markets?
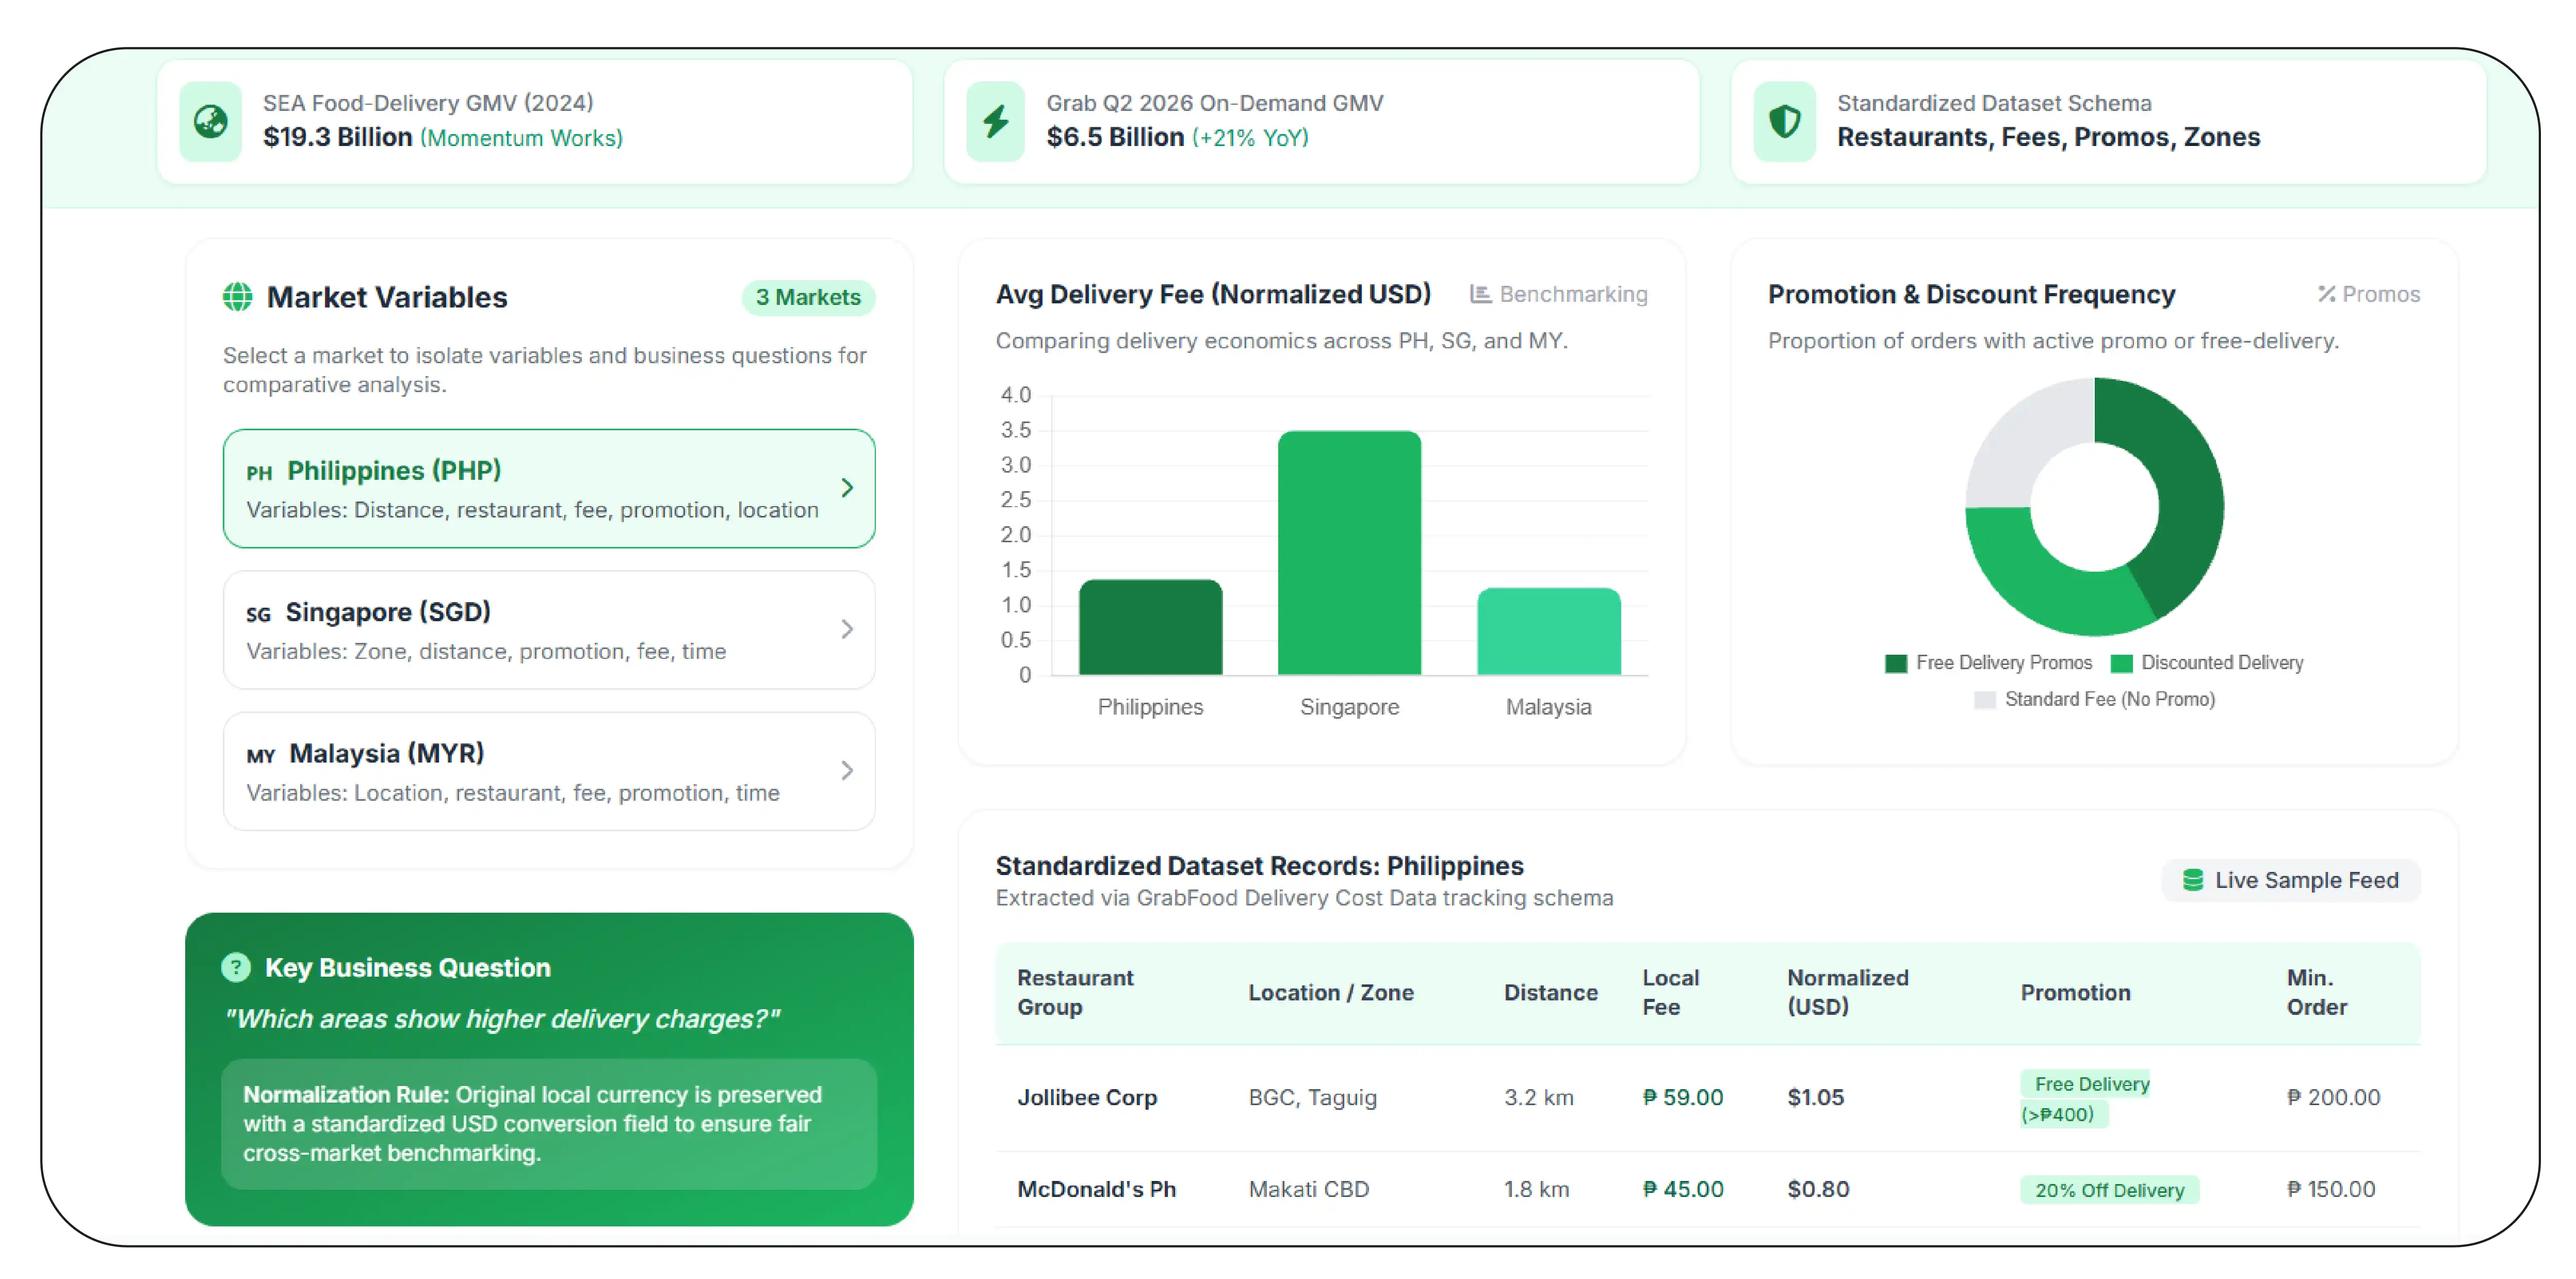
Cross-market analysis becomes more valuable when the same data structure is applied consistently across the Philippines, Singapore, and Malaysia.
Scrape GrabFood Delivery Cost Data enables businesses to build a standardized dataset covering restaurants, delivery fees, order requirements, promotions, locations, and timestamps. The resulting records can be used with Grabfood Tracking delivery fee data Philippines Singapore Malaysia to compare market-level differences.
| Market |
Key variables |
Example business question |
| Philippines |
Distance, restaurant, fee, promotion, location |
Which areas show higher delivery charges? |
| Singapore |
Zone, distance, promotion, fee, time |
How do zones differ? |
| Malaysia |
Location, restaurant, fee, promotion, time |
Which restaurant groups show different fee patterns? |
The regional comparison should avoid treating currencies as directly comparable without normalization. Analysts should preserve the original local currency and add standardized currency conversions as a separate analytical field.
Similarly, delivery fees should be evaluated against distance and order value where possible. A $3 equivalent fee may represent a very different customer proposition depending on the basket size and delivery distance.
A cross-market dataset can support several analytical models:
- Fee benchmarking: Compare average and median delivery charges.
- Promotion benchmarking: Measure free-delivery and discounted-delivery frequency.
- Location analysis: Identify geographic variations.
- Time analysis: Compare peak and non-peak observations.
- Restaurant analysis: Compare delivery economics across restaurant groups.
- Customer-value analysis: Compare delivery fees against minimum order requirements.
The broader market context supports this approach. Momentum Works estimated Southeast Asia's food-delivery GMV at $17.1 billion in 2023 and $19.3 billion in 2024. (Low Down)
Grab's own 2026 results also show continued platform scale, with Q2 2026 On-Demand GMV reaching $6.5 billion, up 21% year over year. This figure covers Grab's broader on-demand business rather than GrabFood alone, so it should not be interpreted as food-delivery GMV. (Grab)
For businesses, the key takeaway is that regional scale makes standardized data increasingly useful.
How can restaurant-level delivery monitoring support pricing strategy?
Restaurant-level analysis provides the most granular view because delivery economics ultimately affect individual listings and customer choices.
Scrape GrabFood Restaurant Delivery Fees to build a restaurant-level dataset covering delivery charges, restaurant information, locations, promotions, estimated delivery times, and availability.
| Year |
Restaurant-level data opportunity |
Recommended approach |
| 2020 |
More restaurants shifted online |
Capture digital restaurant baselines |
| 2021 |
Restaurant-platform participation expanded |
Build broader restaurant datasets |
| 2022 |
Competitive pressure increased |
Track pricing differences |
| 2023 |
Dynamic fee information became more transparent |
Add fee timestamps |
| 2024 |
Regional food-delivery GMV reached $19.3B |
Expand restaurant monitoring |
| 2025 |
Market growth accelerated to 13% |
Increase monitoring frequency |
| 2026 |
Merchant data and discovery capabilities continue expanding |
Connect delivery and restaurant intelligence |
The restaurant-level model should connect several variables rather than focusing on the delivery charge alone.
A useful record might contain:
- Restaurant name
- Restaurant category
- Cuisine
- Location
- Delivery fee
- Minimum order value
- Estimated delivery time
- Promotion
- Free-delivery eligibility
- Menu price
- Rating
- Review count
- Timestamp
- Product or restaurant URL
This structure allows businesses to investigate relationships between price and service conditions.
For instance, analysts can examine whether restaurants with longer estimated delivery times offer lower delivery fees. They can also determine whether premium restaurants use different promotional strategies from quick-service restaurants.
Another useful metric is total customer cost. Instead of analyzing delivery fees separately, businesses can calculate menu subtotal plus delivery charge and applicable fees. This creates a more realistic basis for competitive comparison.
Restaurant chains can also compare branches. If one branch consistently attracts lower delivery fees, the business can investigate whether distance, location, or promotional configuration explains the difference.
Grab's 2026 Singapore initiatives show that merchant-facing data and digital capabilities remain an active area of development. Grab and Enterprise Singapore announced a three-year partnership intended to provide more than 12,000 companies with data insights and capability-building support. (Grab)
Why Choose Product Data Scrape?
Extract GrabFood Grocery & Gourmet Food Data can support businesses that need structured marketplace intelligence across restaurants, food products, grocery categories, locations, prices, promotions, and delivery conditions.
The collection workflow can be configured around selected markets and fields, followed by normalization, validation, timestamping, and historical storage. This creates datasets suitable for dashboards, competitive analysis, pricing research, and recurring monitoring.
Product Data Scrape can also help businesses structure multi-market datasets so that Philippines, Singapore, and Malaysia observations can be compared without losing their original local-market context.
What should businesses monitor in 2026?
The Southeast Asian food-delivery market has moved beyond simple growth measurement. Pricing, promotions, operational efficiency, restaurant discovery, and customer economics are increasingly interconnected.
Grab reported Q1 2026 On-Demand GMV growth of 24% year over year to $6.1 billion, followed by Q2 2026 growth of 21% to $6.5 billion. Again, these are broader On-Demand figures rather than GrabFood-only figures. (Grab)
At the market level, Momentum Works reported 13% growth in Southeast Asian food-delivery GMV in 2024 after two years of approximately 5% growth. (Momentum Works)
These developments suggest that businesses should move toward continuous data monitoring rather than one-time market research.
The highest-value fields include:
- Delivery fee
- Delivery distance
- Estimated delivery time
- Restaurant location
- Menu price
- Minimum order value
- Free-delivery eligibility
- Promotional discount
- Restaurant availability
- Timestamp
- Market and currency
A historical dataset can then support alerts for major changes. Businesses might flag a delivery fee increase above a defined threshold, a sudden change in delivery time, or the appearance of a new promotion.
The objective is not to predict every individual fee. Grab itself explains that dynamic fees respond to real-time marketplace conditions. (Grab) Instead, the objective is to create enough observations to understand recurring patterns and meaningful changes.
Conclusion
Delivery pricing across the Philippines, Singapore, and Malaysia is dynamic rather than static. Grab states that delivery fees can depend on distance and changing marketplace factors, while its dynamic-pricing explanation highlights demand, driver supply, weather, and traffic as influences. (Grab Help Centre)
For brands and restaurant groups, structured historical data can reveal fee patterns that individual observations cannot. Combining delivery charges with promotions, restaurant locations, order requirements, availability, and delivery times creates a more complete view of customer-facing delivery economics.
A recurring Web Scraping API workflow can make this information easier to collect, normalize, validate, and analyze across multiple markets.
Grabfood Tracking delivery fee data Philippines Singapore Malaysia can therefore become a foundation for regional pricing intelligence, competitive benchmarking, and delivery-strategy analysis.
Partner with Product Data Scrape to build scalable GrabFood delivery intelligence datasets and monitor fees, promotions, restaurants, and delivery trends across Southeast Asia!
Frequently Asked Questions
1. Why should businesses track GrabFood delivery fees?
Delivery fees can vary by distance, location, demand, promotions, weather, and other conditions. Historical tracking helps businesses understand these changes and benchmark customer delivery costs.
2. Can delivery data be compared across Philippines, Singapore, and Malaysia?
Yes. Businesses can standardize fields while retaining local currencies, locations, timestamps, promotions, and market-specific conditions for meaningful cross-market analysis.
3. How often should delivery fees be monitored?
Daily monitoring captures fast changes, while weekly monitoring provides useful trend context. The appropriate frequency depends on promotional activity, business objectives, and market volatility.
4. What information should a delivery dataset contain?
A useful dataset can include restaurant, location, delivery fee, estimated delivery time, menu price, promotion, minimum order, availability, currency, URL, and timestamp.
5. Can Product Data Scrape create recurring GrabFood datasets?
Yes. Product Data Scrape can support recurring collection and structured delivery datasets based on selected markets, restaurants, categories, fields, and monitoring schedules.


 Singapore
 EMAIL
EMAIL
 PHONE
PHONE


.webp "thumb")













.webp)






