Introduction
Grocery prices can differ across locations because of regional market conditions, promotions, product assortment, and store-specific offers. Scrape Store-Specific Grocery Prices by ZIP Code to organize permitted pricing observations by retailer, location, product, and collection date. This approach helps grocery retailers, consumer brands, and market researchers understand local pricing patterns instead of relying solely on national averages.
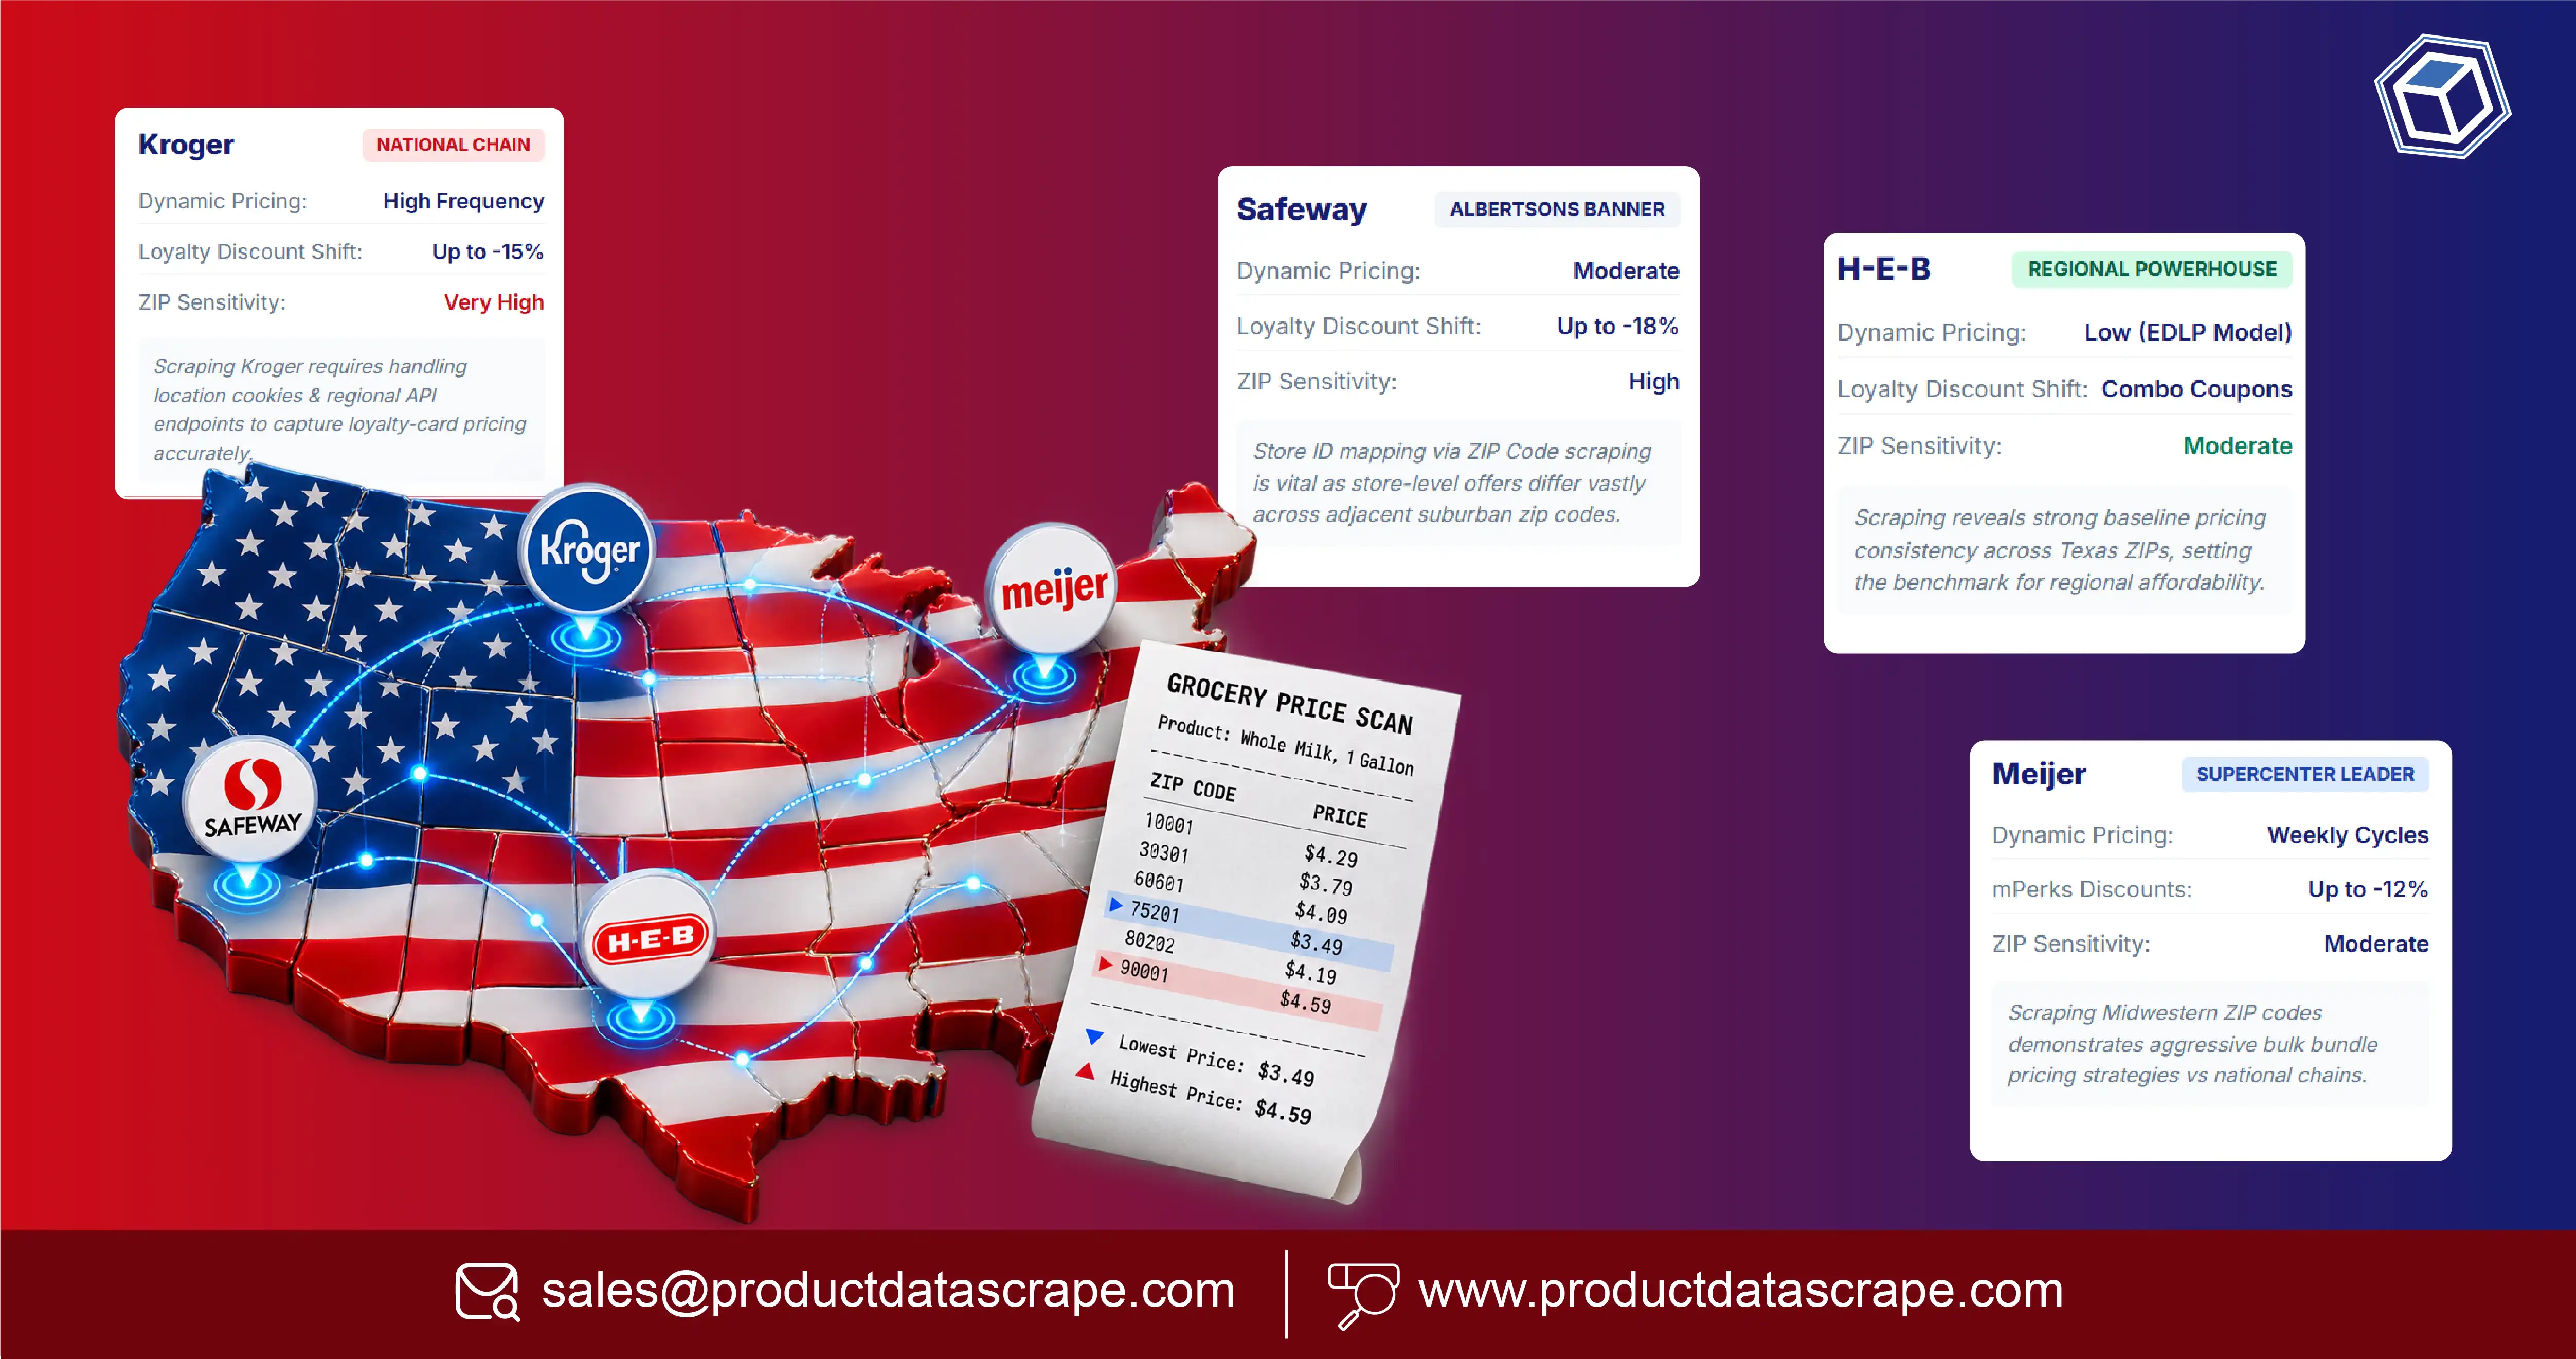
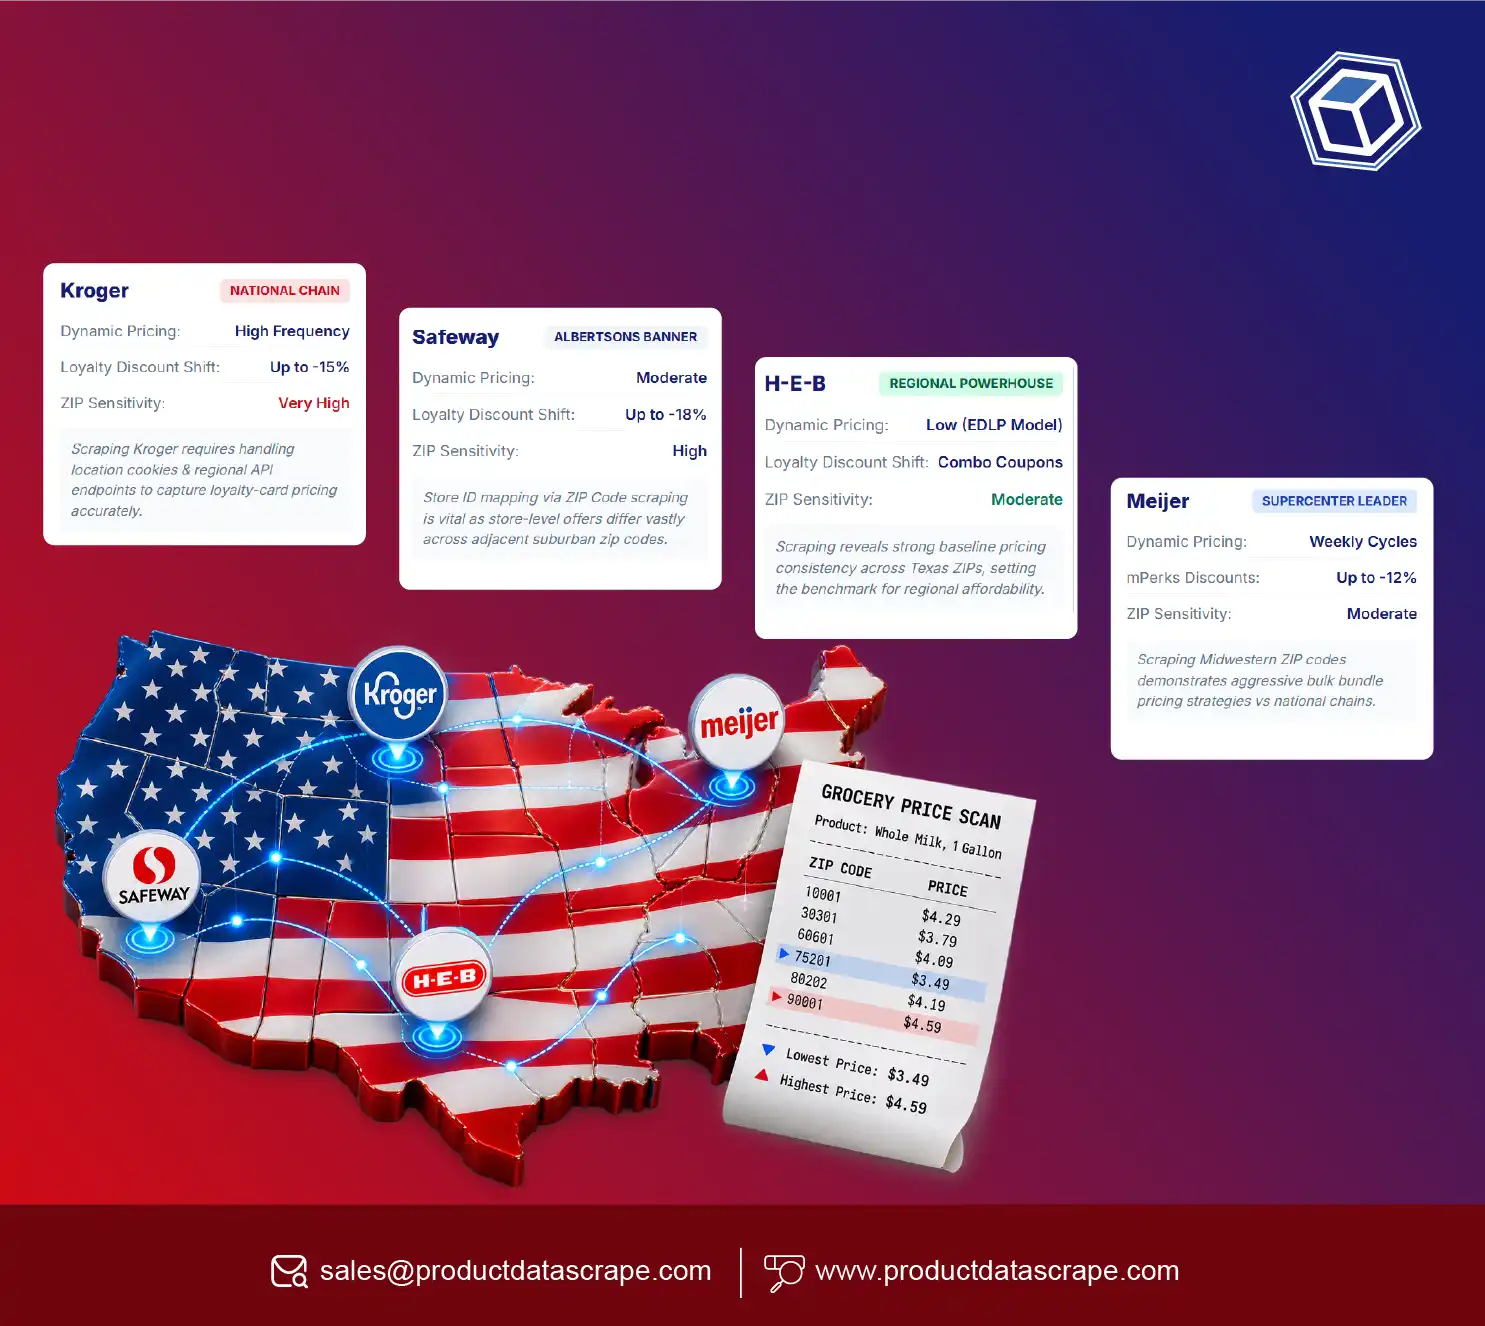
Hyperlocal pricing intelligence becomes especially useful when comparing major U.S. grocery chains such as Kroger, Safeway, H-E-B, and Meijer. A product may have different advertised prices, promotional conditions, or availability across store locations. Comparing records for equivalent products helps analysts identify differences that may otherwise be hidden in broad market reports.
The USDA's Economic Research Service reported that U.S. food-at-home prices increased 11.4% in 2022, followed by slower annual increases in subsequent years. Its 2026 outlook projects a further increase in grocery prices, illustrating why ongoing monitoring remains relevant. These national figures establish context; they do not show the actual price difference between individual stores.
For grocery businesses, the objective is to create a consistent, location-aware dataset that supports pricing decisions, promotional research, and assortment analysis. Product Data Scrape can structure a research workflow around permitted sources, verified product matches, timestamps, and comparable store-level observations.
Why Do Grocery Prices Need to Be Compared by Location?
scrape grocery store prices by ZIP to understand how the advertised cost of equivalent products varies across defined local markets. A ZIP code can help identify the intended shopping area, but it does not automatically establish the exact store, delivery zone, or price applicable to a customer. Researchers should associate each observation with the relevant store identifier and verify the location selected on the retailer's platform.
Regional comparison is important because national grocery inflation figures describe average price movements rather than individual retail offers. The USDA reported that food-at-home prices rose sharply in 2022, while annual price growth slowed in 2023 and 2024. In 2025, the category increased again, according to the agency's historical series.
| Year |
U.S. food-at-home price change |
Data status |
| 2020 |
+3.5% |
Historical USDA estimate |
| 2021 |
+3.5% |
Historical USDA estimate |
| 2022 |
+11.4% |
Historical actual |
| 2023 |
+5.0% |
Historical actual |
| 2024 |
+1.2% |
Historical actual |
| 2025 |
+2.3% |
Historical actual |
| 2026 |
+2.4% |
USDA annual forecast published in September 2026 |
Source: USDA Economic Research Service, Food Price Outlook. The 2026 figure is a forecast, not a final annual result.
For a retailer such as Safeway, Safeway Grocery Data Scraping should mean gathering information only through authorized methods and within applicable access terms. A useful comparison record includes the product name, brand, package size, unit price, promotional price, store location, and retrieval timestamp, when these fields are available and permitted.
The key is product equivalence. Comparing a 12-ounce package with a 16-ounce package without normalizing the unit price can produce a misleading conclusion. Location-level comparisons should therefore standardize package sizes and clearly distinguish regular prices from temporary promotions.
How Can Retailers Compare Local Prices Across Different Chains?
To compare grocery chains fairly, analysts need a consistent product-matching process. Scrape Kroger prices by ZIP code using authorized data access and associate each observation with a specific store or supported service area. The same methodology can then be applied to Safeway, H-E-B, and Meijer, provided the relevant information is accessible under each retailer's terms.
A useful comparison starts with products that can be matched by brand, product name, package quantity, and variant. UPC or GTIN identifiers can strengthen matching when they are available. If a retailer does not publish a common identifier, analysts should record the matching method and flag uncertain matches for review.
Meijer customer feedback and product reviews answer different questions from price data. Meijer supermarket review scraping should be considered separately from price monitoring and undertaken only where collection and reuse are permitted. Review information may provide qualitative context, but a review score should never be treated as evidence that one retailer has lower prices.
| Comparison field |
Why it matters |
| Retailer and store ID |
Identifies the actual comparison location |
| ZIP code or service area |
Documents the requested market |
| Product identifier |
Helps match equivalent products |
| Package size |
Prevents misleading comparisons |
| Regular price |
Establishes a baseline when available |
| Promotional price |
Captures a time-limited offer |
| Unit price |
Supports comparisons across package sizes |
| Availability status |
Distinguishes listed products from unavailable items |
| Collection timestamp |
Makes the observation traceable |
For example, an analyst may compare the same branded cereal at two locations only after verifying its size and product variant. If one location offers a temporary discount, that observation should be recorded separately from the standard price. Out-of-stock items should not be assigned a price based on another location.
This methodology helps grocery retailers and brands distinguish genuine price differences from differences caused by package size, product substitutions, or promotional conditions.
What Can Location-Based Data Reveal About Regional Grocery Markets?
Track Meijer Grocery Price Data by location to investigate how selected products, offers, and availability change across the store locations included in an authorized research project. Location-based observations can help analysts assess whether a price difference appears consistently across several stores or is limited to one location and collection date.
The USDA's food-price series demonstrates that grocery inflation can change significantly from year to year. Its data show a peak in food-at-home inflation in 2022, followed by substantially slower increases in 2023 and 2024. However, national inflation does not explain every local price movement. Retail promotions, product mix, regional supply conditions, and differences between comparable products may all affect individual observations.
| Period |
National grocery-price context |
How analysts can use it |
| 2020–2021 |
Food-at-home prices increased 3.5% annually in each year |
Establish a pre-peak comparison period |
| 2022 |
Food-at-home prices increased 11.4% |
Identify the period of unusually high national inflation |
| 2023 |
Prices increased 5.0% |
Compare local observations during slower inflation |
| 2024 |
Prices increased 1.2% |
Examine changes during a lower-inflation year |
| 2025 |
Prices increased 2.3% |
Extend historical analysis using reported results |
| 2026 |
USDA forecast a 2.4% annual increase in September |
Treat as an outlook until full-year data are available |
Source: USDA Food Price Outlook.
An FMCG & Food Scraper project should prioritize consistent product identifiers, units, and collection intervals. Analysts can then calculate price differences for matched products and summarize the results by retailer, store, product category, or ZIP code. These are research methods, not guarantees that a retailer will have a particular price or stock level.
A strong report also includes the sample size and coverage period. If observations cover only selected stores, the results should not be generalized to every Meijer location. Repeated measurements help separate temporary promotions from persistent differences, while documented collection times help explain changes in the results.
How Can Multiple ZIP Codes Be Monitored Without Confusing Prices?
A multi-location monitoring process should treat each store and collection time as a distinct observation. grocery price scraper for multiple ZIP codes workflows can organize permitted data by location, product, package size, and offer type. This creates a structured foundation for comparing regional pricing patterns and identifying gaps in the dataset.
The first step is to define the ZIP codes and the stores associated with each market. ZIP codes alone may be insufficient because a retailer's selected store, delivery area, or pickup service can determine which products and prices are displayed. Analysts should therefore preserve the actual store or service-area context where the source makes it available.
Scrape Store-Specific Grocery Prices by ZIP Code using a repeatable schema. A useful record should include the retailer, store identifier, ZIP code, product identifier, displayed price, unit price where calculable, promotion details, availability status, and timestamp. If a field is not available, it should remain missing rather than be inferred.
| Monitoring step |
Recommended action |
Quality safeguard |
| Define coverage |
Select ZIP codes and relevant stores |
Document locations included |
| Match products |
Use identifiers and package attributes |
Flag uncertain matches |
| Capture prices |
Record displayed prices and offers |
Preserve source and timestamp |
| Normalize units |
Calculate comparable unit prices |
Keep original package size |
| Check availability |
Record the source's stated status |
Avoid inferring stock from missing listings |
| Compare observations |
Group by retailer, store, and date |
Separate promotions from regular prices |
For reporting, teams can calculate the percentage difference between two matched prices using a clearly identified reference price. They can also measure how frequently a product is unavailable within the sample. These calculations should use observed values only and state whether prices include membership discounts, delivery charges, taxes, or other conditions.
The outcome is a more reliable regional comparison. It allows pricing teams to see where further investigation is needed without confusing national inflation, store-specific offers, and product-matching errors.
How Can H-E-B Product Catalogs Be Compared Across Stores?
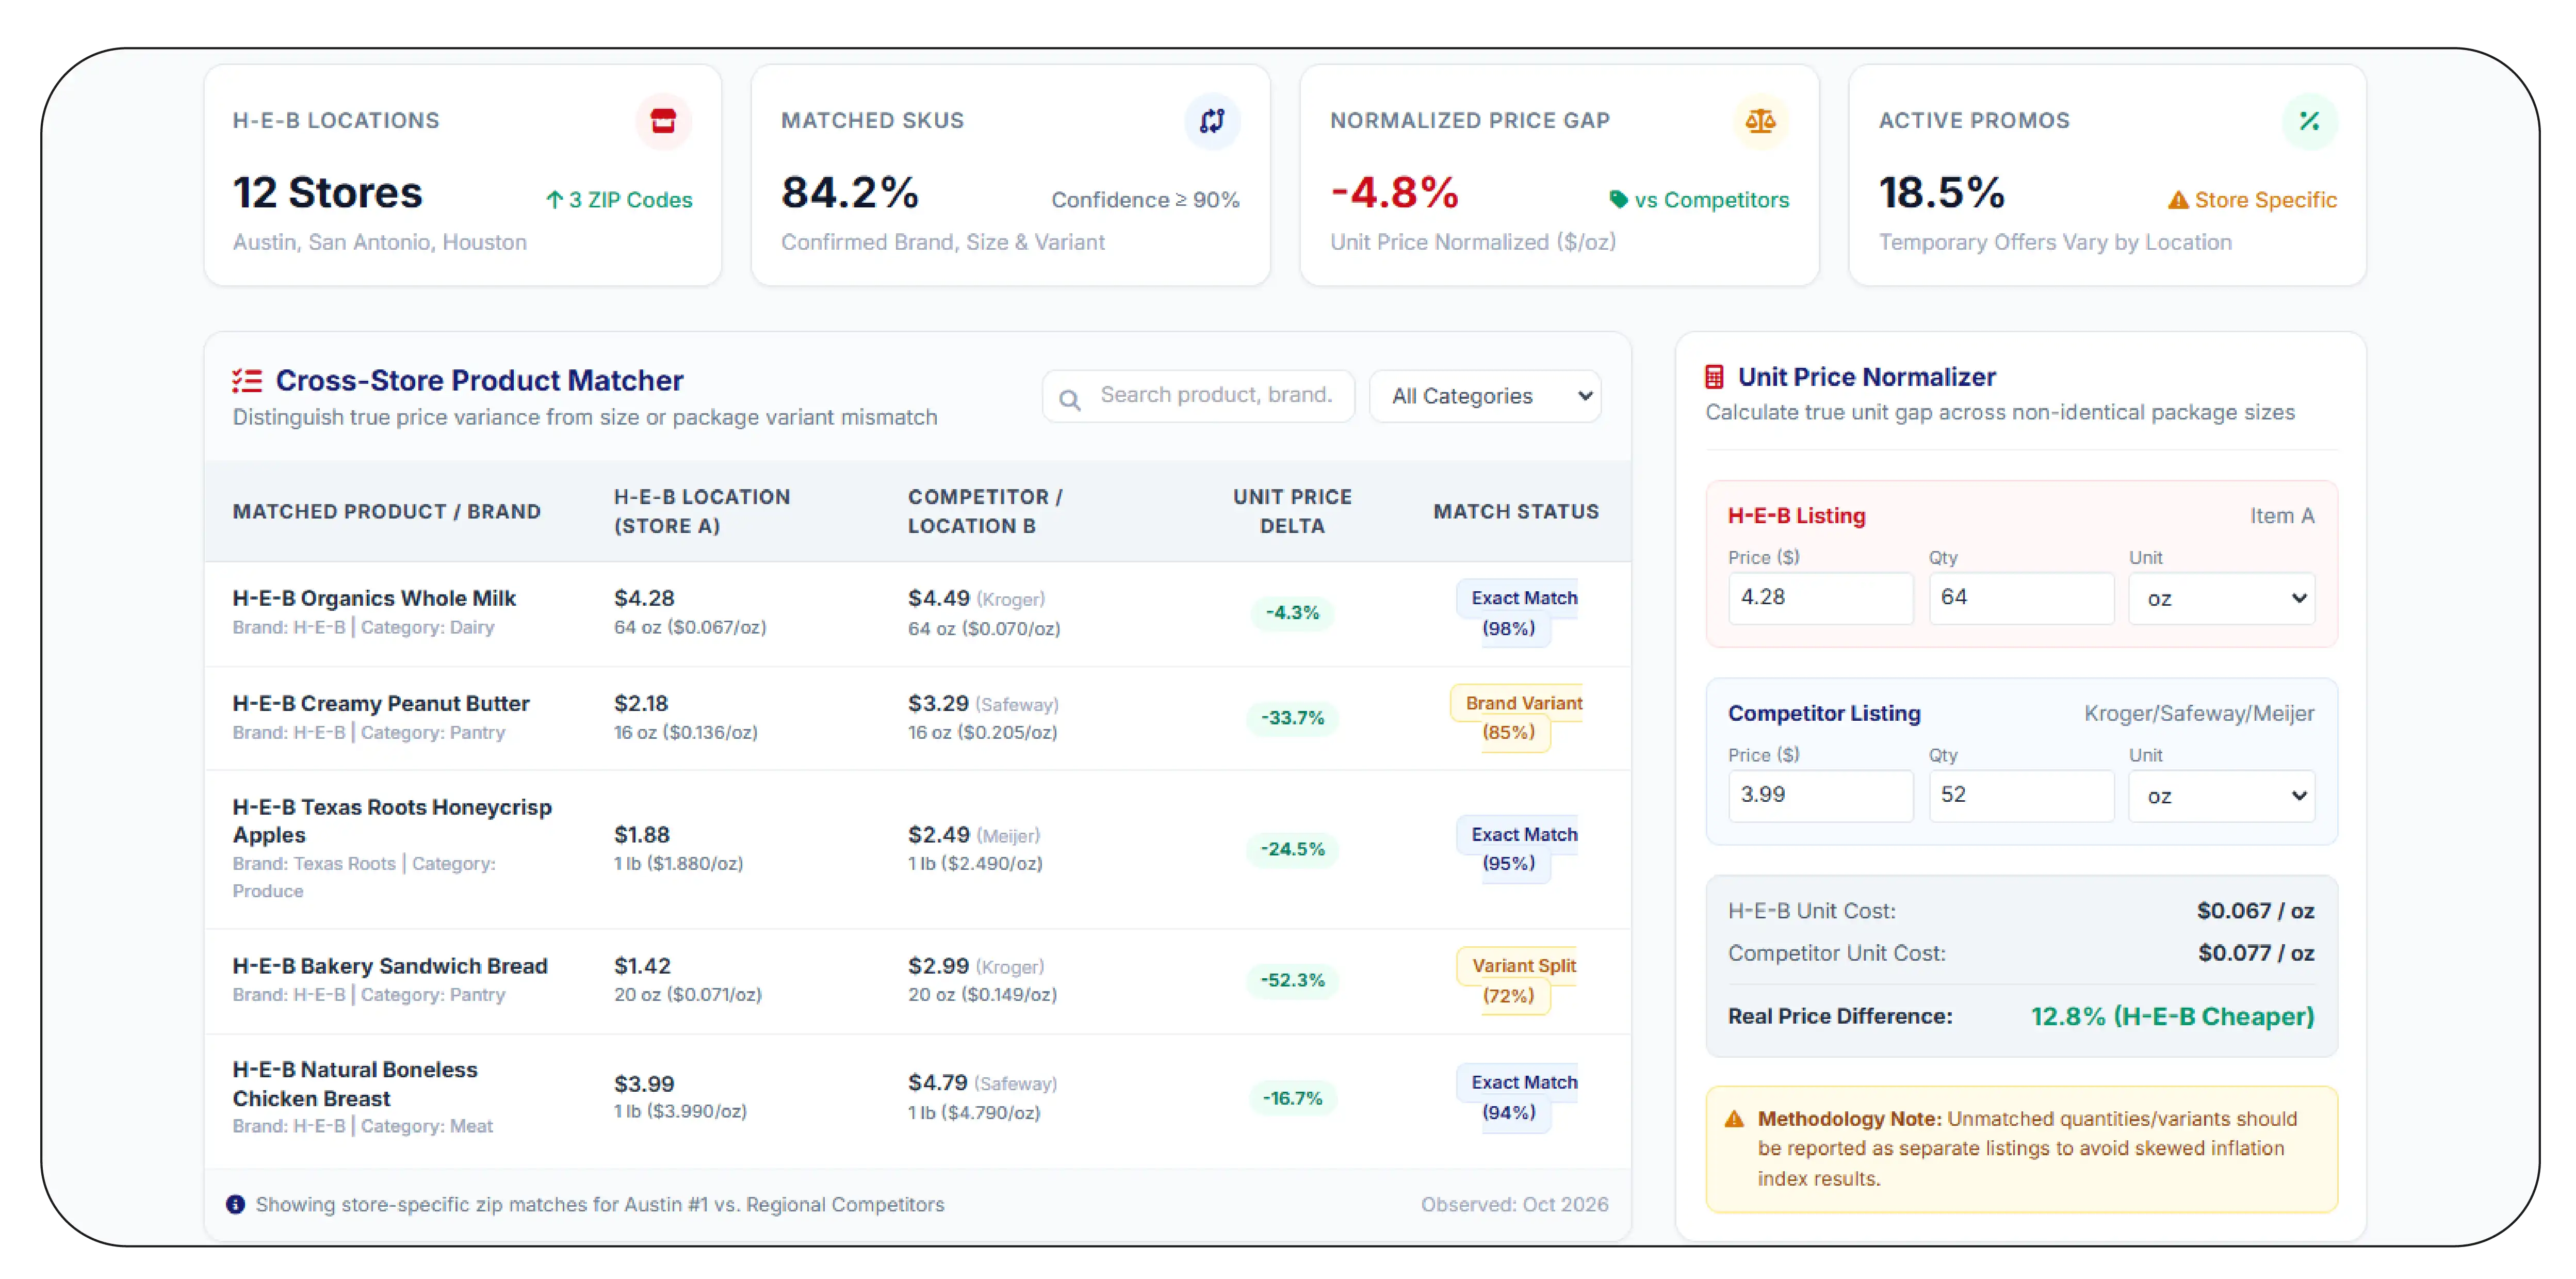
H-E-B store-specific catalog extraction can support research into listed product ranges, package details, advertised prices, and availability where the information is accessible through authorized channels. Catalog analysis helps distinguish a true price difference from an assortment difference—for example, when one location lists a different package size or product variant.
H-E-B operates in a regional market, so a store-specific study should document which locations were included and which product categories were compared. Analysts should not assume that the same product assortment or promotional offer appears at every store. They should also record whether the source represents pickup, delivery, or another shopping context, because those conditions may affect what is displayed.
Scrape Store-Specific Grocery Prices by ZIP Code to build comparisons between matched H-E-B products and comparable listings at Kroger, Safeway, or Meijer. Before calculating a price gap, confirm the brand, quantity, unit, and variant. Where products cannot be matched confidently, report them as separate listings rather than treating them as equivalent.
| Catalog attribute |
Analytical purpose |
| Product name and brand |
Identifies the listed item |
| Package quantity and unit |
Supports unit-price normalization |
| Product identifier, when available |
Strengthens product matching |
| Displayed price |
Captures the observed listing |
| Promotion conditions |
Distinguishes temporary offers |
| Store or service area |
Defines the geographic context |
| Availability indicator |
Records the source's stated status |
| Observation date |
Supports historical comparison |
The USDA's national price statistics provide context for broad grocery inflation but do not establish H-E-B's store-level prices. Actual local comparisons require dated observations from the selected stores. This distinction is especially important when presenting a price index or reporting the lowest-priced retailer.
Catalog monitoring can also reveal missing attributes and changes in product coverage. However, a missing listing does not necessarily mean a product is permanently discontinued or unavailable in-store. The source, access method, and limitations should be documented in every report.
How Can Safeway Pricing and Promotions Be Tracked Over Time?
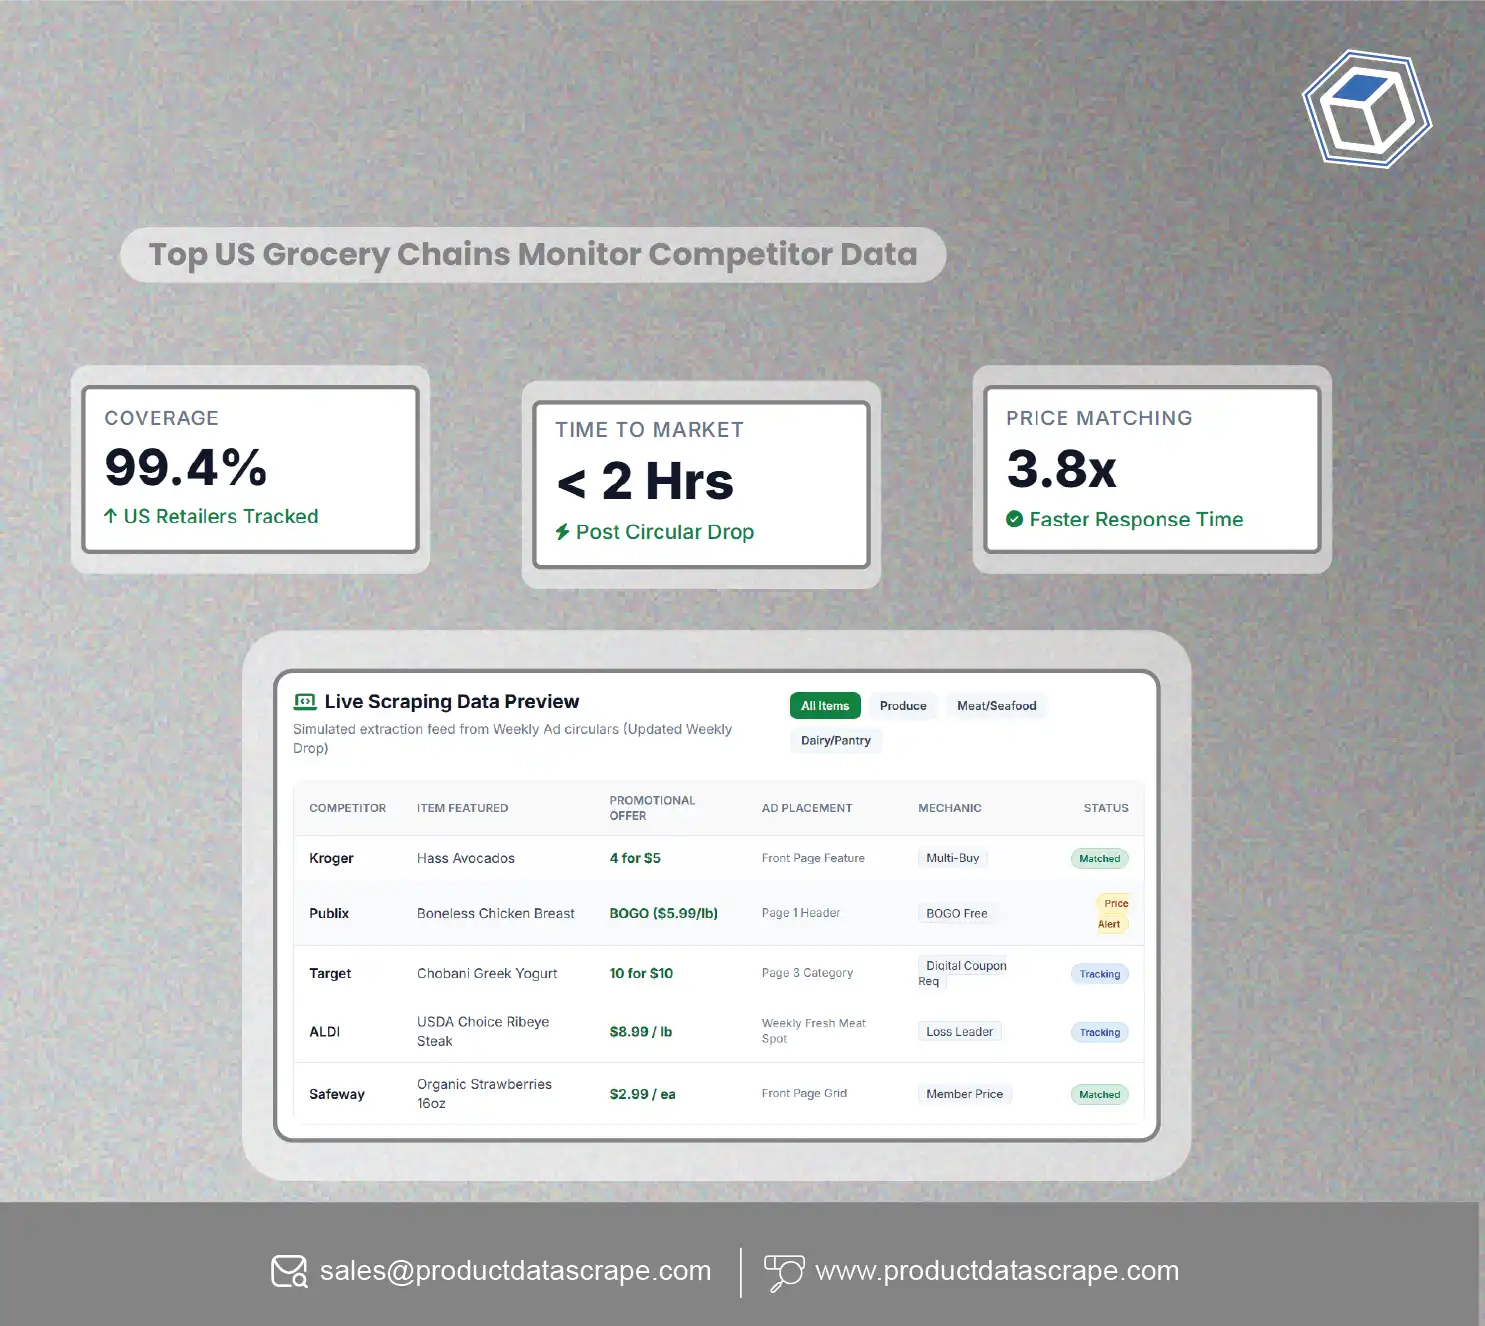
scrape Safeway prices by store through permitted access methods to compare the same products across selected locations and collection dates. Historical observations can help analysts distinguish short-term discounts from broader changes in displayed prices. They can also support research into how promotional availability differs by location, provided the underlying records are comparable.
Safeway is part of Albertsons Companies. Company financial reporting and USDA price statistics can provide background on the grocery sector, but neither should be used as a substitute for store-level price observations. National inflation describes broad price movement, while a local price record describes a particular product at a particular location and time.
Scrape Store-Specific Grocery Prices by ZIP Code using a consistent capture schedule and a defined product list. For every observation, preserve the retailer, store, product identifier, package size, price, offer terms, and timestamp where available. If a promotional price requires a loyalty account or coupon, record that condition rather than presenting it as universally available.
| Monitoring measure |
How to interpret it |
| Regular-price change |
Difference between comparable regular-price observations |
| Promotional frequency |
How often a product is observed on promotion during the study |
| Unit-price difference |
Price difference after normalizing package quantity |
| Availability coverage |
Share of monitored observations with a listed availability status |
| Price spread |
Difference between the highest and lowest matched prices in the sample |
| Data freshness |
Time elapsed since the latest verified observation |
A promotion study should use consistent intervals and explicitly define its observation window. If a price changes between two checks, the data alone may not reveal why. Analysts should avoid attributing a change to competitor behavior or supply costs without supporting evidence.
The most useful output is a transparent comparison report showing the matched products, selected locations, collection dates, pricing conditions, and limitations. This gives retail and consumer-goods teams a practical basis for further analysis without overstating what the data proves.
Why Choose Product Data Scrape?
Product Data Scrape can be considered for structured grocery-data projects that need clear field definitions, consistent product matching, and location-aware reporting. Grocery data scraping should be conducted only through permitted sources and in accordance with applicable terms and laws.
A well-scoped project can organize product names, identifiers, package sizes, displayed prices, promotions, store locations, and timestamps where those fields are available. Quality checks can flag duplicate records, missing values, and uncertain product matches before analysis.
For teams that need Scrape Store-Specific Grocery Prices by ZIP Code, the scope should specify selected retailers, ZIP codes, collection frequency, required fields, and delivery format. Findings should be based on observed data, not estimated store prices. Source permissions and data-retention requirements should be confirmed before work begins.
Conclusion
Store-level grocery comparisons are most reliable when they use matched products, verified store locations, comparable package sizes, and dated price observations. Kroger Store Locations & Competitors research can help teams organize a regional study, while comparisons with Safeway, H-E-B, and Meijer require equivalent product and location definitions.
Scrape Store-Specific Grocery Prices by ZIP Code to build a clearer view of local prices, promotions, and assortment differences using authorized data sources. National USDA inflation figures provide context, but store-level findings must come from verified observations.
Ready to improve your grocery pricing research? Contact Product Data Scrape to discuss a compliant, structured data workflow tailored to your retailers, locations, and reporting needs!
Frequently Asked Questions
1. Why compare grocery prices by ZIP code?
ZIP-based analysis helps organize prices by local market, but researchers should verify the actual store, shopping method, product size, and timestamp before drawing comparisons.
2. Can grocery prices differ between stores in the same chain?
Yes, displayed prices and promotions may vary by location or shopping conditions. Verify each store's current listing rather than assuming a chain-wide price applies everywhere.
3. What data is useful for grocery price comparisons?
Useful fields include product identifiers, brand, package size, displayed price, unit price, promotion conditions, store location, availability status, and collection timestamp, where available.
4. How often should store-level grocery prices be monitored?
The appropriate frequency depends on the research goal and permitted access. Define a consistent schedule, preserve timestamps, and distinguish temporary promotions from longer-term price changes.
5. Is automated grocery data collection always allowed?
No. Product Data Scrape projects should confirm that each source and collection method is permitted, respect applicable terms and laws, and avoid collecting unnecessary personal information.


 Singapore
 EMAIL
 PHONE










.webp)