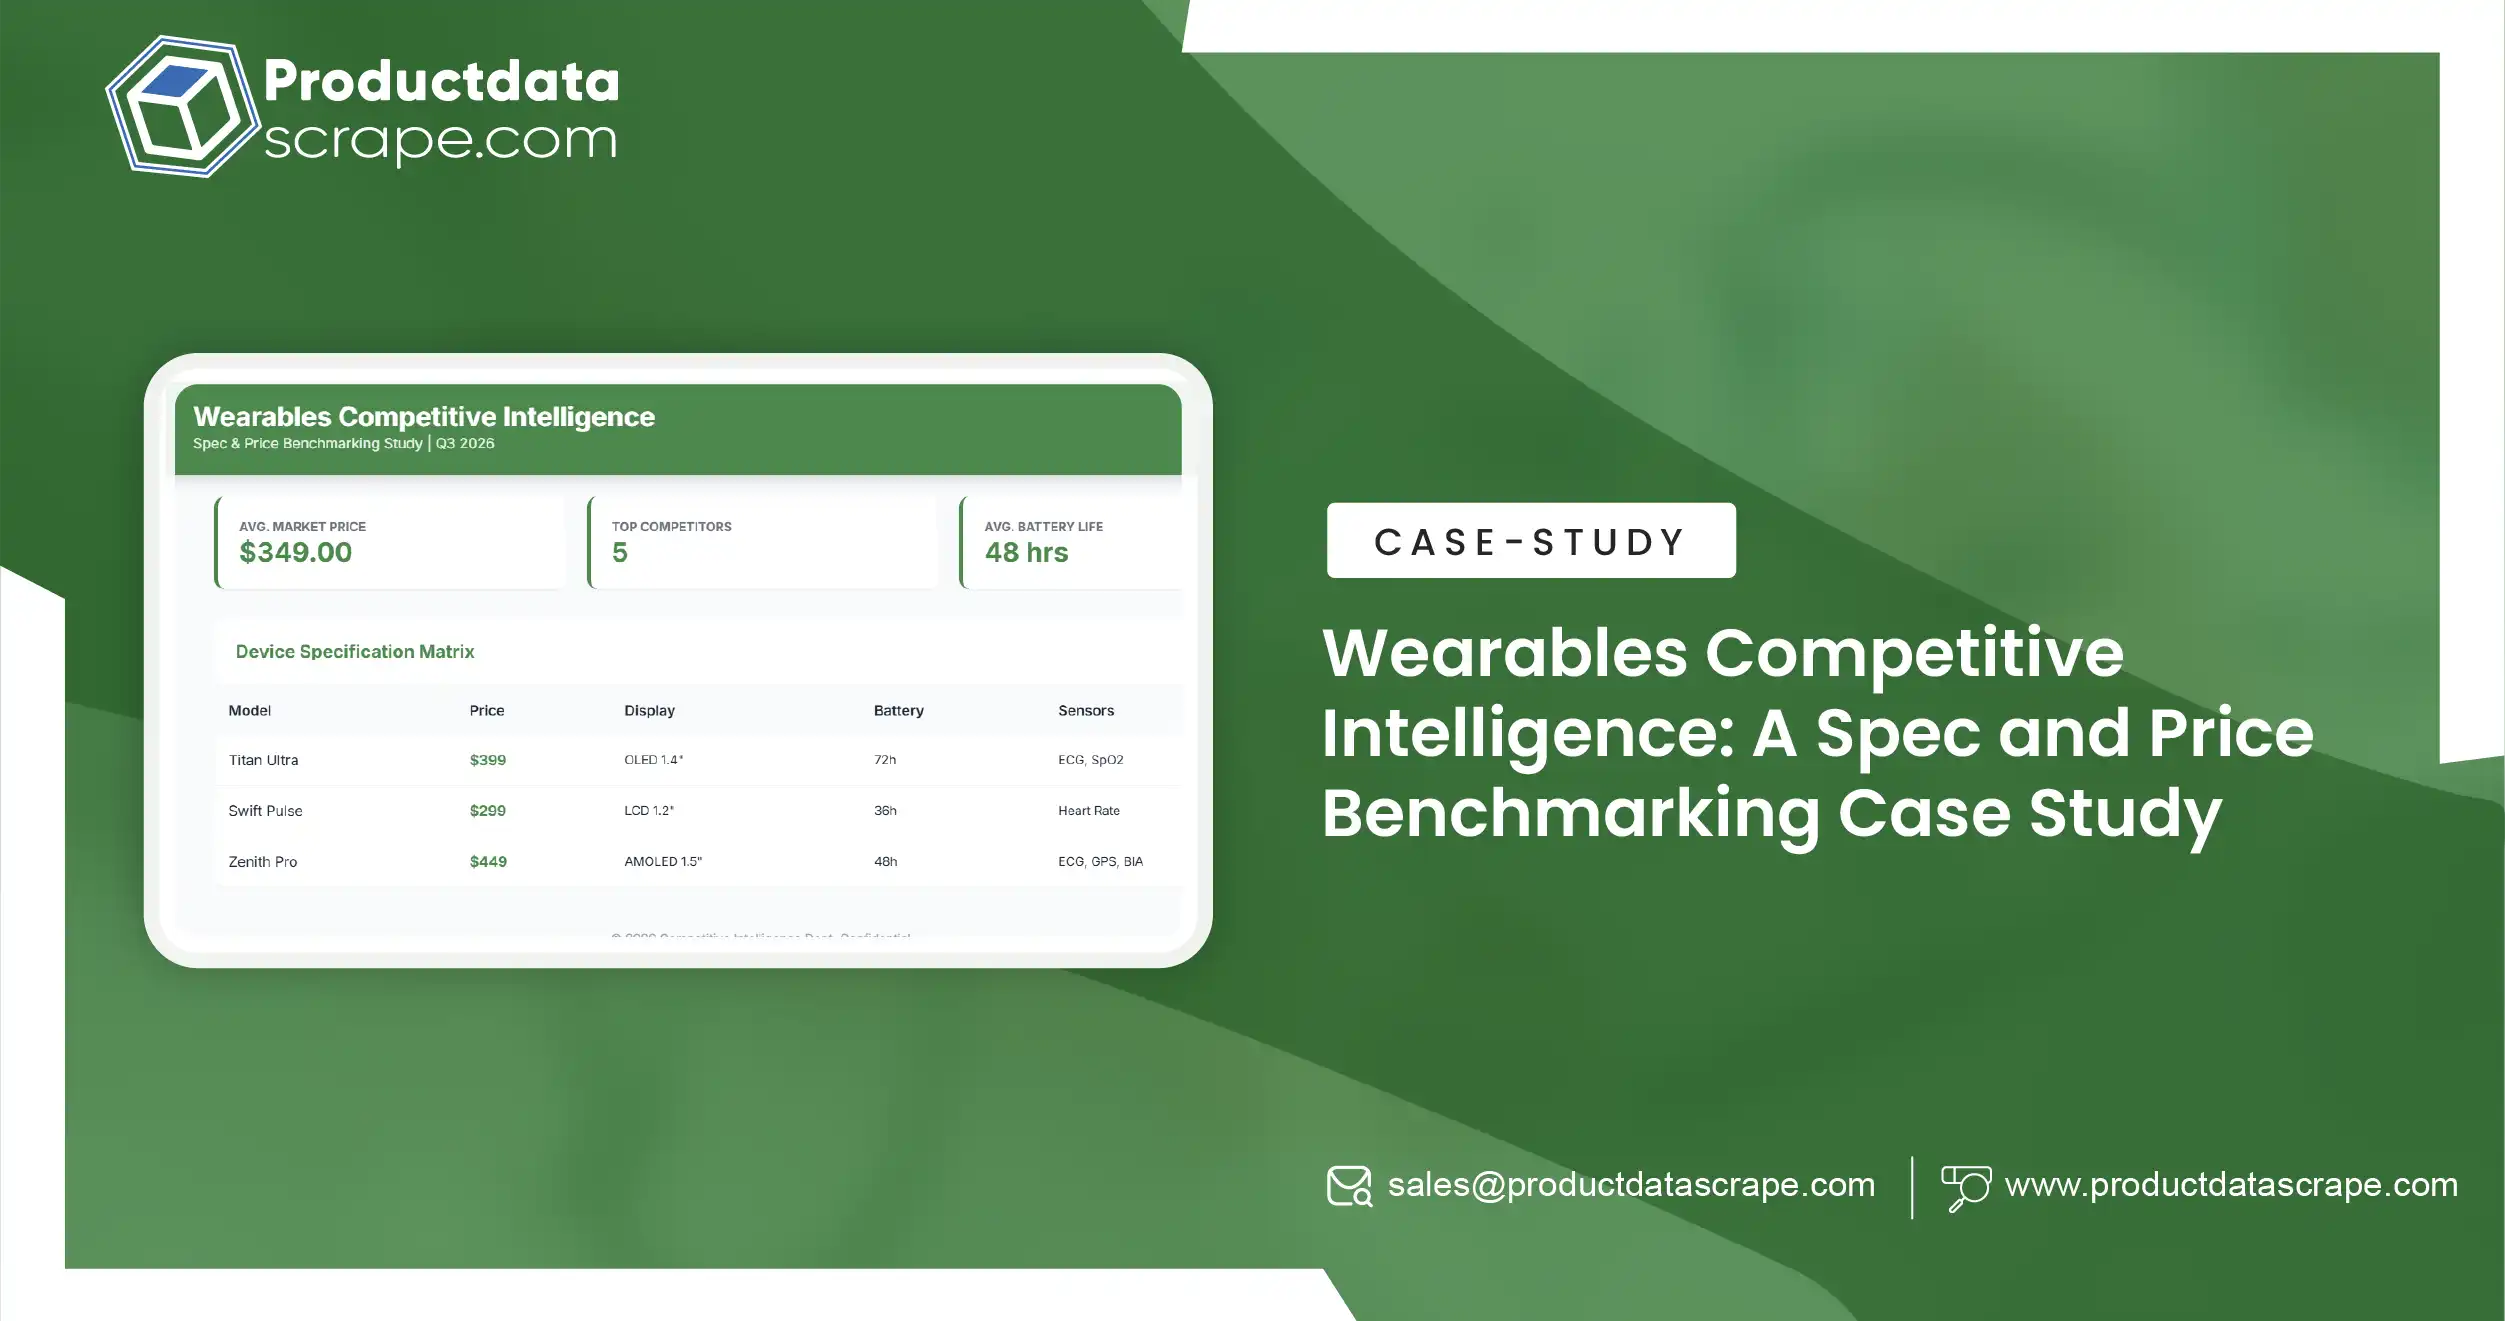
Wearables Competitive Intelligence: A Spec and Price Benchmarking Case Study

The Client

A wearables brand — fitness trackers and smartwatches — competing in a fast-moving category where products are compared feature by feature and priced against a dense field of rivals. It sold across major marketplaces and its own site.

Client details are anonymised. Figures are representative of the engagement.

The Problem: Pricing Features Without Knowing What Features Cost

The Problem

The brand set prices for its wearables based on internal cost and rough competitive sense, and kept getting the feature-price relationship wrong. On some models it charged a premium for a feature set that competitors offered for less. On others it under-priced a genuinely superior specification and left margin on the table.

The category is unusually spec-driven — shoppers and comparison sites line up battery life, sensor suites, display type, water resistance, and price side by side. The brand competed in this comparison every day and had no systematic map of it. It knew its own specs and prices. It did not know, across the field, what the market charged for a given capability — what an AMOLED display, or an SpO2 sensor, or a 14-day battery actually added to the going price.

The product lead's summary: we're pricing features blind. We don't know what the market pays for a spec, so half the time we're too expensive and half the time we're leaving money on the table.

Why This Was Hard to See

Feature-price mapping across a category is a structured-data problem the brand had no way to solve manually.

Specs are scattered and inconsistent. Battery life, sensors, display, and water resistance are stated differently across listings — different units, different phrasings, sometimes only in images. Comparing them across dozens of models means extracting and normalising specifications at scale.

The feature-price relationship is invisible without the whole field. Knowing what a feature "costs" in the market requires seeing many products with and without it, at their prices, and inferring the relationship. Two or three hand-picked competitors cannot reveal it; the pattern only emerges across the field.

It moves constantly. New models launch, specs improve, and prices shift. A snapshot ages quickly in wearables.

Positioning gaps hide in the comparison. Whether the brand was over- or under-priced for its spec was only visible by placing every model on the same feature-and-price map — which the brand had never built.

The Solution: Spec and Price Benchmarking
The Solution

Product Data Scrape built wearables competitive intelligence across the category — every relevant model, its full specification, and its price, on one normalised map.

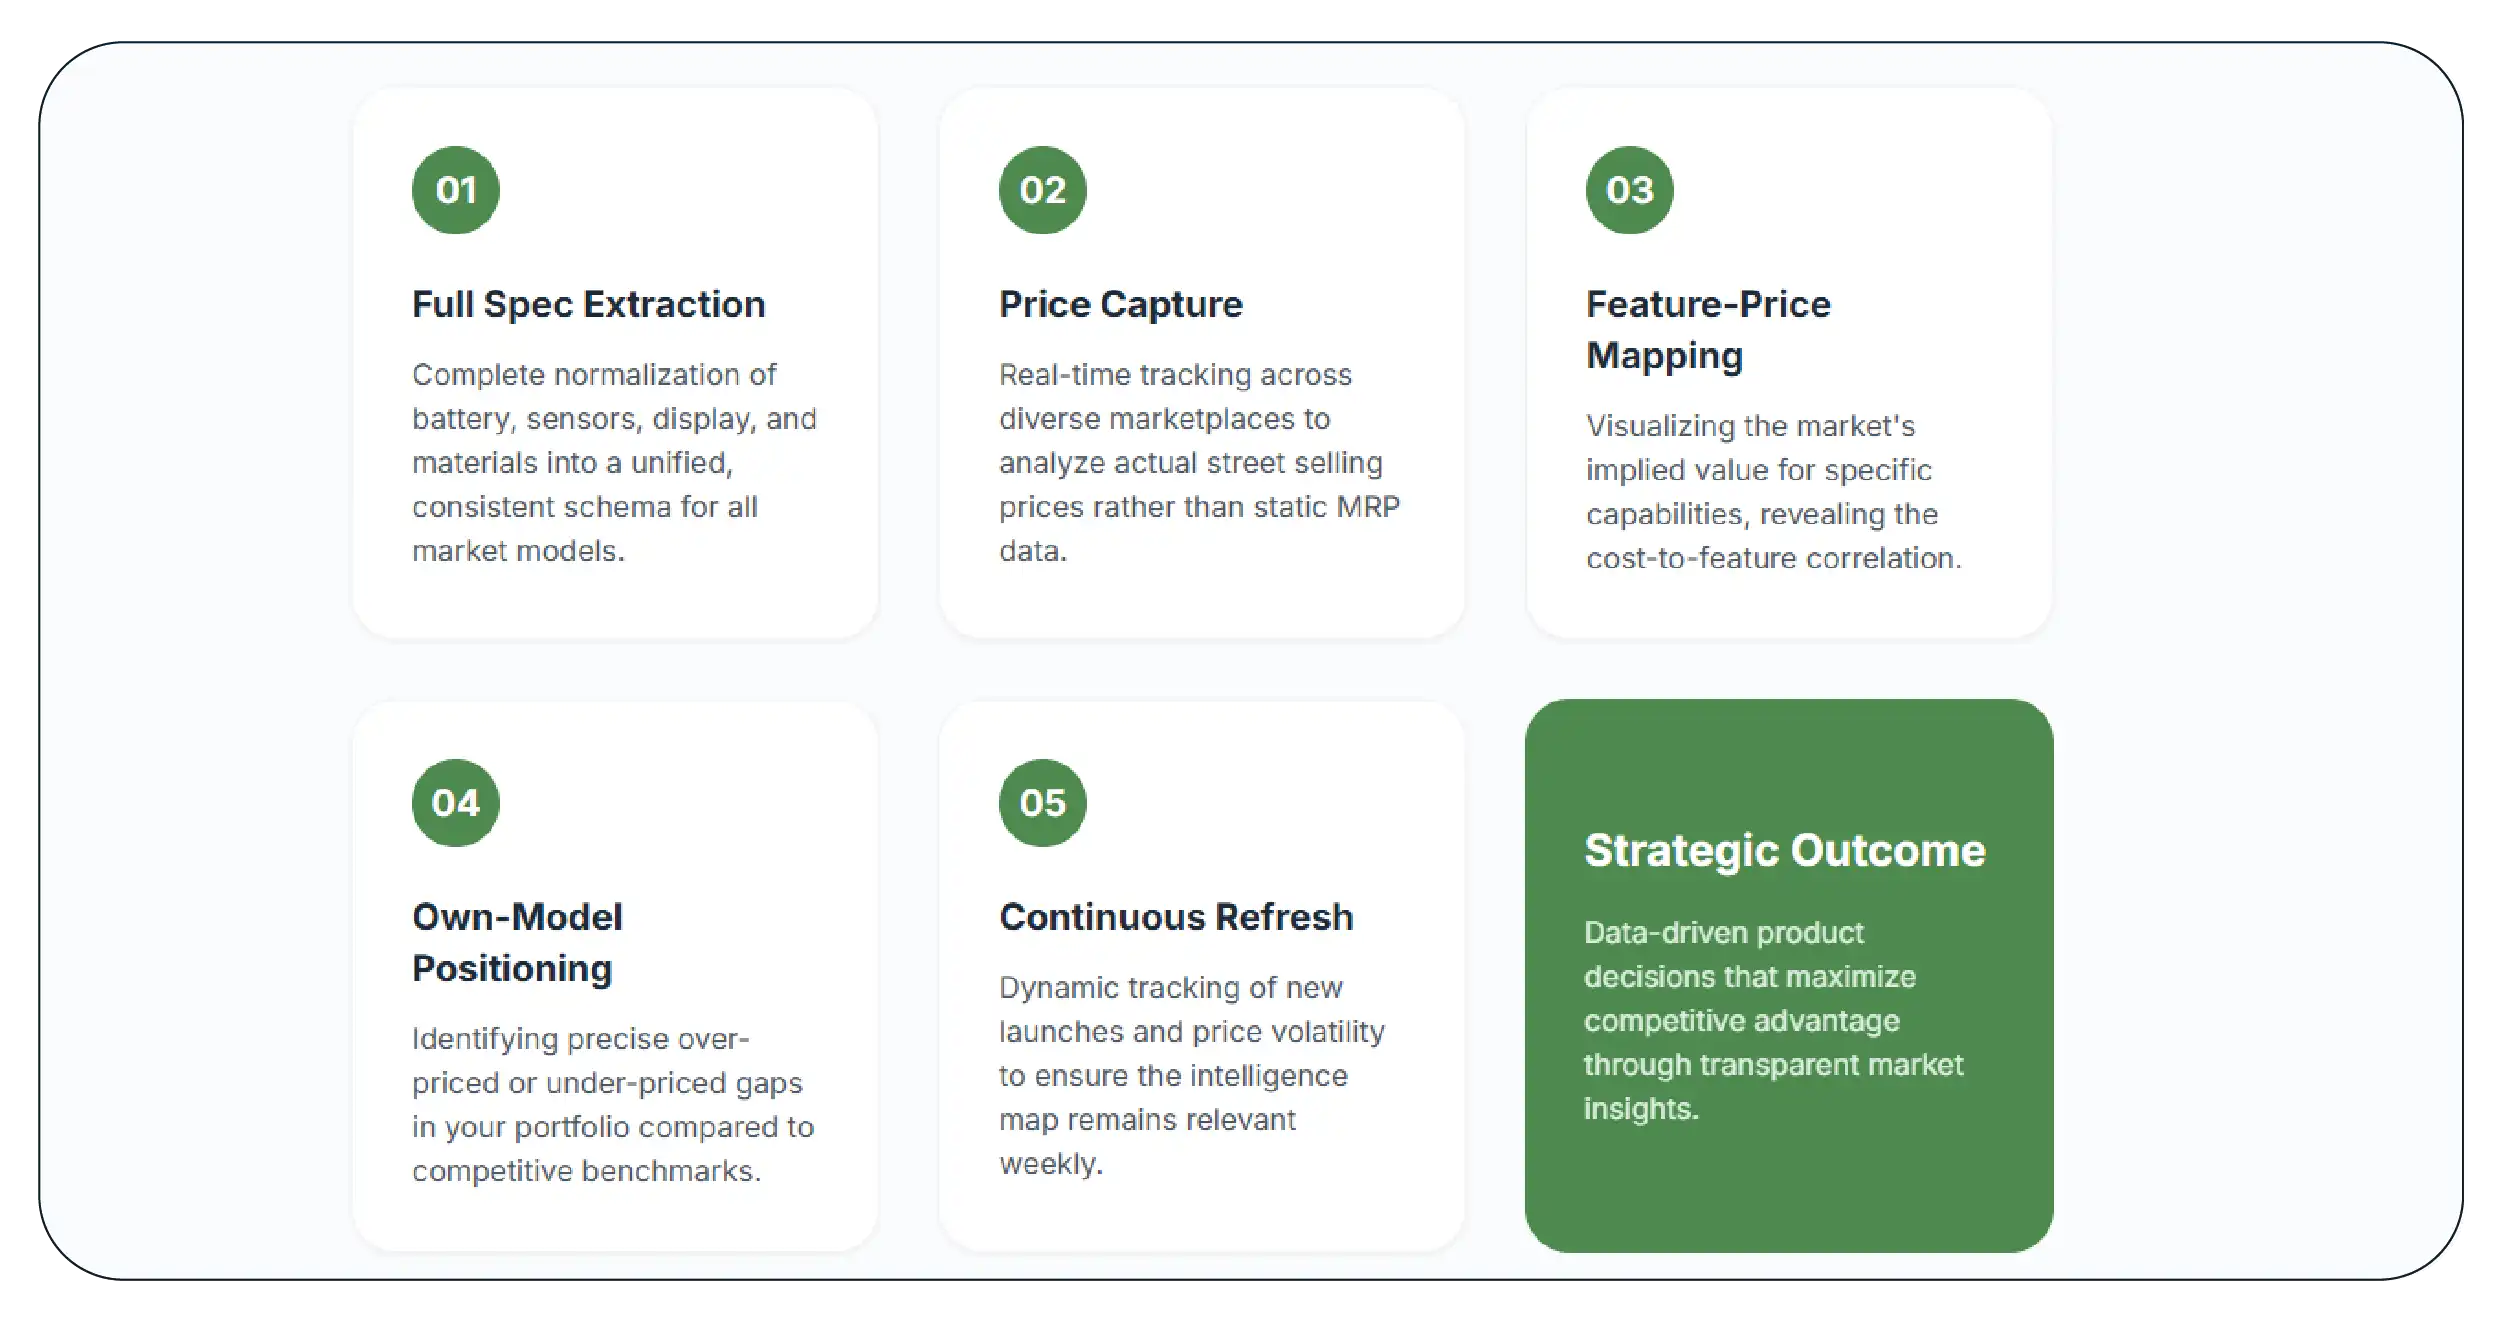
  • Full spec extraction. For every model — the brand's and competitors' — the complete specification was captured and normalised: battery life, sensor suite, display type and size, water resistance, connectivity, and materials, drawn from listings and imagery into a consistent schema.
  • Price capture across marketplaces. Each model's price was captured across marketplaces, so the spec sat next to its actual selling price, not its MRP.
  • Feature-price mapping. With the whole field on one schema, the market's implied price for each capability became visible — what having (versus lacking) a given sensor, display, or battery tier was associated with in price across the category.
  • Own-model positioning. Each of the brand's models was placed on the map against comparable competitors, showing precisely where it was over-priced for its spec and where it was under-priced.
  • Continuous refresh. New launches and price moves were tracked, keeping the map current in a category that changes weekly.

Sample Data: The Spec-Price Map

An illustrative spec-and-price benchmark for one model tier.

Model Battery Display SpO2 Water Resist Price Spec-for-Price Verdict
Our Model X 10 days LCD Yes 5ATM 4,999 Over-priced for LCD
Competitor A 7 days AMOLED Yes 5ATM 4,799 Strong spec, lower price
Competitor B 14 days LCD No 3ATM 3,499 Battery-led budget
Competitor C 10 days AMOLED Yes 5ATM 5,499 Premium, justified

Illustrative figures.

The structured record:

{
  "model_id": "WEAR-MODEL-X",
  "captured_at": "2026-07-15T11:00:00+05:30",
  "price": 4999,
  "specs": {
    "battery_days": 10,
    "display_type": "lcd",
    "display_size_in": 1.4,
    "spo2": true,
    "heart_rate": true,
    "water_resistance": "5ATM",
    "gps": "connected"
  },
  "positioning": {
    "comparable_models": ["Competitor A", "Competitor C"],
    "verdict": "over_priced_for_display_tier",
    "note": "Competitor A offers AMOLED at 4799 vs our LCD at 4999",
    "implied_market_price_for_this_spec": 4400
  }
}

The finding that reframed the brand's pricing: Model X was priced at 4,999 with an LCD display, while Competitor A offered an AMOLED display — a clear upgrade shoppers value — at 4,799. The brand was charging more for a lesser display in the most visible spec on the comparison. The map's implied market price for Model X's actual specification was around 4,400 — the brand was over-priced by roughly 600 rupees against what its spec commanded.

Elsewhere on the same map, the brand found the opposite: a model with a genuinely superior sensor suite priced at parity with weaker competitors, leaving margin uncaptured.

What the Brand Did

Repriced the over-priced models. Where a model was priced above its spec's market value — like Model X against AMOLED competitors — the brand adjusted price to a defensible position, or accelerated a spec upgrade, rather than continuing to lose the feature-by-feature comparison.

Captured margin on under-priced models. Where a model's spec genuinely beat its price-comparable competitors, the brand raised price toward the value its specification commanded — margin it had been giving away.

Used the map for roadmap decisions. The feature-price relationships informed product planning: which spec upgrades (an AMOLED display, an added sensor) the market actually paid for, and which it didn't, so R&D spend targeted features with pricing power.

Sharpened listing comparisons. On models where the brand's spec was strong, listings were rewritten to foreground the winning specs against the comparison field.

The Results (Two Quarters)

Metric Before After Two Quarters
Models over-priced for spec Several Repriced or upgraded
Models under-priced (margin left) Several Margin captured
Feature-price decisions made on data None Pricing and roadmap
Win rate in feature-by-feature comparison Inconsistent Improved on repositioned models
Blended wearables margin, indexed 100 116
Wearables revenue, indexed 100 122

Figures are representative of the engagement outcome.

The product lead's follow-up: we were guessing what features were worth. Now we know what the market pays for each one — and we price and build accordingly.

The Lesson

In a spec-driven category, price and specification cannot be set separately, because customers evaluate them together, feature by feature, against the whole field. A brand that prices on internal cost and rough sense will systematically get the relationship wrong in both directions — over-charging for a spec the market values less, under-charging for one it values more — and both errors cost money, one in lost sales and one in lost margin.

Building the feature-price map did not require the brand to guess better. It made the market's actual pricing of each capability visible, so the brand could price every model to its true competitive position and aim its roadmap at the features shoppers actually pay for. In wearables, that map is the difference between pricing features blind and pricing them right.

Work With Product Data Scrape

Product Data Scrape delivers wearables competitive intelligence: full specification extraction and normalisation, cross-marketplace price capture, feature-price mapping across the field, and per-model positioning against comparable competitors — as JSON, CSV, API, or dashboard-ready feeds.

Ask us to build the spec-price map for your category — we will show you which models you over-price for their spec and which you under-price.

Product Data Scrape — turning marketplace complexity into decision-ready data.

LATEST BLOG

Flipkart Bank Offers Data: Scraping EMI, Exchange, and Discount Terms to Calculate Effective Consumer Price

Flipkart bank offers data, no-cost EMI and exchange discounts decide what a customer really pays. Learn which fields to capture and how to compute effective price.

How Food Delivery Business Data Before Launch Helps Optimize Pricing, Delivery Zones, and Customer Demand

Food Delivery Business Data Before Launch helps analyze demand, competitors, pricing, and delivery zones for a successful market entry.

Analyze Zomato Delivery Pricing Before Opening a Restaurant - A Complete Guide to Smarter Restaurant Launch Planning

Analyze Zomato Delivery Pricing Before Opening a Restaurant to optimize menu pricing, delivery costs, profits, and market positioning.

Case Studies

Discover our scraping success through detailed case studies across various industries and applications.

WHY CHOOSE US?

Product Data Scrape for Retail Web Scraping

Choose Product Data Scrape to access accurate data, enhance decision-making, and boost your online sales strategy effectively.

Reliable Insights

Reliable Insights

With our Retail Data scraping services, you gain reliable insights that empower you to make informed decisions based on accurate product data and market trends.

Data Efficiency

Data Efficiency

We help you extract Retail Data product data efficiently, streamlining your processes to ensure timely access to crucial market information and operational speed.

Market Adaptation

Market Adaptation

By leveraging our Retail Data scraping, you can quickly adapt to market changes, giving you a competitive edge with real-time analysis and responsive strategies.

Price Optimization

Price Optimization

Our Retail Data price monitoring tools enable you to stay competitive by adjusting prices dynamically, attracting customers while maximizing your profits effectively.

Competitive Edge

Competitive Edge

THIS IS YOUR KEY BENEFIT.
With our competitive price tracking, you can analyze market positioning and adjust your strategies, responding effectively to competitor actions and pricing in real-time.

Feedback Analysis

Feedback Analysis

Utilizing our Retail Data review scraping, you gain valuable customer insights that help you improve product offerings and enhance overall customer satisfaction.

5-Step Proven Methodology

How We Scrape E-Commerce Data?

01
Identify Target Websites

Identify Target Websites

Begin by selecting the e-commerce websites you want to scrape, focusing on those that provide the most valuable data for your needs.

02
Select Data Points

Select Data Points

Determine the specific data points to extract, such as product names, prices, descriptions, and reviews, to ensure comprehensive insights.

03
Use Scraping Tools

Use Scraping Tools

Utilize web scraping tools or libraries to automate the data extraction process, ensuring efficiency and accuracy in gathering the desired information.

04
Data Cleaning

Data Cleaning

After extraction, clean the data to remove duplicates and irrelevant information, ensuring that the dataset is organized and useful for analysis.

05
Analyze Extracted Data

Analyze Extracted Data

Once cleaned, analyze the extracted e-commerce data to gain insights, identify trends, and make informed decisions that enhance your strategy.

Start Your Data Journey
99.9% Uptime
GDPR Compliant
Real-time API

See the results that matter

Read inspiring client journeys

Discover how our clients achieved success with us.

6X

Conversion Rate Growth

“I used Product Data Scrape to extract Walmart fashion product data, and the results were outstanding. Real-time insights into pricing, trends, and inventory helped me refine my strategy and achieve a 6X increase in conversions. It gave me the competitive edge I needed in the fashion category.”

7X

Sales Velocity Boost

“Through Kroger sales data extraction with Product Data Scrape, we unlocked actionable pricing and promotion insights, achieving a 7X Sales Velocity Boost while maximizing conversions and driving sustainable growth.”

"By using Product Data Scrape to scrape GoPuff prices data, we accelerated our pricing decisions by 4X, improving margins and customer satisfaction."

"Implementing liquor data scraping allowed us to track competitor offerings and optimize assortments. Within three quarters, we achieved a 3X improvement in sales!"

Resource Hub: Explore the Latest Insights and Trends

The Resource Center offers up-to-date case studies, insightful blogs, detailed research reports, and engaging infographics to help you explore valuable insights and data-driven trends effectively.

Get In Touch

Flipkart Bank Offers Data: Scraping EMI, Exchange, and Discount Terms to Calculate Effective Consumer Price

Flipkart bank offers data, no-cost EMI and exchange discounts decide what a customer really pays. Learn which fields to capture and how to compute effective price.

How Food Delivery Business Data Before Launch Helps Optimize Pricing, Delivery Zones, and Customer Demand

Food Delivery Business Data Before Launch helps analyze demand, competitors, pricing, and delivery zones for a successful market entry.

Analyze Zomato Delivery Pricing Before Opening a Restaurant - A Complete Guide to Smarter Restaurant Launch Planning

Analyze Zomato Delivery Pricing Before Opening a Restaurant to optimize menu pricing, delivery costs, profits, and market positioning.

Wearables Competitive Intelligence: A Spec and Price Benchmarking Case Study

Wearables Competitive Intelligence mapped every rival’s specs against its price — showing a brand which features it under-priced and which it charged too much for.

Supplements Pricing and Label Claims Data: How a Brand Monitored Both Across Marketplaces

Supplements Pricing and Label Claims Data let a brand benchmark price per serving and track which claims competitors made — the two levers that move the category

Mobile Accessories Price War: A Dynamic Pricing Case Study Using Mobile Accessories Pricing Data

Mobile Accessories Pricing Data turned a race-to-the-bottom price war into a disciplined dynamic pricing strategy — protecting margin while holding competitive rank.

Albertsons Grocery Delivery Scraper API - Market Intelligence, Inventory Monitoring, and Grocery Retail Benchmarking

ASDA Grocery Data Scraping helps track grocery prices, promotions, inventory, and competitor trends across the UK retail market.

Costco Alcohol & Liquor Price Data scraping to Track Consumer Buying Trends and Inventory Intelligence

Costco Alcohol & Liquor Price Data scraping helps brands track pricing, promotions, inventory trends, and competitor insights.

B&M Stores Pet Supplies Data Scraping for Market Research and Pet Product Trend Analysis in Retail Chains

B&M Stores Pet Supplies Data Scraping helps businesses collect pricing, stock, and product insights to optimize pet retail strategies.

Reducing Returns with Myntra AND AJIO Customer Review Datasets

Analyzed Myntra and AJIO customer review datasets to identify sizing issues, helping brands reduce garment return rates by 8% through data-driven insights.

Before vs After Web Scraping - How E-Commerce Brands Unlock Real Growth

Before vs After Web Scraping: See how e-commerce brands boost growth with real-time data, pricing insights, product tracking, and smarter digital decisions.

Scrape Data From Any Ecommerce Websites

Easily scrape data from any eCommerce website to track prices, monitor competitors, and analyze product trends in real time with Real Data API.

Fresh Citrus Price Wars - Coles vs Aldi — What Does the Data Say?

Fresh Citrus Price Wars — Coles vs Aldi: data-driven comparison of prices, trends, and savings to see which retailer wins on value for shoppers.

Retail Inflation 2025 – Comparing Grocery Baskets in Dubai vs. Abu Dhabi (Noon)

Retail Inflation 2025 – Comparing Grocery Baskets in Dubai vs. Abu Dhabi (Noon) highlights price differences and real-world grocery costs across UAE cities.

Unlock Winning Products on Pinduoduo - How Scraping Bestseller Data Reveals Top Titles, Prices & Sales Trends

Scrape Pinduoduo bestseller data to analyze top-selling products, pricing trends, sales performance, for smarter eCommerce and intelligence decisions.

FAQs

E-Commerce Data Scraping FAQs

Our E-commerce data scraping FAQs provide clear answers to common questions, helping you understand the process and its benefits effectively.

E-commerce scraping services are automated solutions that gather product data from online retailers, providing businesses with valuable insights for decision-making and competitive analysis.

We use advanced web scraping tools to extract e-commerce product data, capturing essential information like prices, descriptions, and availability from multiple sources.

E-commerce data scraping involves collecting data from online platforms to analyze trends and gain insights, helping businesses improve strategies and optimize operations effectively.

E-commerce price monitoring tracks product prices across various platforms in real time, enabling businesses to adjust pricing strategies based on market conditions and competitor actions.

Get a free sample dataset

See the exact fields, accuracy and format — for your products, on your target sites — before you spend a rupee or a dollar.

  • Sample delivered within 24 hours
  • Scoped to your real use case, not a generic demo
  • No obligation, no long contract

Tell us what you need

A specialist replies within one business day.