The Client
A supplements and wellness brand — protein, vitamins, and daily-health formats — selling across major marketplaces and its own D2C site, in a category where two things decide the sale: the price per serving and the claims on the label.
Client details are anonymised. Figures are representative of the engagement.
The Problem: Competing on Two Axes, Measuring Neither
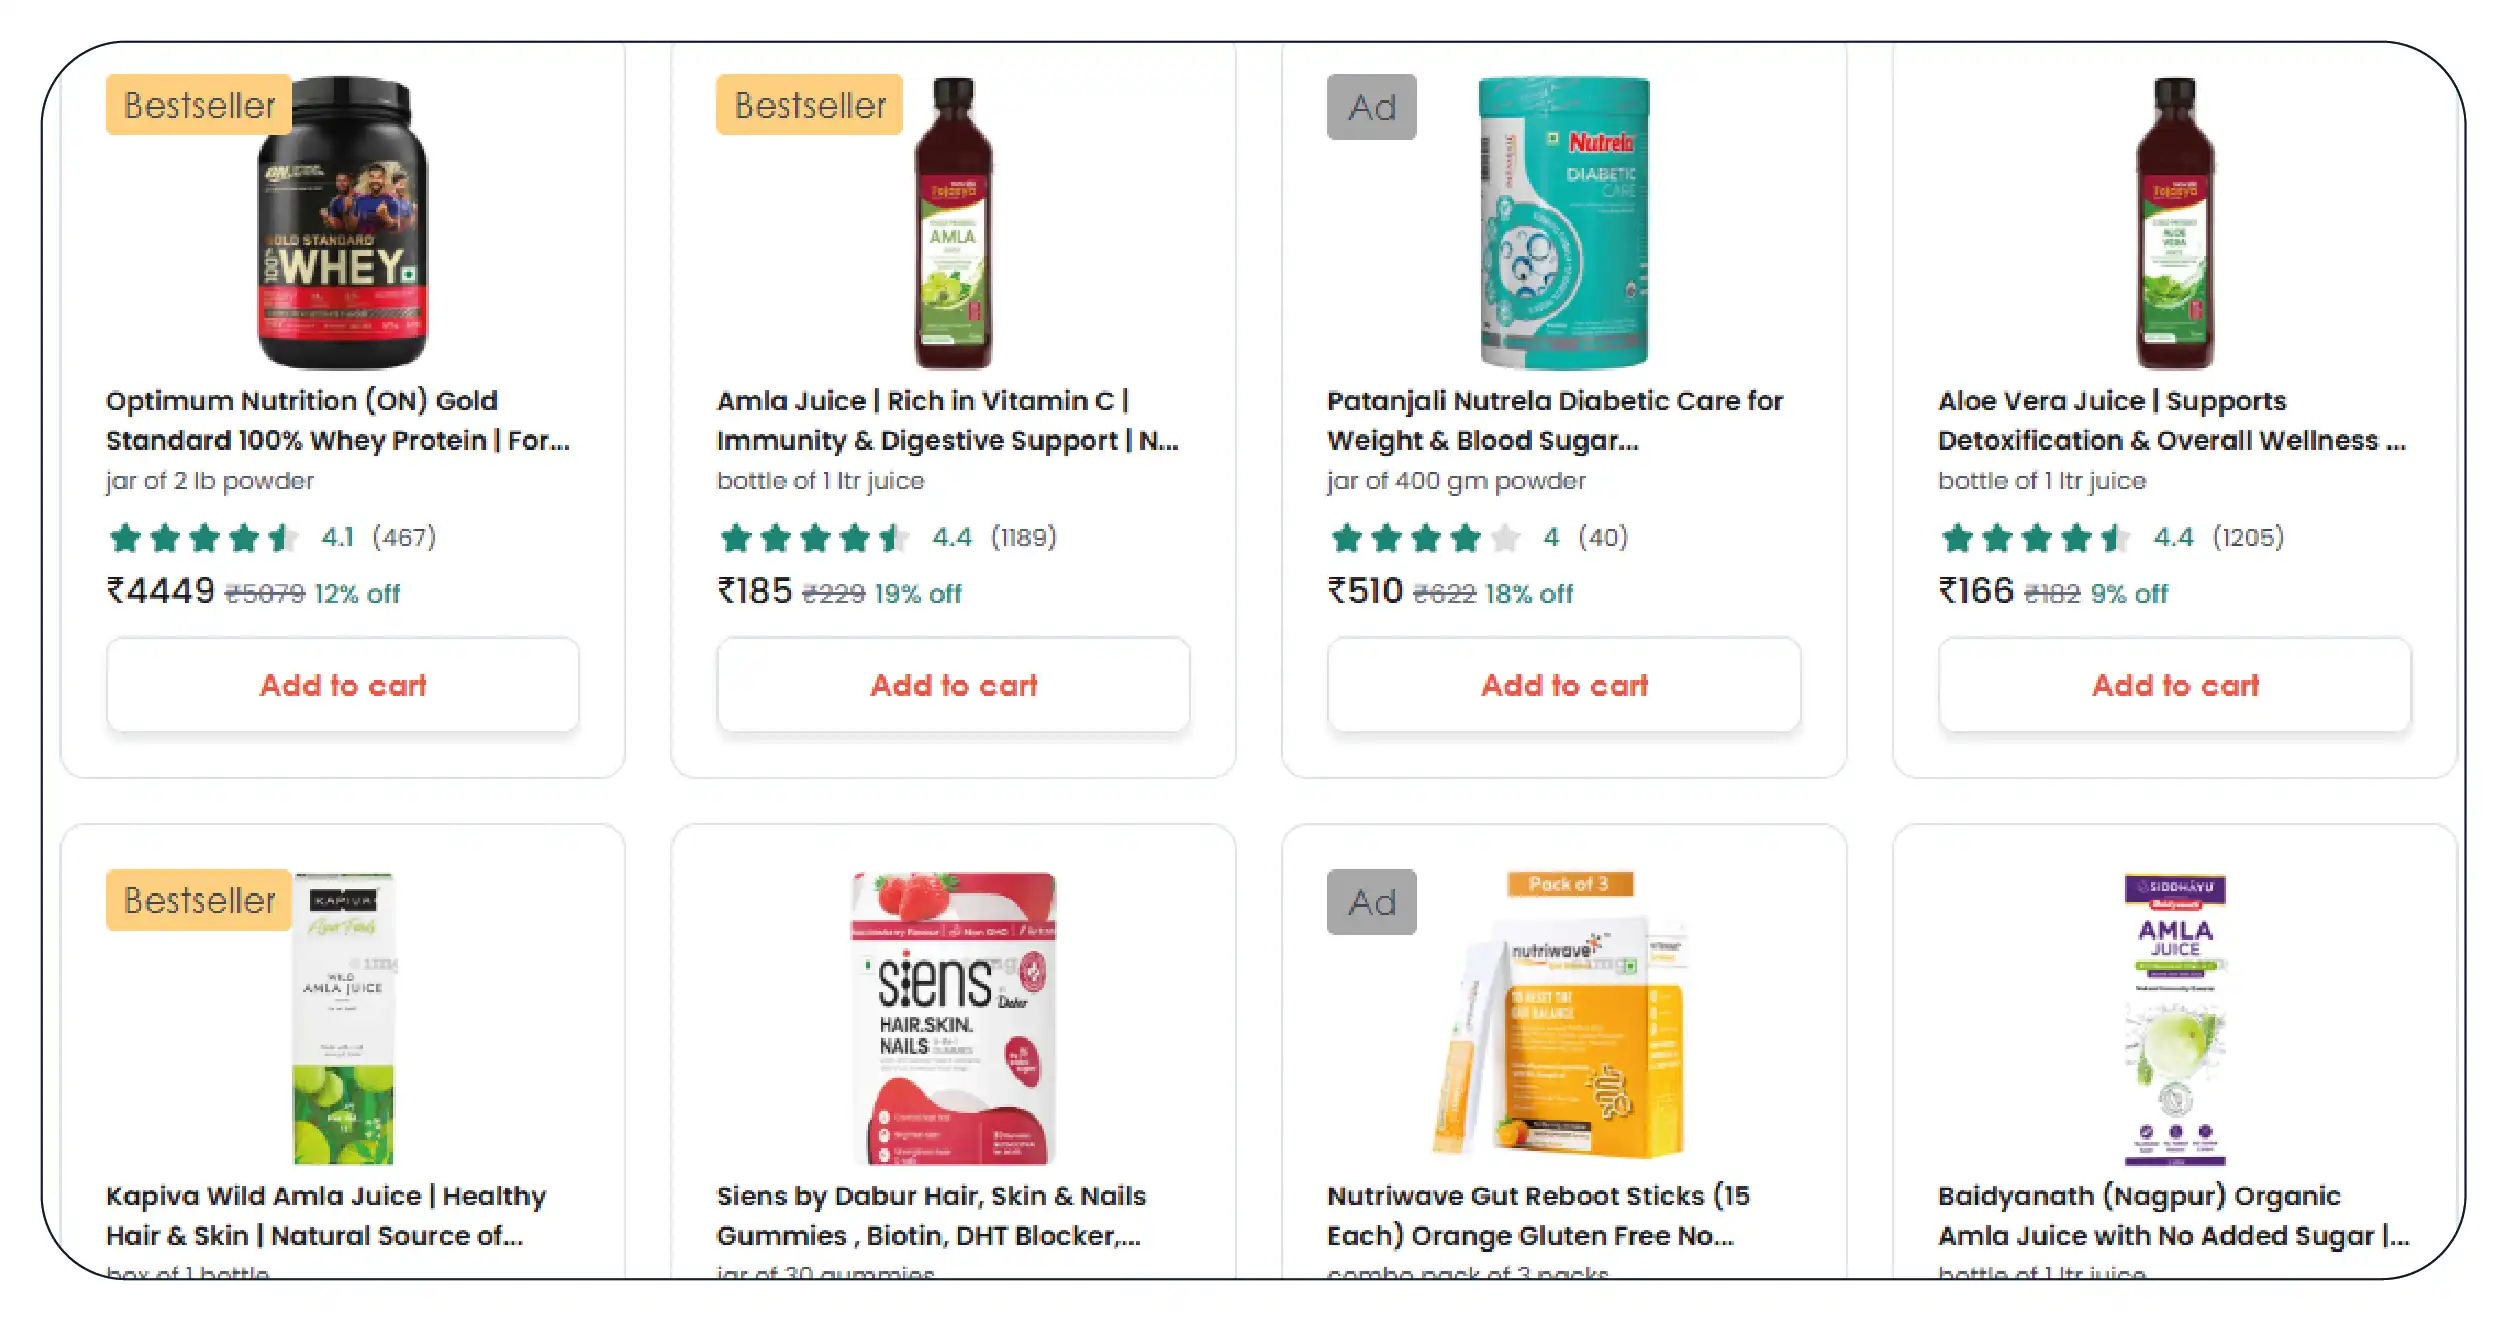
The brand competed in a category defined by price-per-serving economics and label-claim positioning, and it had no systematic view of either across the market.
On price, the problem was serving size. A competitor's tub at a lower headline price could be more expensive per serving if it contained fewer or smaller servings — and cheaper if it contained more. The brand compared tub prices, which told it almost nothing, because the unit customers and comparison tools actually reason about is price per serving, and the brand had never normalised to it.
On claims, the problem was blindness. Competitors positioned products around specific claims — protein per serving, "no added sugar," certifications, "clinically studied ingredient," specific dosages — and the brand had no consolidated view of who claimed what. It could not see where the market was crowding around a claim, where a claim was becoming table stakes, or where a competitor was making a claim the brand also could have made but wasn't.
The category lead's summary: we compete on price per serving and on what the label says, and we're not systematically tracking either one.
Why This Was Hard to Monitor
Both axes resist casual monitoring, for different reasons.
Price per serving is buried. The headline price is visible; the serving count and serving size that convert it into price per serving are buried in the product detail and vary constantly. Without extracting and normalising serving data across the market, tub-price comparisons are actively misleading.
Claims are unstructured text. Label claims live in titles, bullet points, images, and descriptions as free text. Determining "which competitors claim X" across hundreds of products means extracting and structuring claim data from unstructured content at scale — impossible to do by hand across a moving market.
Both change continuously. Prices move, pack sizes change, and claims are added, dropped, and reworded. A one-time audit is stale within weeks.
Claims carry compliance weight. Knowing what competitors claim — and how the brand's own claims compare — is not only a marketing question but a compliance-awareness one, and it requires structured, current data to be useful to a regulatory team.
The Solution: Structured Pricing and Label Claims Data
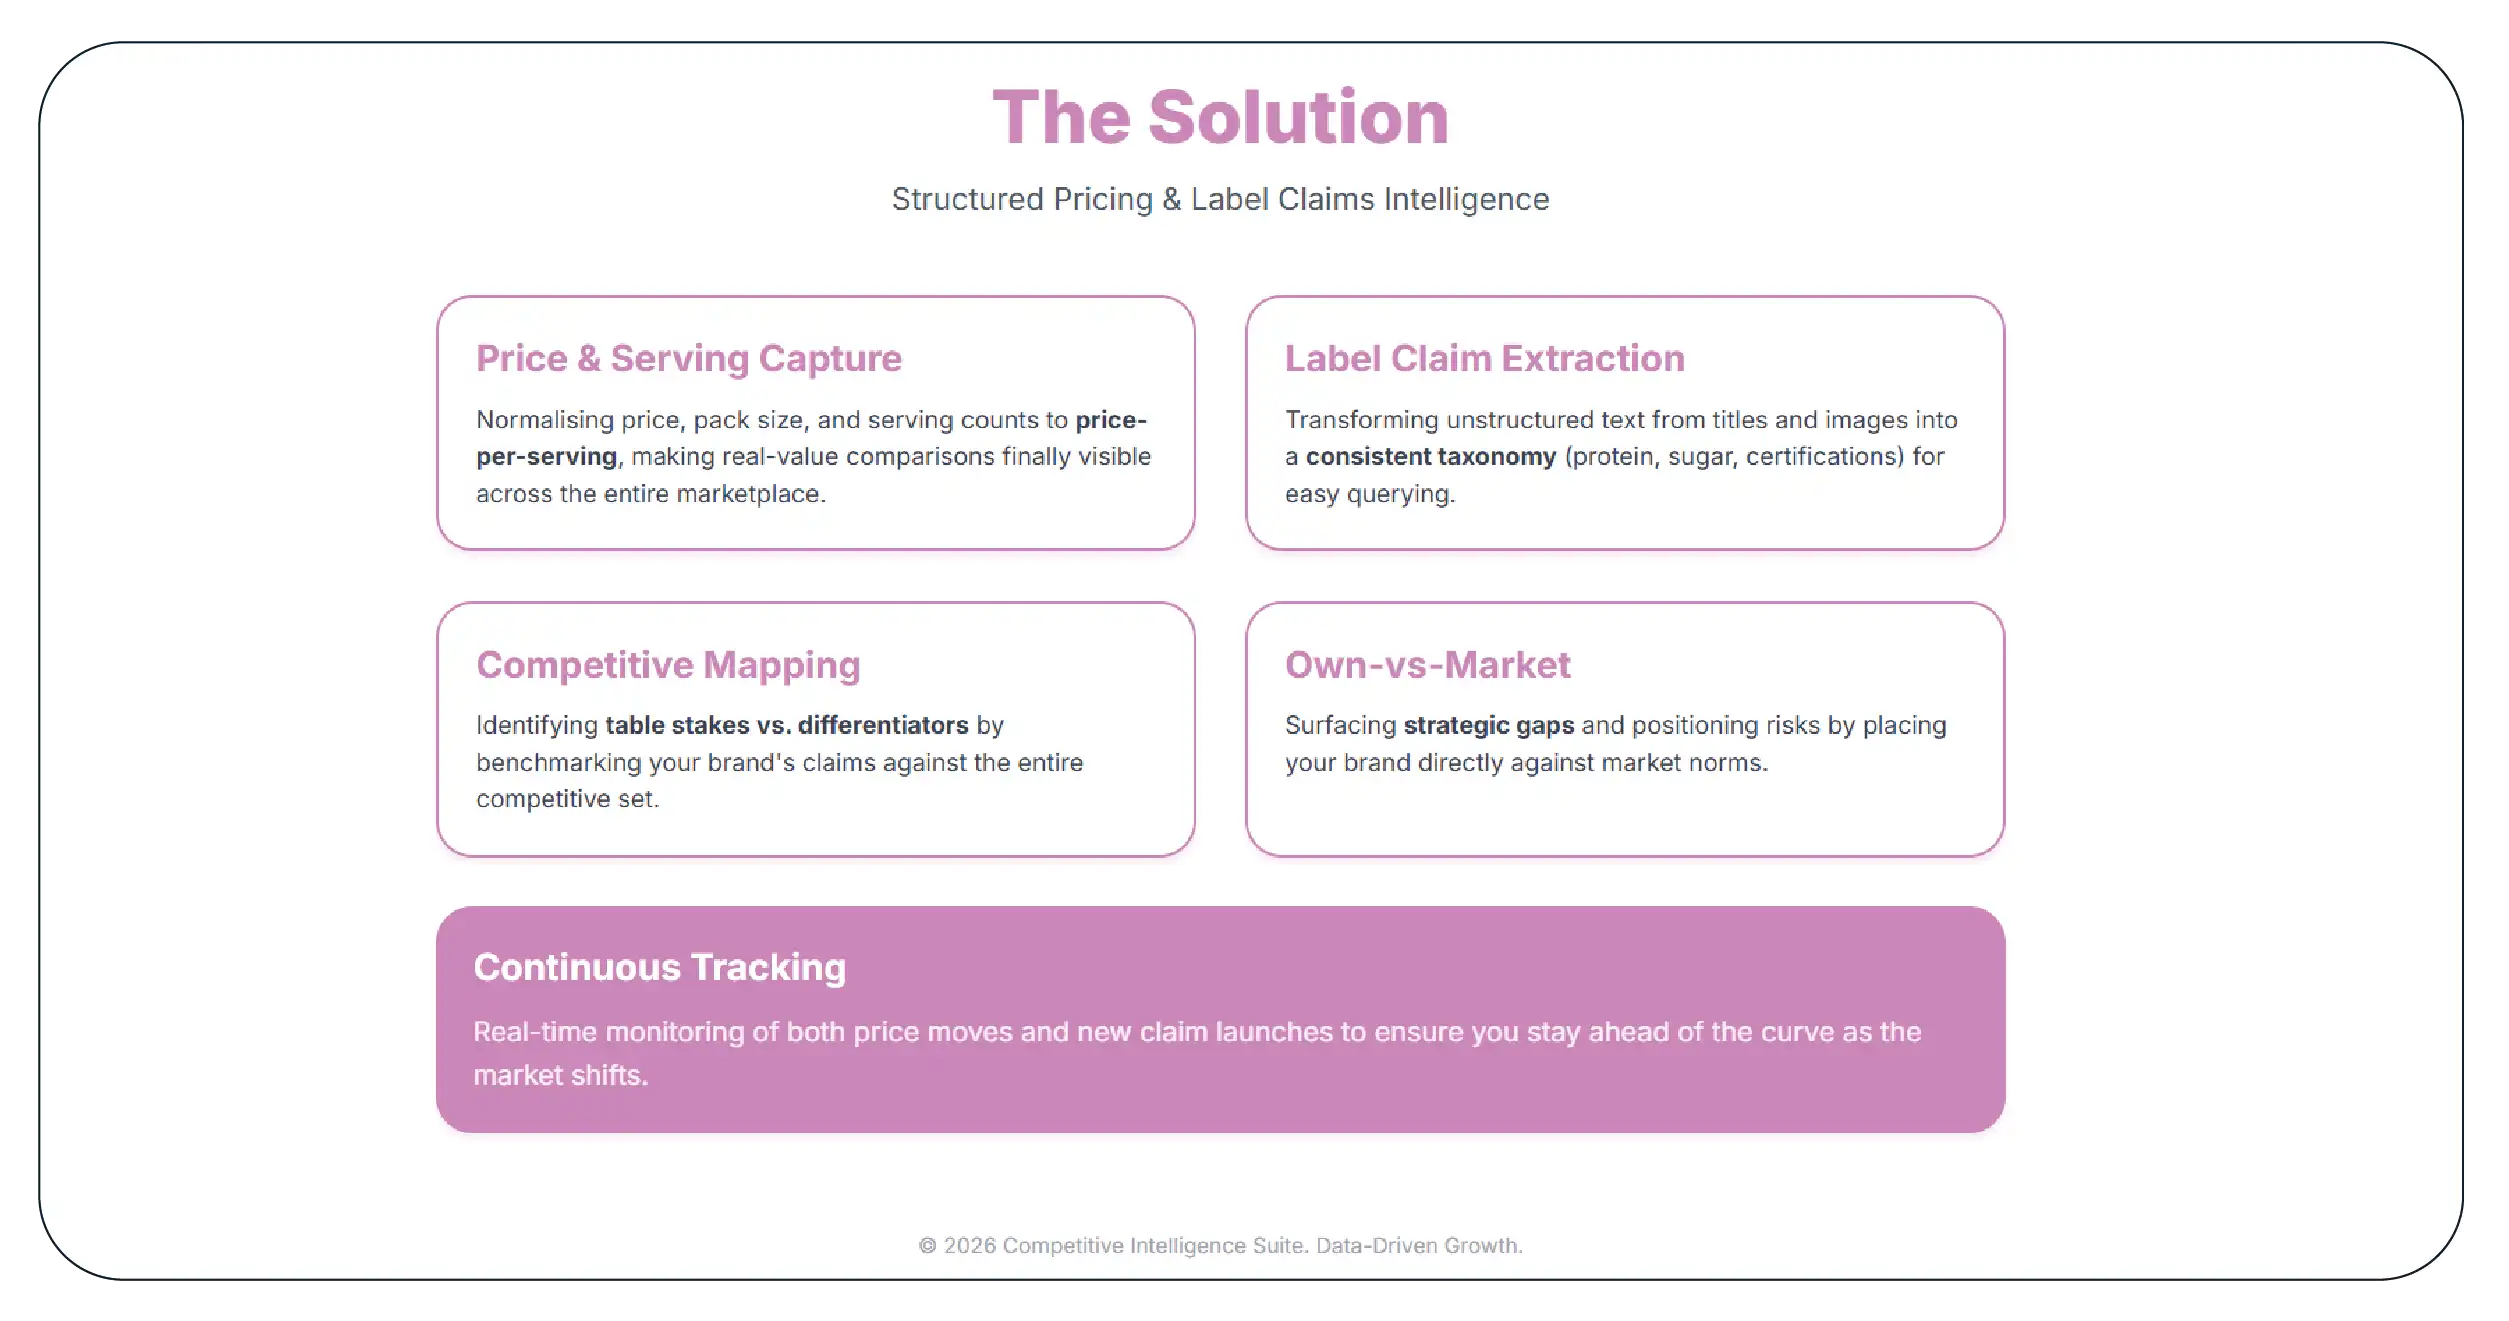
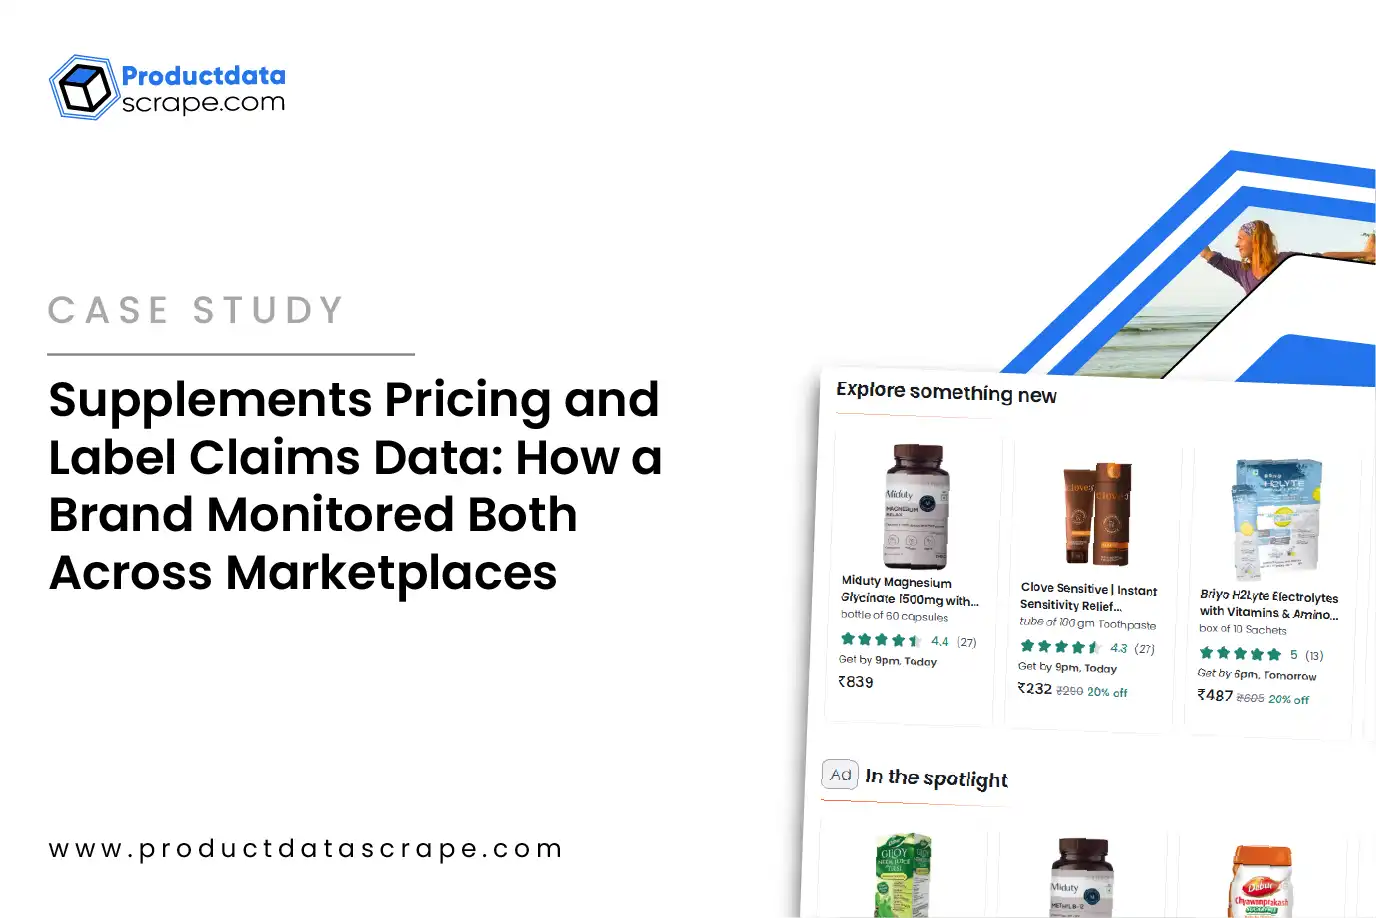
Product Data Scrape built supplements pricing and label claims data across the brand's category on every relevant marketplace.
- Price and serving capture. For every product — the brand's and competitors' — price, pack size, serving count, and serving size were captured and normalised to price per serving, so the real value comparison was finally visible.
- Label claim extraction. Claims were extracted from titles, bullets, descriptions, and imagery and structured into a consistent claim taxonomy — protein per serving, added-sugar status, certifications, ingredient claims, dosage claims, form — so "who claims what" became a queryable dataset rather than free text.
- Competitive claim mapping. Each claim was mapped across the competitive set, showing prevalence — which claims were near-universal (table stakes), which were differentiators, and which the brand was missing.
- Own-vs-market comparison. The brand's own claims and price-per-serving position were placed against the market, surfacing both gaps (claims it could make but didn't) and risks (where its positioning diverged from the norm).
- Continuous tracking. Both axes were tracked over time, so new claims and price moves surfaced as they happened.
Sample Data: Price Per Serving and the Claim Matrix
An illustrative price-per-serving comparison.
| Product |
Tub Price |
Servings |
Price / Serving |
vs Us |
| Our protein |
2,499 |
30 |
83.3 |
— |
| Competitor A |
2,299 |
24 |
95.8 |
We are 13% cheaper/serving |
| Competitor B |
2,999 |
40 |
75.0 |
We are 11% dearer/serving |
Illustrative figures.
An illustrative claim matrix across the set:
| Claim |
Us |
Comp A |
Comp B |
Comp C |
Market Prevalence |
| Protein per serving stated |
Yes |
Yes |
Yes |
Yes |
Universal (table stakes) |
| No added sugar |
No |
Yes |
Yes |
Yes |
High — we're an outlier |
| Third-party tested |
Yes |
No |
Yes |
No |
Differentiator |
| Specific studied ingredient |
No |
Yes |
No |
Yes |
Emerging |
| Vegan / plant-based |
Yes |
No |
No |
Yes |
Split |
Illustrative.
The structured record:
{
  "product_id": "SUPP-PROTEIN-HERO",
  "captured_at": "2026-07-15T10:00:00+05:30",
  "price": 2499,
  "servings": 30,
  "serving_size_g": 33,
  "price_per_serving": 83.3,
  "claims": {
    "protein_per_serving_g": 25,
    "no_added_sugar": false,
    "third_party_tested": true,
    "certifications": ["fssai"],
    "vegan": true,
    "studied_ingredient_claim": false
  },
  "market_context": {
    "no_added_sugar_prevalence": "high",
    "we_lack_common_claim": ["no_added_sugar"],
    "price_per_serving_percentile": "mid"
  }
}
Two findings the tub-price-and-eyeball approach had entirely missed. On price, the brand was 13% cheaper per serving than Competitor A despite a higher tub price — a genuine value advantage it had never quantified or marketed. On claims, "no added sugar" was near-universal in the category and the brand was a conspicuous outlier without it — a gap that was costing it on a filter and a comparison point customers clearly cared about.
What the Brand Did
Marketed the price-per-serving advantage. Where it was genuinely cheaper per serving — as against Competitor A — the brand made price per serving explicit in its listing and comparison content, converting a hidden advantage into a visible one.
Closed the table-stakes claim gap. The "no added sugar" outlier status prompted a reformulation-and-labelling review; where the product already qualified, the claim was added, and where it didn't, it entered the product roadmap. The brand stopped being invisible on a near-universal filter.
Prioritised differentiator claims. The brand leaned into claims where it was differentiated (third-party tested) and evaluated emerging claims (studied ingredients) as roadmap decisions — informed by prevalence data rather than guesswork.
Routed claims data to compliance. The structured competitor-claim dataset went to the brand's regulatory function as an awareness input; interpretation and substantiation of any claim remained the brand's own legal and regulatory responsibility.
The Results (Two Quarters)
| Metric |
Before |
After Two Quarters |
| Price-per-serving position |
Unknown |
Benchmarked, marketed where favourable |
| Table-stakes claim gaps |
Unseen |
Identified and closing |
| Products appearing on key claim filters |
Missing several |
Materially improved |
| Claim positioning decisions made on data |
None |
Roadmap-level |
| Category revenue, indexed |
100 |
124 |
| Conversion on price-per-serving-led listings |
100 |
119 |
Figures are representative of the engagement outcome.
The category lead's follow-up: we found out we were cheaper than we thought on the axis that matters, and invisible on a claim everyone else made. Both were fixable — once we could see them.
The Lesson
In supplements, the two levers that move the category — price per serving and label claims — are both hard to see and easy to get wrong. Tub prices mislead because serving counts differ; label claims are invisible at scale because they live in unstructured text. A brand that compares tubs and eyeballs a few competitor labels is guessing on both axes, and the guesses run in expensive directions — undervaluing a real price advantage, missing a claim the whole category makes.
Structuring both — normalising price to the serving and turning claims into a queryable matrix — did not change the brand's product. It revealed where the product was already winning and nobody knew, and where it was quietly losing a comparison it could have won. That is what marketplace data does in a claims-driven category: it makes the two invisible axes visible.
Work With Product Data Scrape
Product Data Scrape delivers supplements pricing and label claims data across marketplaces: price-per-serving normalisation, structured label-claim extraction into a consistent taxonomy, competitive claim-prevalence mapping, and own-vs-market comparison — as JSON, CSV, API, or dashboard-ready feeds.
We capture publicly available product and label information only; claim substantiation and regulatory interpretation remain your responsibility.
Ask us for a price-per-serving and claim-matrix snapshot on your category — we will show you where you are winning unseen and where you are an outlier.
Product Data Scrape — turning marketplace complexity into decision-ready data.


 USA
USA
 EMAIL
EMAIL
 PHONE
PHONE















.webp)






