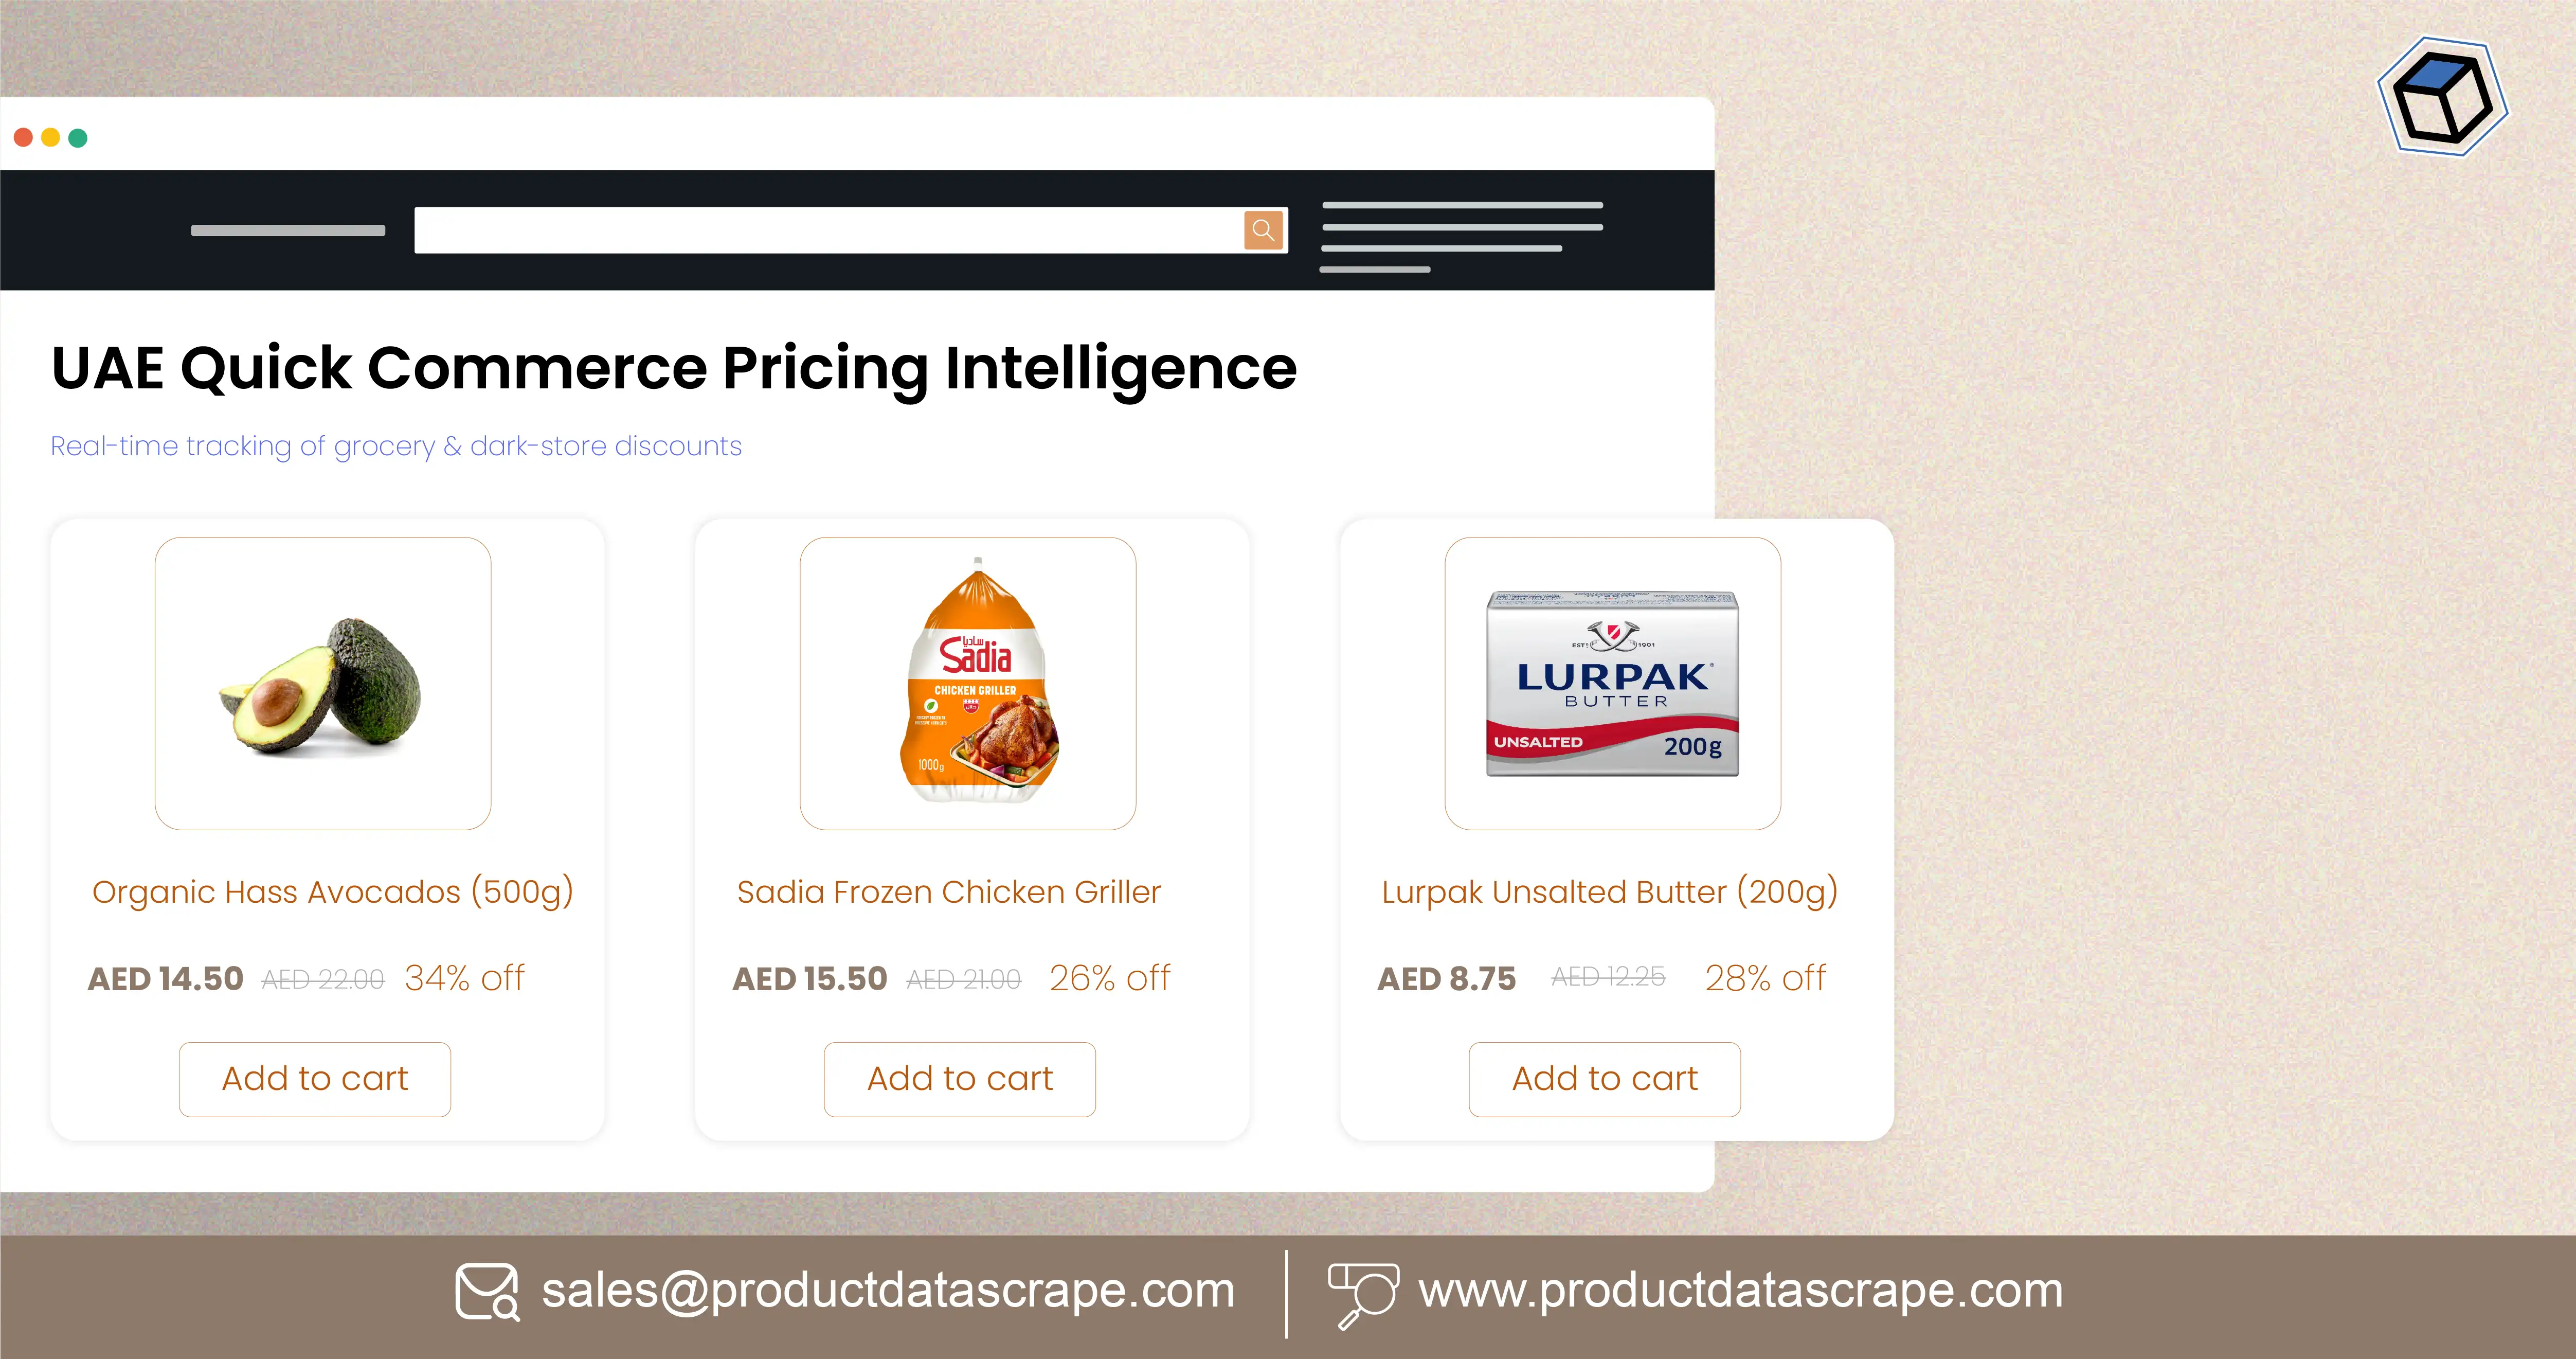
Introduction
Brands can improve pricing visibility by continuously collecting product prices, discounts, promotions, availability, pack sizes, and delivery-related information from UAE quick commerce platforms. Scraping UAE Quick Commerce pricing strategy 2026 helps retailers and FMCG companies convert fragmented marketplace information into structured competitive intelligence. The UAE e-commerce market reached AED 42.2 billion in 2025, compared with AED 17.6 billion in 2020, representing 19% CAGR over that period. (WAM)
For FMCG manufacturers, distributors, retailers, and marketplace teams, the core challenge is not simply knowing a product's listed price. It is understanding how prices change by platform, location, promotion, time, category, and availability.
A structured Extract FMCG Data from UAE Quick Commerce Apps workflow can capture product names, brands, SKUs, pack sizes, regular prices, promotional prices, discounts, stock status, ratings, delivery information, and timestamps. This enables teams to benchmark competitors, identify price gaps, detect promotions, and understand assortment changes.
The UAE quick commerce market is also expanding. A 2026 market study estimates the UAE quick commerce market at approximately US$1.38 billion in 2025, with a projected 7.6% CAGR from 2025 to 2029. (Research and Markets)
The practical outcome is faster pricing intelligence and better market visibility without relying entirely on manual monitoring.
How Can Brands Monitor Price Movements Across UAE Quick Commerce Platforms?
Real-Time Track UAE Quick Commerce Price Data enables businesses to observe price changes at SKU level rather than relying on occasional manual checks. For FMCG brands, even small changes in beverages, snacks, dairy, personal care, household products, and grocery essentials can affect price positioning.
The requirement for E-commerce data scraping in the UAE has become more relevant as digital commerce expands. UAE e-commerce grew from AED 17.6 billion in 2020 to AED 42.2 billion in 2025, while e-commerce penetration reached approximately 15.7% of total retail sales in 2025. (WAM)
UAE Digital Commerce Growth Context
| Year |
UAE e-commerce market / indicator |
Data status |
| 2020 |
AED 17.6B |
Reported |
| 2021 |
Post-pandemic digital expansion |
Market trend |
| 2022 |
Continued online adoption |
Market trend |
| 2023 |
Continued digital retail growth |
Market trend |
| 2024 |
AED 32.3B |
Reported |
| 2025 |
AED 42.2B |
Reported |
| 2026 |
9.9% CAGR projected for 2026–2030 |
Forecast |
Sources: EZDubai/Euromonitor. (WAM)
From 2020 onward, the UAE market moved from pandemic-driven online adoption toward a more mature digital retail environment. In 2021 and 2022, brands increasingly needed visibility into online assortment and pricing. By 2023 and 2024, competitive benchmarking became more important as digital channels expanded. In 2025, the AED 42.2 billion market size demonstrated the scale of the opportunity. For 2026, companies can use automated monitoring to move from periodic snapshots to continuous pricing intelligence.
A useful monitoring system should capture SKU, brand, category, regular price, promotional price, discount percentage, stock status, platform, location, timestamp, and product URL. This allows pricing teams to distinguish genuine price changes from temporary promotions.
What Can a Competitive Pricing API Reveal About UAE Quick Commerce?
A UAE Quick Commerce Competitive Pricing API can turn recurring product observations into structured data feeds for pricing dashboards, business intelligence systems, and analytics applications. Instead of downloading spreadsheets manually, commercial teams can consume normalized product and pricing records on a recurring schedule.
The wider opportunity is connected to Global quick commerce data, because UAE businesses increasingly operate within competitive digital ecosystems where pricing, assortment, fulfillment, and promotions influence customer decisions.
Market Indicators Relevant to Pricing Intelligence
| Period |
Indicator |
Implication |
| 2020 |
UAE retail e-commerce reached US$3.9B |
Digital shopping accelerated |
| 2021 |
Online adoption remained elevated |
More digital monitoring required |
| 2022 |
UAE inflation reached 5.3% |
Price sensitivity increased |
| 2023 |
Inflation moderated to 1.6% |
Pricing normalization began |
| 2024 |
UAE e-commerce reached AED 32.3B |
Larger online market |
| 2025 |
UAE e-commerce reached AED 42.2B |
Greater digital competition |
| 2026 |
Quick-commerce expansion continues |
More frequent monitoring needed |
The 2020 e-commerce figure comes from Dubai Chamber analysis, while inflation figures are from World Bank data. (Government of Dubai Media Office)
For pricing teams, the key insight is that market-level changes and platform-level changes should be analyzed separately. Inflation may influence category pricing, but a competitor promotion can create a much shorter-term price movement.
Between 2020 and 2026, this distinction has become increasingly important. A retailer might reduce a product by 10% for a weekend campaign while the underlying market price remains unchanged. Automated collection with timestamps allows analysts to identify these events.
The API layer can also distribute structured data to BI dashboards, pricing engines, data warehouses, or internal analytics tools. This creates a reusable foundation for competitor monitoring instead of one-off research.
How Can Businesses Capture Complete Product Information From Quick Commerce Apps?
Extract UAE Quick Commerce Product Data provides a broader view than price tracking alone. A useful dataset can combine product identity, pricing, promotions, availability, category hierarchy, pack size, brand, ratings, delivery information, and location.
For businesses developing Scraping UAE Quick Commerce pricing strategy 2026, product-level context is critical. A price comparison becomes misleading if analysts compare a 250 ml product with a 1-liter pack or a single-item listing with a multipack.
Recommended Product Dataset Structure
| Data field |
Business use |
| Product name |
SKU identification |
| Brand |
Brand-level benchmarking |
| Category |
Category analysis |
| Pack size |
Like-for-like comparison |
| Regular price |
Baseline pricing |
| Sale price |
Promotion analysis |
| Discount |
Offer measurement |
| Availability |
Supply visibility |
| Rating/reviews |
Customer signal |
| Delivery information |
Service comparison |
| Location |
Geographic benchmarking |
| Timestamp |
Historical tracking |
The 2020–2026 evolution of digital commerce also changes the value of product data. In 2020, online shopping accelerated rapidly as consumers shifted toward digital channels. By 2022, UAE inflation reached 5.3%, creating an important environment for price monitoring. Inflation declined to 1.6% in 2023 and 1.7% in 2024, before reaching 1.3% in 2025 according to World Bank data. (DataBank)
For 2026, the emphasis can shift toward understanding why a price changed. Was it a promotion, competitor response, assortment change, pack-size change, or market-wide movement?
This makes historical SKU-level datasets particularly valuable. Brands can calculate average selling prices, promotion frequency, discount depth, stock-out frequency, and price gaps across platforms.
How Does Price Benchmarking Help FMCG Brands Understand Competitors?
A UAE Quick Commerce Product Price Benchmark allows businesses to compare comparable products across platforms, categories, locations, and time periods. The goal is not simply to identify the cheapest listing. It is to understand relative price positioning and promotional behavior.
Example Benchmarking Framework
| Benchmark metric |
Example calculation |
Business question |
| Price gap |
Brand price − competitor price |
Are we priced above competitors? |
| Discount depth |
Regular price − sale price |
How aggressive is the promotion? |
| Promotion frequency |
Promotional days / tracked days |
How often does a competitor discount? |
| Availability rate |
Available observations / total observations |
How consistently is the SKU stocked? |
| Price index |
Brand price / market benchmark × 100 |
Where does the SKU sit in the market? |
The UAE's broader e-commerce market provides an important backdrop. It expanded from AED 17.6 billion in 2020 to AED 32.3 billion in 2024 and AED 42.2 billion in 2025. (WAM)
From 2020 to 2022, businesses had to respond to rapid digital adoption and changing consumer economics. In 2023 and 2024, more stable inflation conditions made it easier to distinguish broader market effects from individual promotional activity. By 2025, the larger online market created more opportunities for structured competitive benchmarking. In 2026, brands can apply these historical datasets to identify recurring pricing patterns.
For FMCG decision-makers, benchmarking should be normalized around comparable SKUs. Analysts should account for pack size, unit quantity, promotions, bundles, and temporary discounts before drawing conclusions.
The resulting dataset can support category managers, revenue teams, sales teams, and brand managers when evaluating price positioning and promotional calendars.
How Can a Product Data API Support Continuous Market Monitoring?
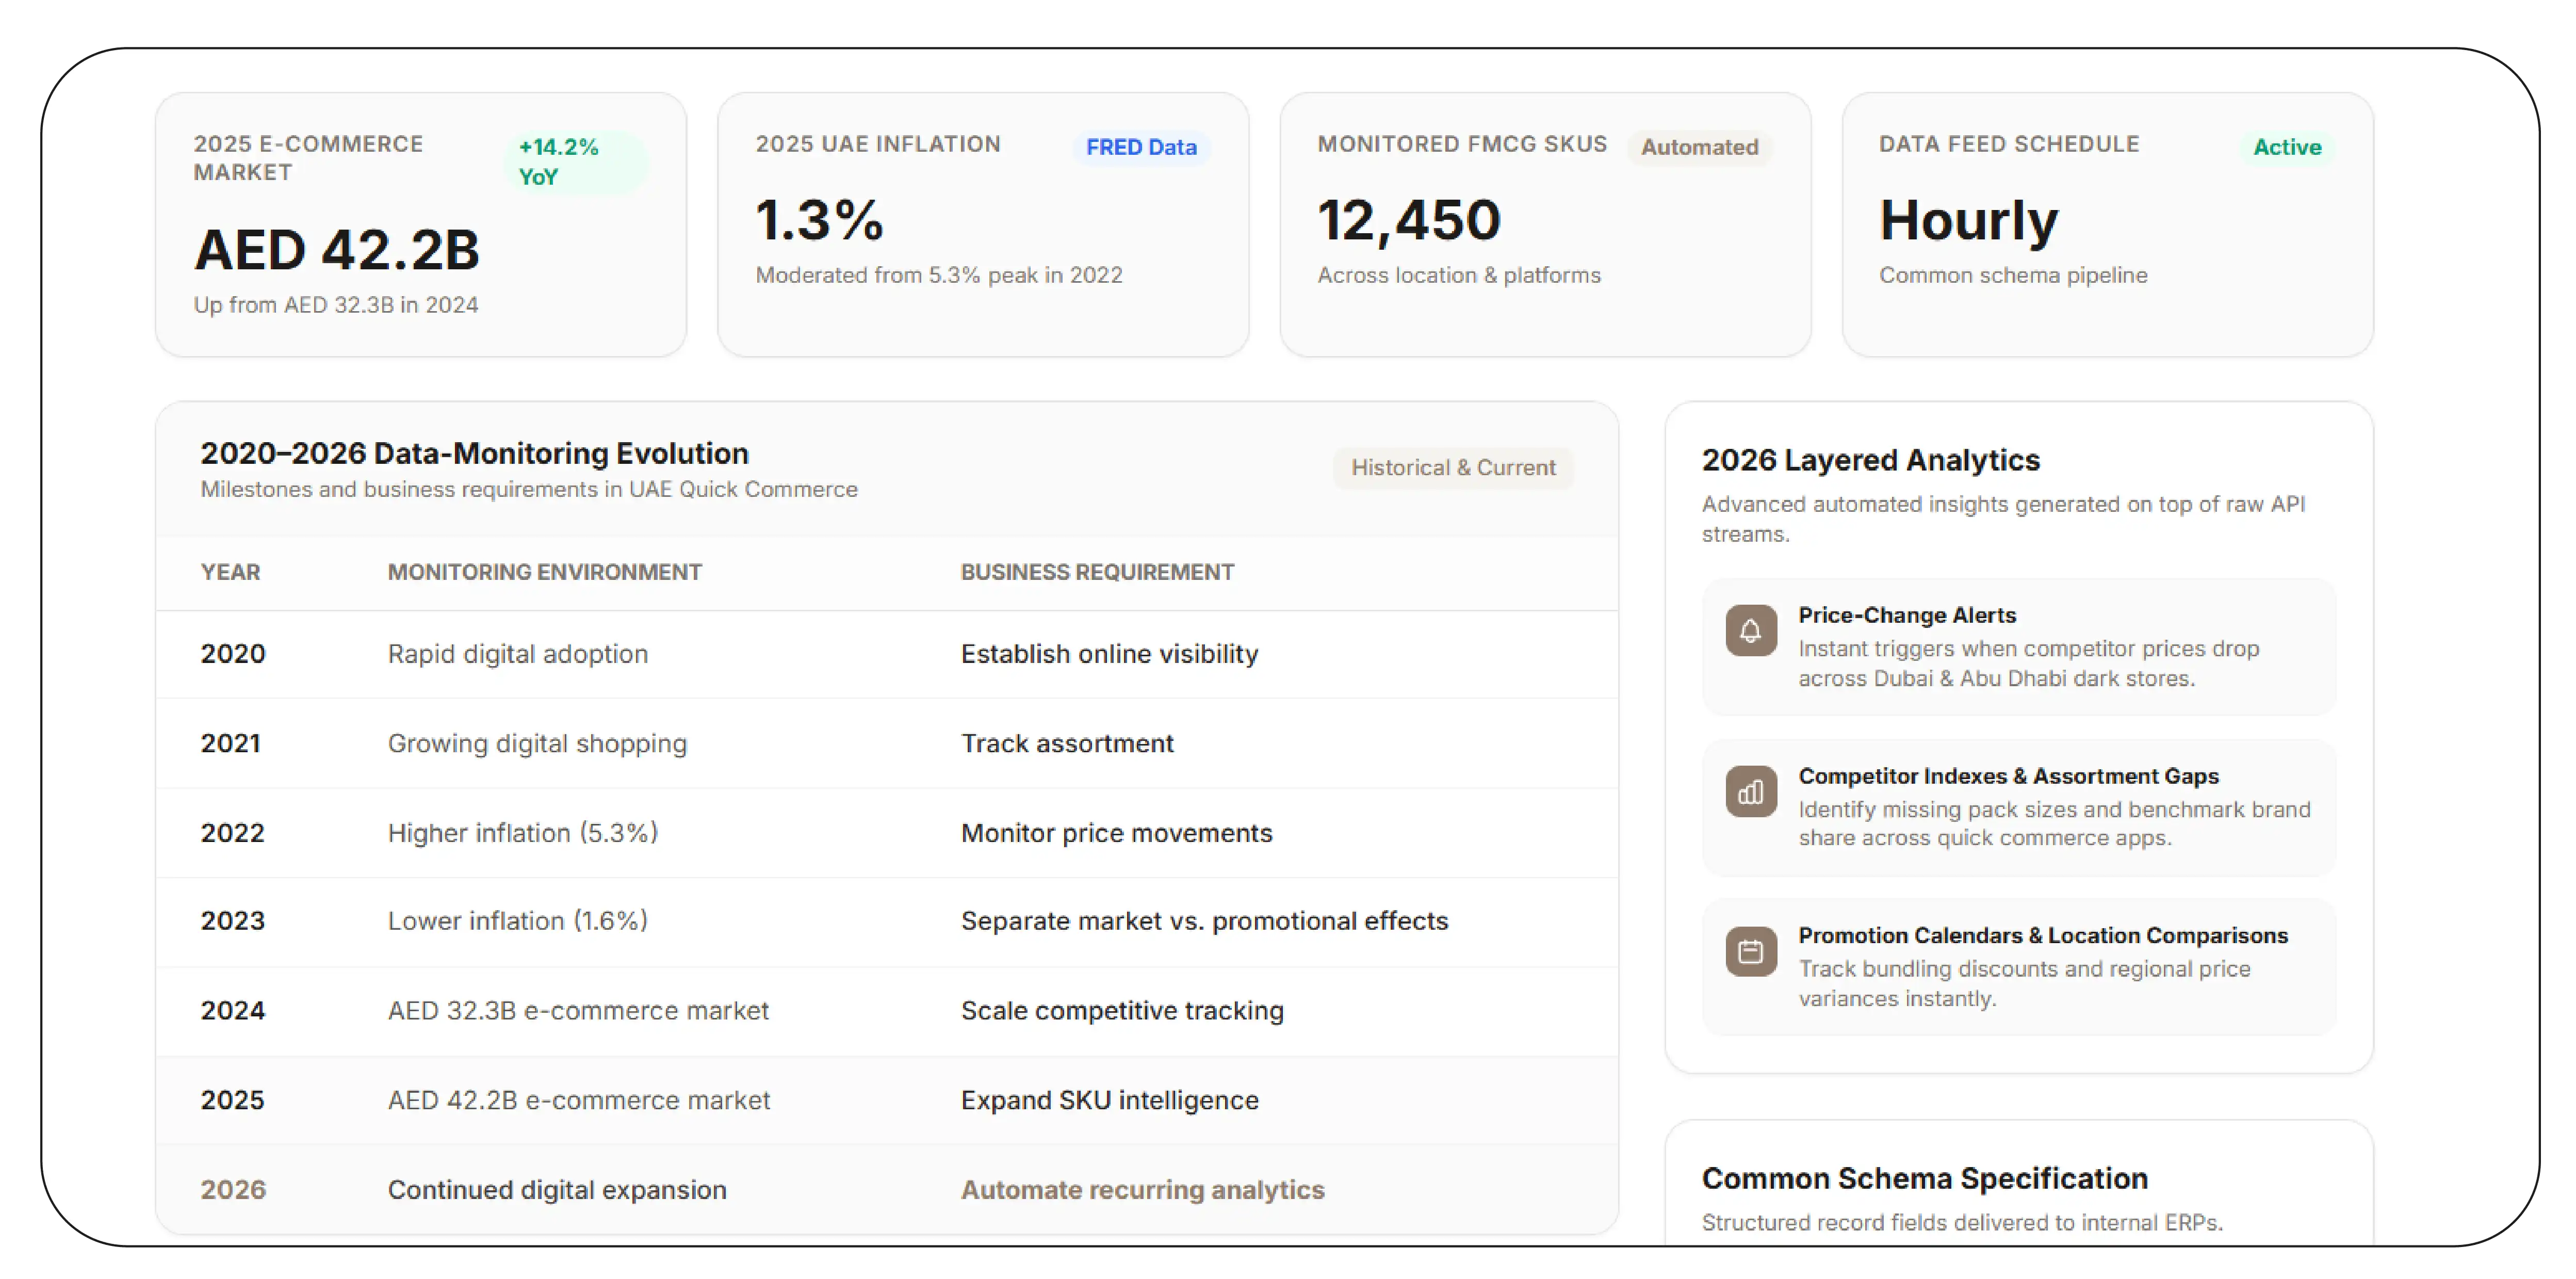
A UAE Quick Commerce Product Data API can provide structured access to continuously collected product information, allowing companies to connect marketplace intelligence with internal systems.
This is particularly useful for organizations managing hundreds or thousands of FMCG SKUs. Manual monitoring becomes increasingly difficult when products vary by location, platform, pack size, promotion, and availability.
2020–2026 Data-Monitoring Evolution
| Year |
Monitoring environment |
Business requirement |
| 2020 |
Rapid digital adoption |
Establish online visibility |
| 2021 |
Growing digital shopping |
Track assortment |
| 2022 |
Higher inflation |
Monitor price movements |
| 2023 |
Lower inflation |
Separate market vs. promotional effects |
| 2024 |
AED 32.3B e-commerce market |
Scale competitive tracking |
| 2025 |
AED 42.2B e-commerce market |
Expand SKU intelligence |
| 2026 |
Continued digital expansion |
Automate recurring analytics |
UAE inflation increased to 5.3% in 2022 before moderating to 1.6% in 2023, 1.7% in 2024, and 1.3% in 2025. (FRED) Meanwhile, the UAE e-commerce market reached AED 42.2 billion in 2025. (WAM)
A robust API workflow can therefore provide historical and current observations in a common schema. Data can include SKU identifiers, product titles, brands, categories, prices, promotions, availability, URLs, locations, and timestamps.
The advantage is operational continuity. Instead of waiting for a monthly report, pricing and category teams can receive structured records on a predefined schedule.
For 2026, businesses can also layer analytics on top of the data, including price-change alerts, competitor indexes, promotion calendars, assortment gaps, and location-level comparisons.
How Can Brands Analyze Different Pricing Models Across UAE Quick Commerce?
UAE Quick Commerce Pricing Model Analysis helps businesses understand how platforms and competitors use regular pricing, promotional pricing, bundles, discounts, subscriptions, minimum-order incentives, and location-based variations.
This matters because a displayed product price is only one component of the customer's effective purchase cost. Delivery charges, promotional thresholds, discounts, bundles, and availability can influence the final basket economics.
Businesses applying Scraping UAE Quick Commerce pricing strategy 2026 should therefore capture pricing observations alongside promotional and fulfillment attributes.
Pricing Model Analysis Framework
| Pricing factor |
What to monitor |
Strategic use |
| Base price |
Standard listed price |
Price positioning |
| Promotional price |
Temporary selling price |
Campaign tracking |
| Discount |
Percentage or amount |
Promotion intensity |
| Bundle |
Multi-item offer |
Basket-building analysis |
| Minimum order |
Threshold value |
Conversion analysis |
| Delivery fee |
Customer fulfillment cost |
Total-cost comparison |
| Availability |
In-stock/out-of-stock |
Supply visibility |
| Location |
Emirate/area |
Geographic pricing |
The broader market trajectory provides context. UAE e-commerce increased substantially between 2020 and 2025, while the quick-commerce market is also forecast to continue expanding through 2029. (WAM)
In 2020, companies primarily focused on maintaining digital availability. By 2022, inflation and changing costs increased the importance of price monitoring. In 2023–2024, businesses could increasingly separate market-wide movements from platform-specific promotions. In 2025, the larger digital market created greater value in automated benchmarking. For 2026, pricing model analysis can combine historical observations with real-time monitoring.
The most useful output is not a simple list of prices. It is a structured view of how competitors position products, how frequently they promote them, and how pricing differs by location and time.
Why Choose Product Data Scrape?
Hyperlocal Quick Commerce Grocery Data Scraping helps brands move beyond national-level averages and examine product pricing, assortment, promotions, and availability at more granular geographic levels. This is valuable when the same SKU behaves differently across locations. Scraping UAE Quick Commerce pricing strategy 2026 can support recurring collection across relevant product categories, platforms, and locations. A structured workflow can normalize product names, brands, pack sizes, prices, discounts, availability, timestamps, and URLs. For FMCG manufacturers, retailers, distributors, and category managers, this creates a repeatable foundation for price benchmarking, promotion analysis, assortment intelligence, and competitor monitoring. The approach also supports historical datasets that reveal recurring price changes instead of isolated snapshots.
Conclusion
AI Powered Quick Commerce Data Scraping can help brands transform recurring product observations into structured pricing and competitive intelligence. The UAE e-commerce market reached AED 42.2 billion in 2025, highlighting the scale of digital commerce and the need for systematic online visibility. (WAM)
Scraping UAE Quick Commerce pricing strategy 2026 gives FMCG brands a practical framework for monitoring prices, promotions, availability, assortment, and competitor movements. Historical datasets can identify patterns, while recurring collection can support faster responses to market changes.
Partner with Product Data Scrape to build structured UAE quick commerce datasets that support pricing intelligence, competitor benchmarking, promotion monitoring, and data-driven FMCG decisions!
FAQs
1. What is UAE quick commerce pricing intelligence?
It is the structured monitoring of product prices, discounts, promotions, availability, and related marketplace signals to understand competitive pricing behavior across UAE digital commerce channels.
2. Why should FMCG brands monitor quick commerce prices?
Monitoring helps FMCG brands identify competitor price changes, promotion frequency, assortment differences, stock availability, and location-specific market movements.
3. What data can quick commerce scraping collect?
Depending on platform availability, datasets can include product names, brands, categories, pack sizes, prices, discounts, ratings, availability, delivery information, URLs, locations, and timestamps.
4. How frequently should UAE quick commerce data be collected?
Frequency depends on the business use case. High-volatility categories may require daily or multiple daily observations, while slower categories can use less frequent schedules.
5. How can Product Data Scrape support quick commerce intelligence?
Product Data Scrape can help structure recurring marketplace observations into analytics-ready datasets for price benchmarking, promotion monitoring, assortment analysis, and competitive intelligence.


 Singapore
 EMAIL
EMAIL
 PHONE
PHONE


.webp "thumb")













.webp)






