Introduction
Quick Commerce Price Monitoring API India helps brands, retailers, marketplaces, and pricing teams track product prices, discounts, availability, and assortment changes across fast-growing delivery platforms. It turns frequent marketplace changes into structured data that teams can compare and analyze.
The need is growing because quick commerce operates on fast price cycles. A product can have different prices across platforms, cities, stores, and time periods. Manual checks cannot keep pace with these changes. Quick commerce intelligence gives businesses a repeatable way to monitor these movements.
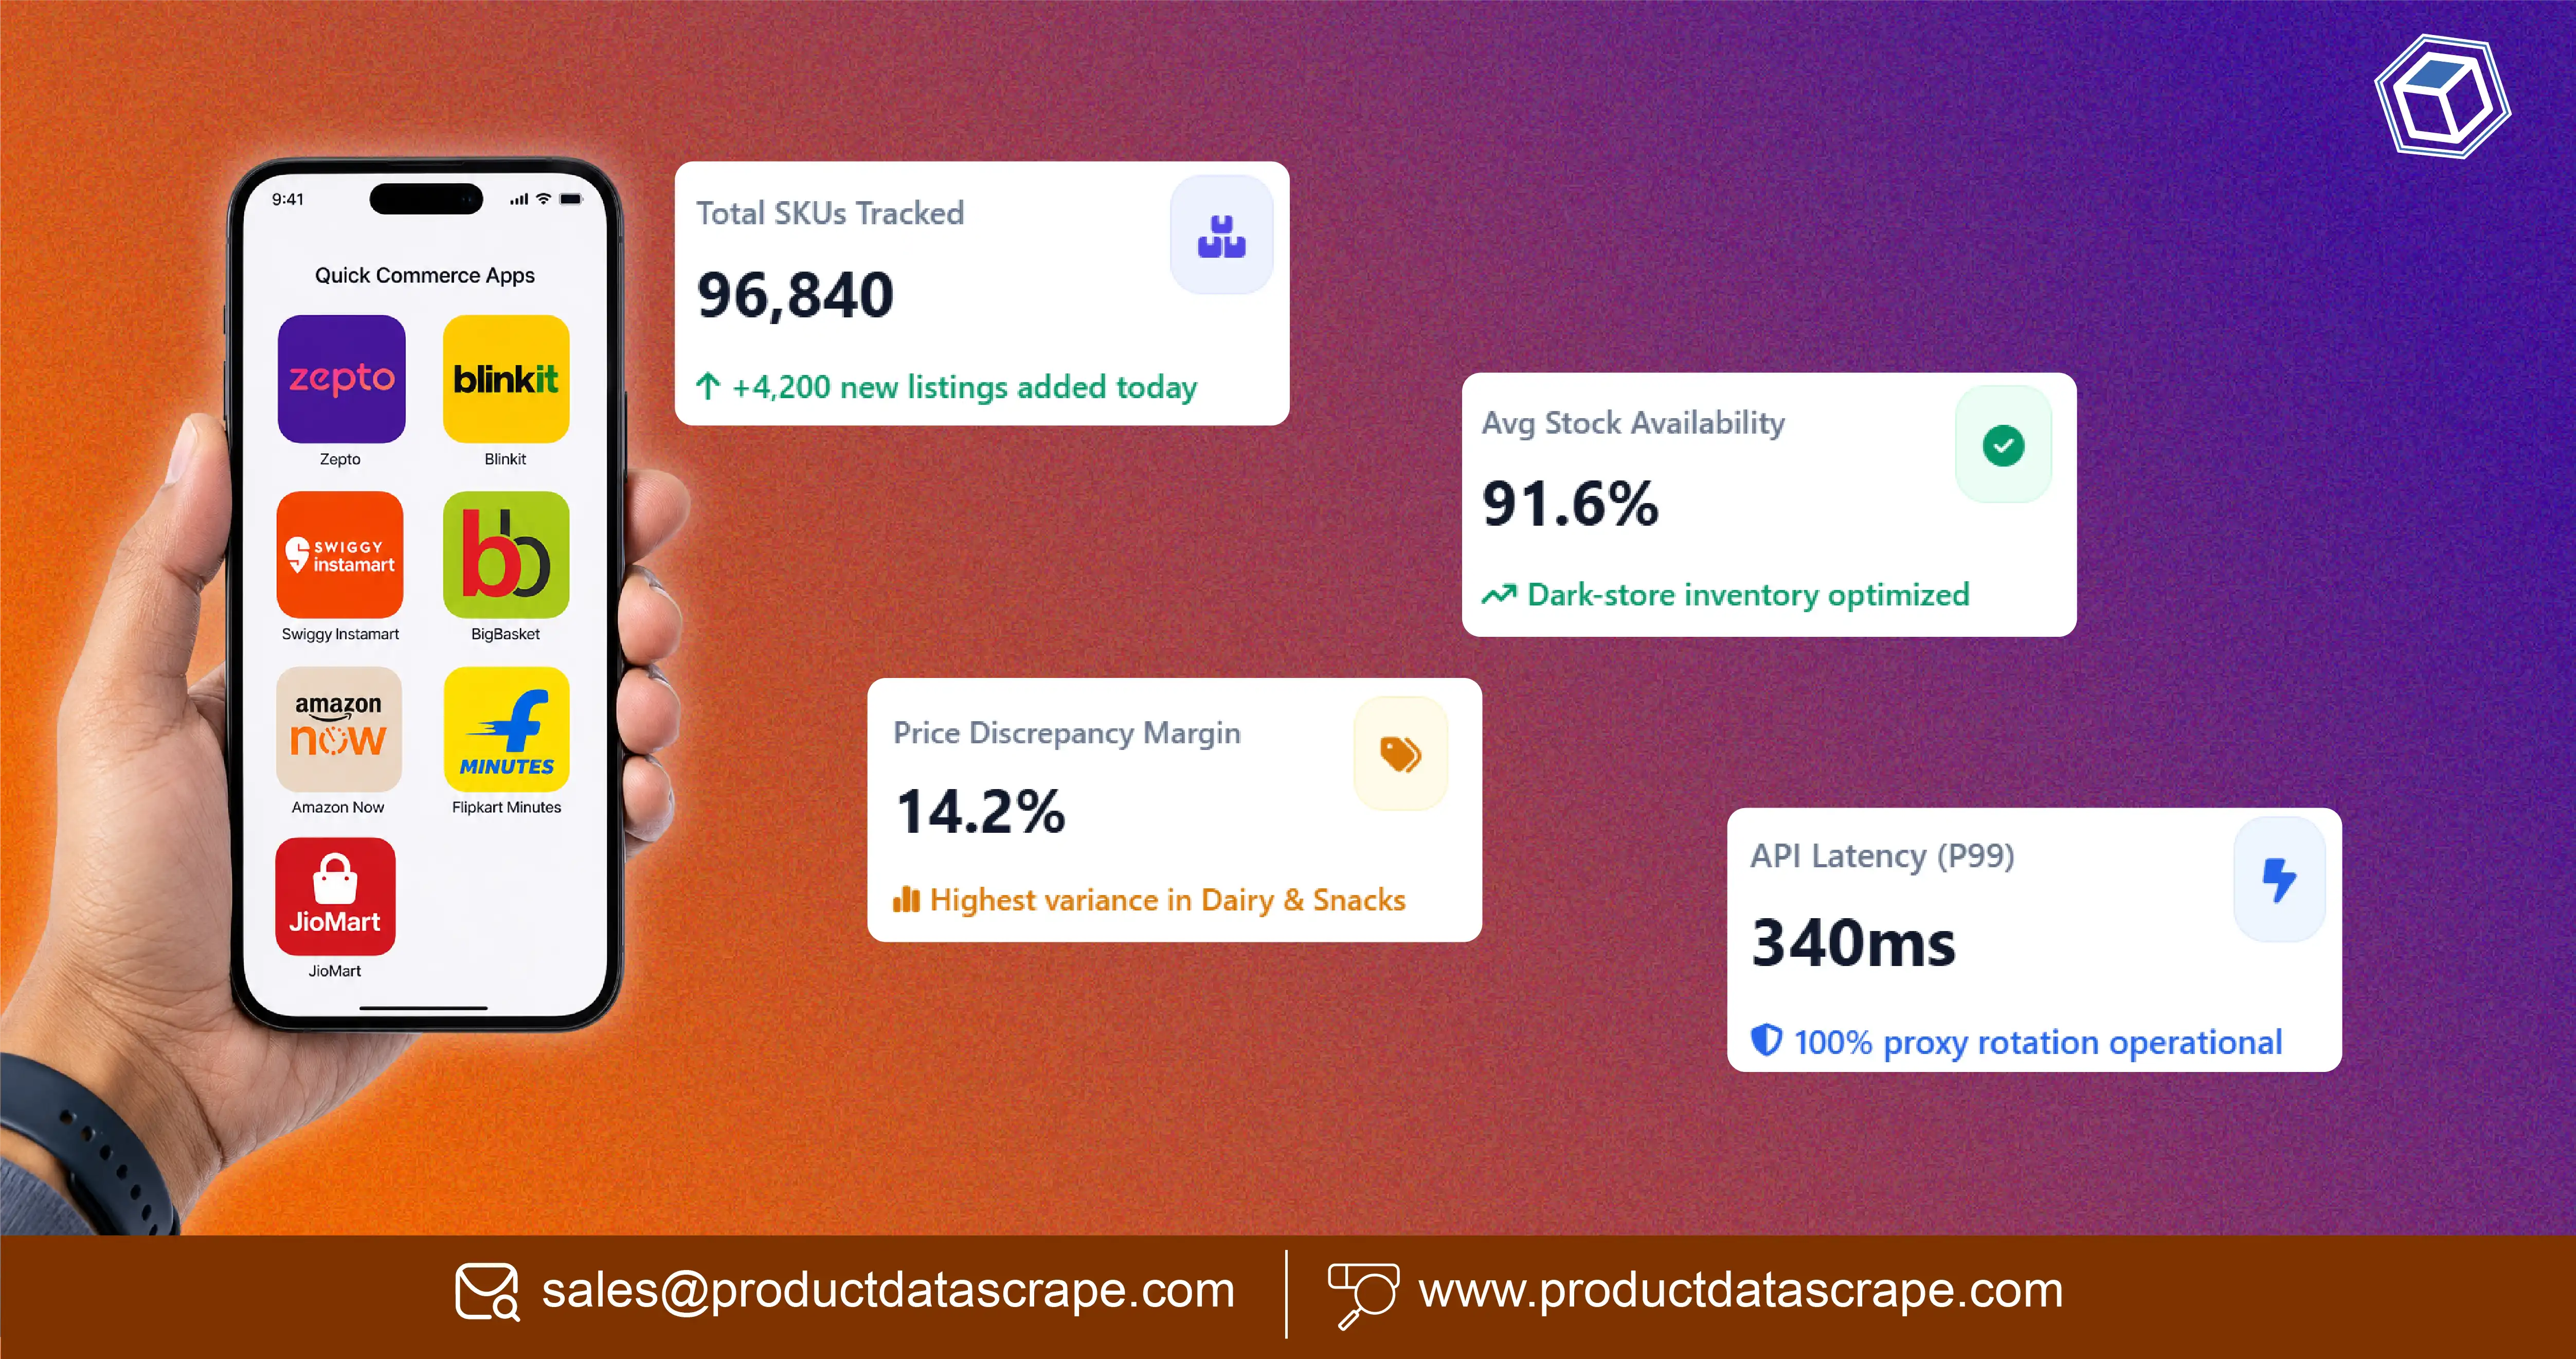
For example, a pricing team can compare the same grocery product across Zepto, Blinkit, Instamart, BigBasket, Amazon Now, Flipkart Minutes, and JioMart. It can then identify price gaps, discount patterns, stock changes, and promotional opportunities.
Illustrative benchmark: A quick-commerce monitoring program that checks 5,000 products across 7 platforms can create 35,000 platform-product observations per monitoring cycle.
Illustrative Monitoring Scale (2020–2026)
| Year |
Illustrative Products Tracked |
Platforms |
Monitoring Cycles/Year |
| 2020 |
500 |
2 |
12 |
| 2021 |
800 |
3 |
24 |
| 2022 |
1,500 |
4 |
52 |
| 2023 |
2,500 |
5 |
104 |
| 2024 |
3,500 |
6 |
156 |
| 2025 |
5,000 |
7 |
208 |
| 2026 |
7,500 |
7+ |
365 |
These figures are illustrative benchmarks for demonstrating how monitoring scale can grow. The main benefit is simple. Businesses get structured pricing information without depending on manual screenshots, spreadsheets, or repeated searches.
How Can Businesses Compare Prices Across Leading Quick-Commerce Platforms?
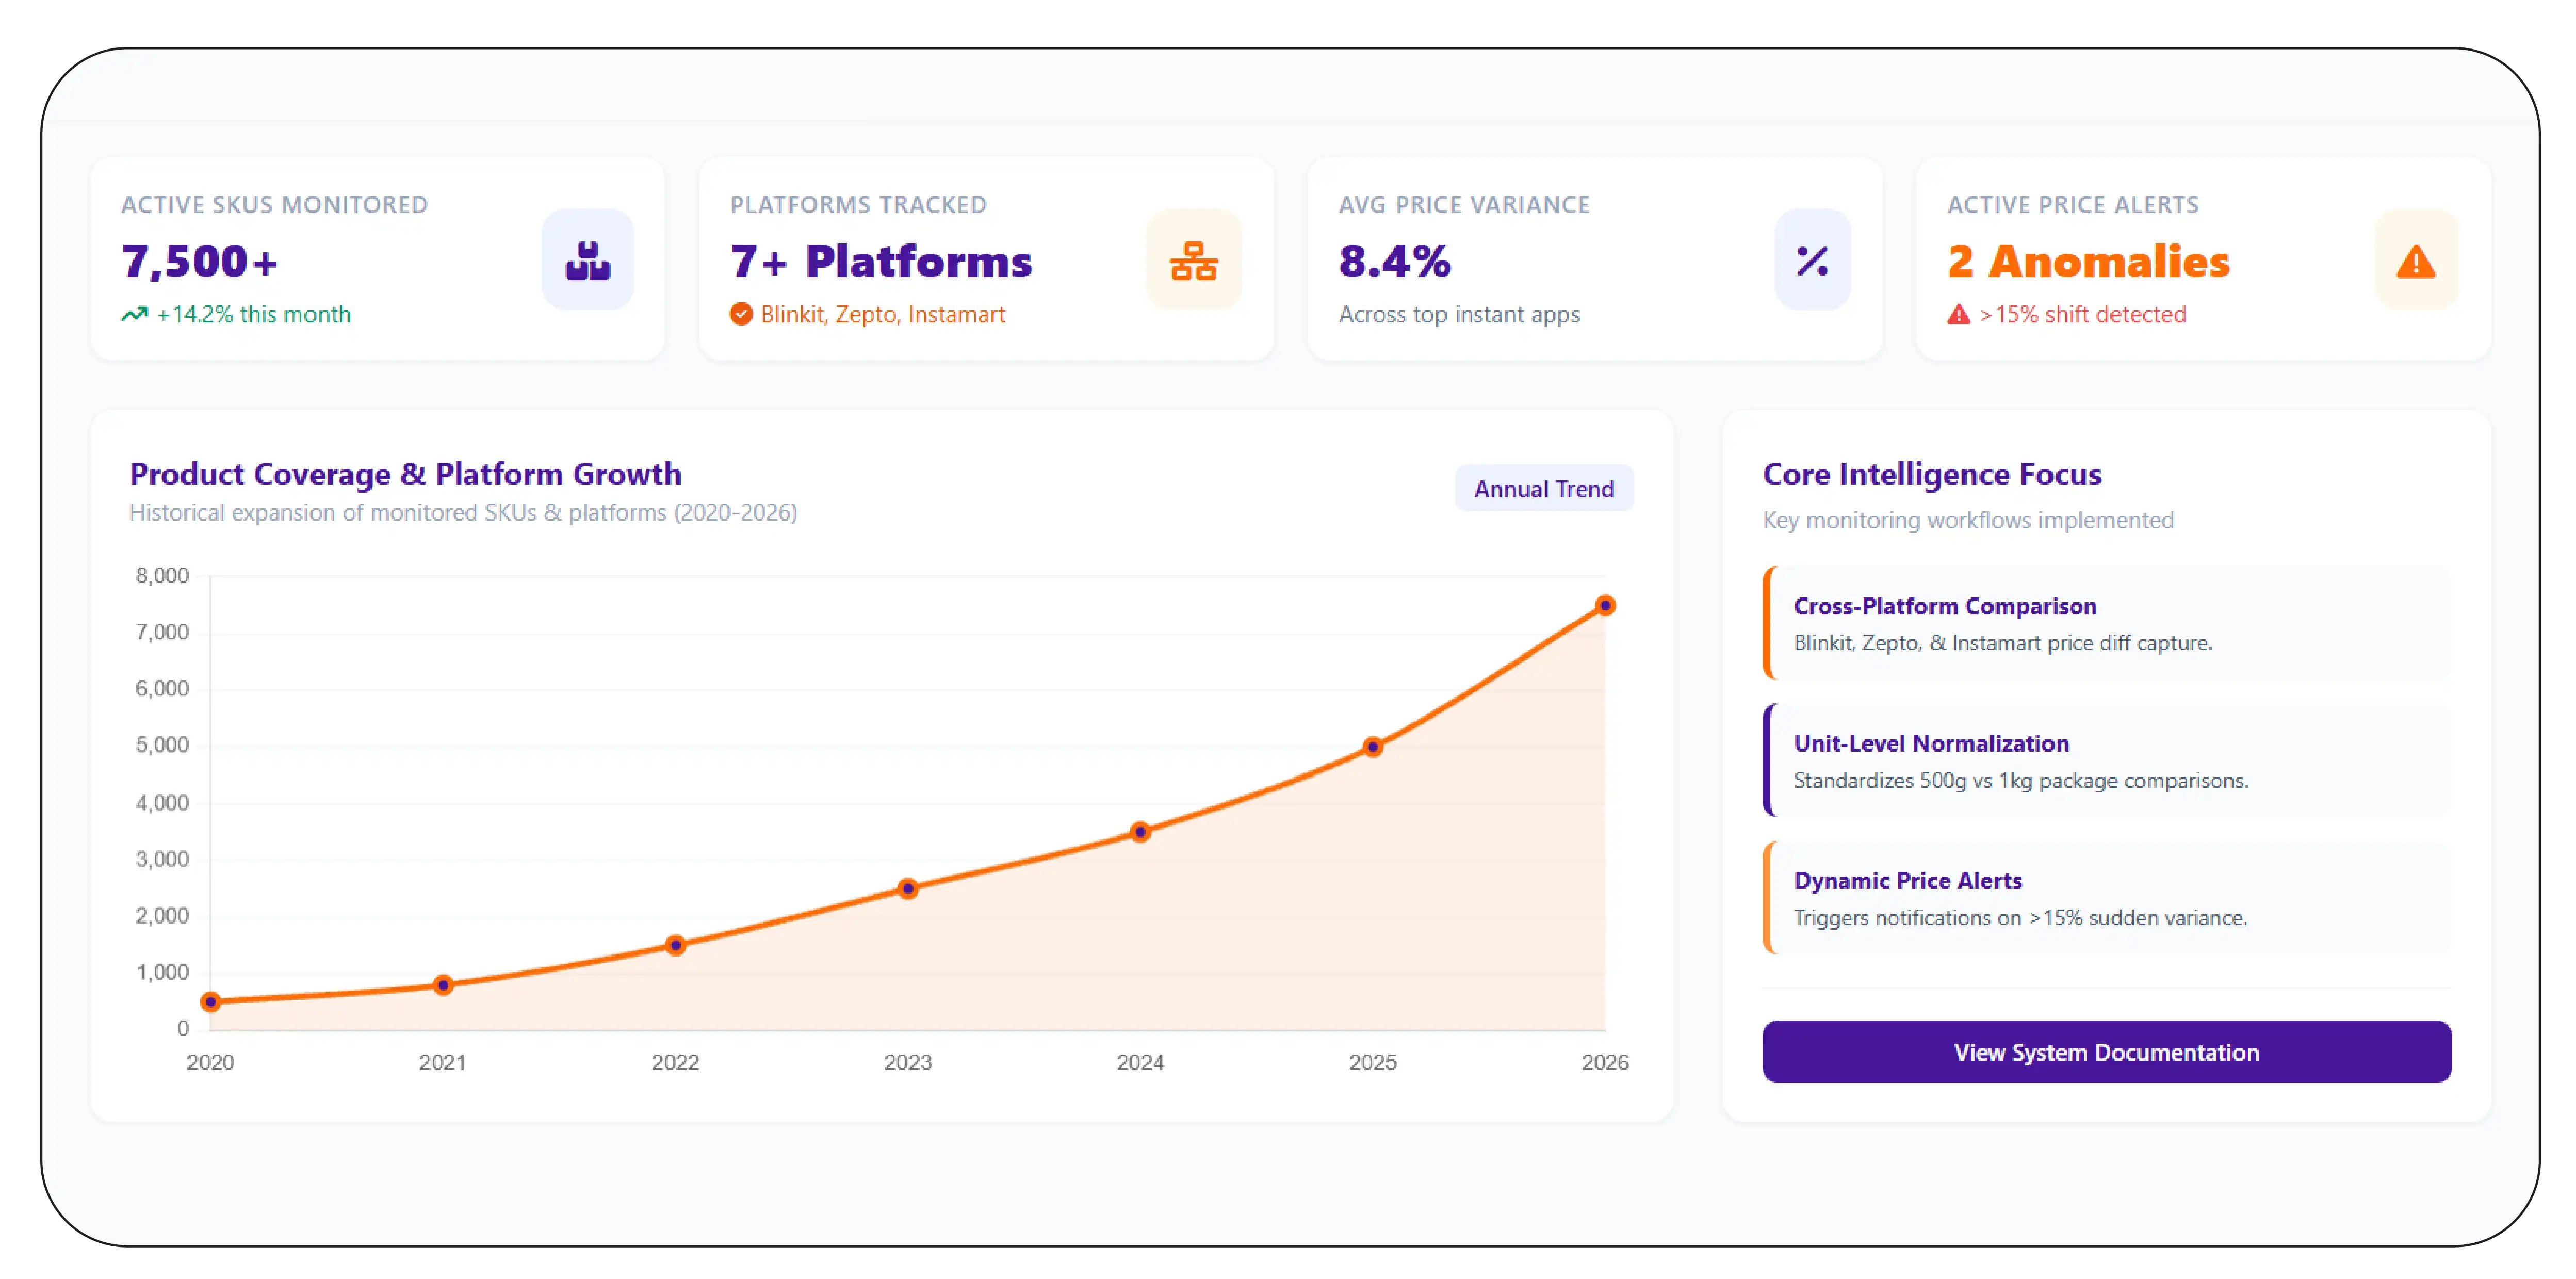
The first priority is cross-platform price comparison. Blinkit, Zepto, and Instamart can display different prices for similar products. Prices can also vary by location, promotion, pack size, and availability. A structured Blinkit, Zepto & Instamart Price Monitoring API can help businesses collect these differences into a common dataset.
The process starts with product identification. Each product receives a consistent identifier. The system then captures product name, brand, pack size, listed price, selling price, discount, availability, and collection timestamp.
This creates a historical pricing record. Teams can use it to identify which platform offers the lowest price. They can also identify when competitors change their pricing.
A retailer can use this information for price benchmarking. A consumer brand can use it for channel monitoring. A marketplace can use it to evaluate its own pricing position.
Illustrative Cross-Platform Monitoring Scale (2020–2026)
| Year |
Illustrative Product Coverage |
Average Platforms Compared |
Key Monitoring Focus |
| 2020 |
500 |
2 |
Basic price comparison |
| 2021 |
800 |
3 |
Discount tracking |
| 2022 |
1,500 |
4 |
Availability monitoring |
| 2023 |
2,500 |
5 |
Competitor benchmarking |
| 2024 |
3,500 |
6 |
Promotion tracking |
| 2025 |
5,000 |
7 |
Dynamic price monitoring |
| 2026 |
7,500 |
7+ |
Automated intelligence |
A strong monitoring workflow should also normalize pack sizes. A 500-gram product and a 1-kilogram product should not be compared using only their listed prices. Unit-level pricing provides a more accurate view.
The system can calculate price differences, discount percentages, and historical changes. It can also flag unusual movements. For example, a 15% price increase can trigger an alert for a pricing analyst.
This approach helps businesses move from basic price collection to continuous competitive monitoring.
How Can Grocery Brands Monitor Pricing Across More Retail Platforms?
Grocery pricing becomes difficult to monitor when businesses operate across several digital channels. BigBasket and Amazon Fresh may structure their product information differently. Product titles, pack sizes, discounts, and availability indicators can vary.
A BigBasket Pricing Data API can help collect structured pricing information for comparison and historical analysis. Similarly, an Amazon Fresh Product Data Scraper can collect relevant product listing information from supported pages.
The objective is not simply to collect prices. The objective is to create a consistent dataset.
A structured record can include:
- Product name
- Brand
- Category
- Pack size
- MRP
- Selling price
- Discount
- Availability
- Product URL
- Collection timestamp
- Location or service area
This structure helps analysts compare similar products across platforms.
Illustrative Data Structure Scale (2020–2026)
| Year |
Illustrative Data Fields |
Data Refresh |
Primary Business Use |
| 2020 |
6 |
Monthly |
Basic research |
| 2021 |
8 |
Weekly |
Price comparison |
| 2022 |
10 |
Weekly |
Product monitoring |
| 2023 |
12 |
Daily |
Competitive analysis |
| 2024 |
14 |
Multiple times/day |
Promotion tracking |
| 2025 |
16 |
Hourly |
Pricing intelligence |
| 2026 |
18+ |
Near real-time |
Automated decisions |
Product matching is another important step. The same item may have different names across platforms. A good data pipeline can use brand, product title, pack size, category, and other attributes to identify comparable records.
This makes the resulting dataset more useful for category managers and pricing teams.
Businesses can also monitor assortment changes. A product disappearing from one platform may indicate a stock issue. A new product listing may indicate a category expansion. A sudden discount may indicate a campaign.
These signals become more valuable when stored historically. Teams can compare current information with previous weeks, months, and years.
How Does Automated Monitoring Improve Grocery Price Intelligence?
Quick commerce has created a strong need for frequent pricing updates. Customers can compare prices quickly. Competitors can react quickly. Retailers therefore need data that reflects current marketplace conditions.
An Amazon Now Grocery Pricing API can support structured collection of relevant grocery pricing information from supported sources. The data can then be compared with other quick-commerce platforms.
The broader Quick Commerce Price Monitoring API India approach connects these individual data streams into a common monitoring framework.
This framework can track:
- Price changes.
- Discount changes.
- Product availability.
- New product listings.
- Removed products.
- Pack-size differences.
- Promotional activity.
- Competitor price gaps.
Illustrative Automated Monitoring Scale (2020–2026)
| Year |
Illustrative Monitoring Frequency |
Price Events Tracked/Month |
Primary Outcome |
| 2020 |
Monthly |
1,000 |
Market research |
| 2021 |
Weekly |
3,000 |
Basic benchmarking |
| 2022 |
Daily |
10,000 |
Price trend analysis |
| 2023 |
2x Daily |
25,000 |
Competitor monitoring |
| 2024 |
4x Daily |
50,000 |
Promotion intelligence |
| 2025 |
Hourly |
150,000 |
Dynamic monitoring |
| 2026 |
Near real-time |
300,000+ |
Automated pricing signals |
These figures are illustrative and show how monitoring requirements can expand as businesses increase product coverage.
Historical data provides another advantage. A company can determine whether a price movement is temporary or part of a broader trend.
For example, a competitor may reduce the price of a product for one weekend. A single snapshot would show the discount but not its duration. Historical monitoring can show when the discount started, how long it lasted, and when the original price returned.
This information supports better pricing decisions.
Businesses can also create alerts. A price change beyond a defined threshold can trigger a notification. A sudden availability change can also be flagged.
This reduces the time analysts spend searching for changes manually.
How Can Businesses Track Emerging Quick-Commerce Competitors?
The quick-commerce landscape continues to evolve. New platforms and new fulfillment models can change competitive dynamics. Businesses need a flexible monitoring system that can accommodate new channels.
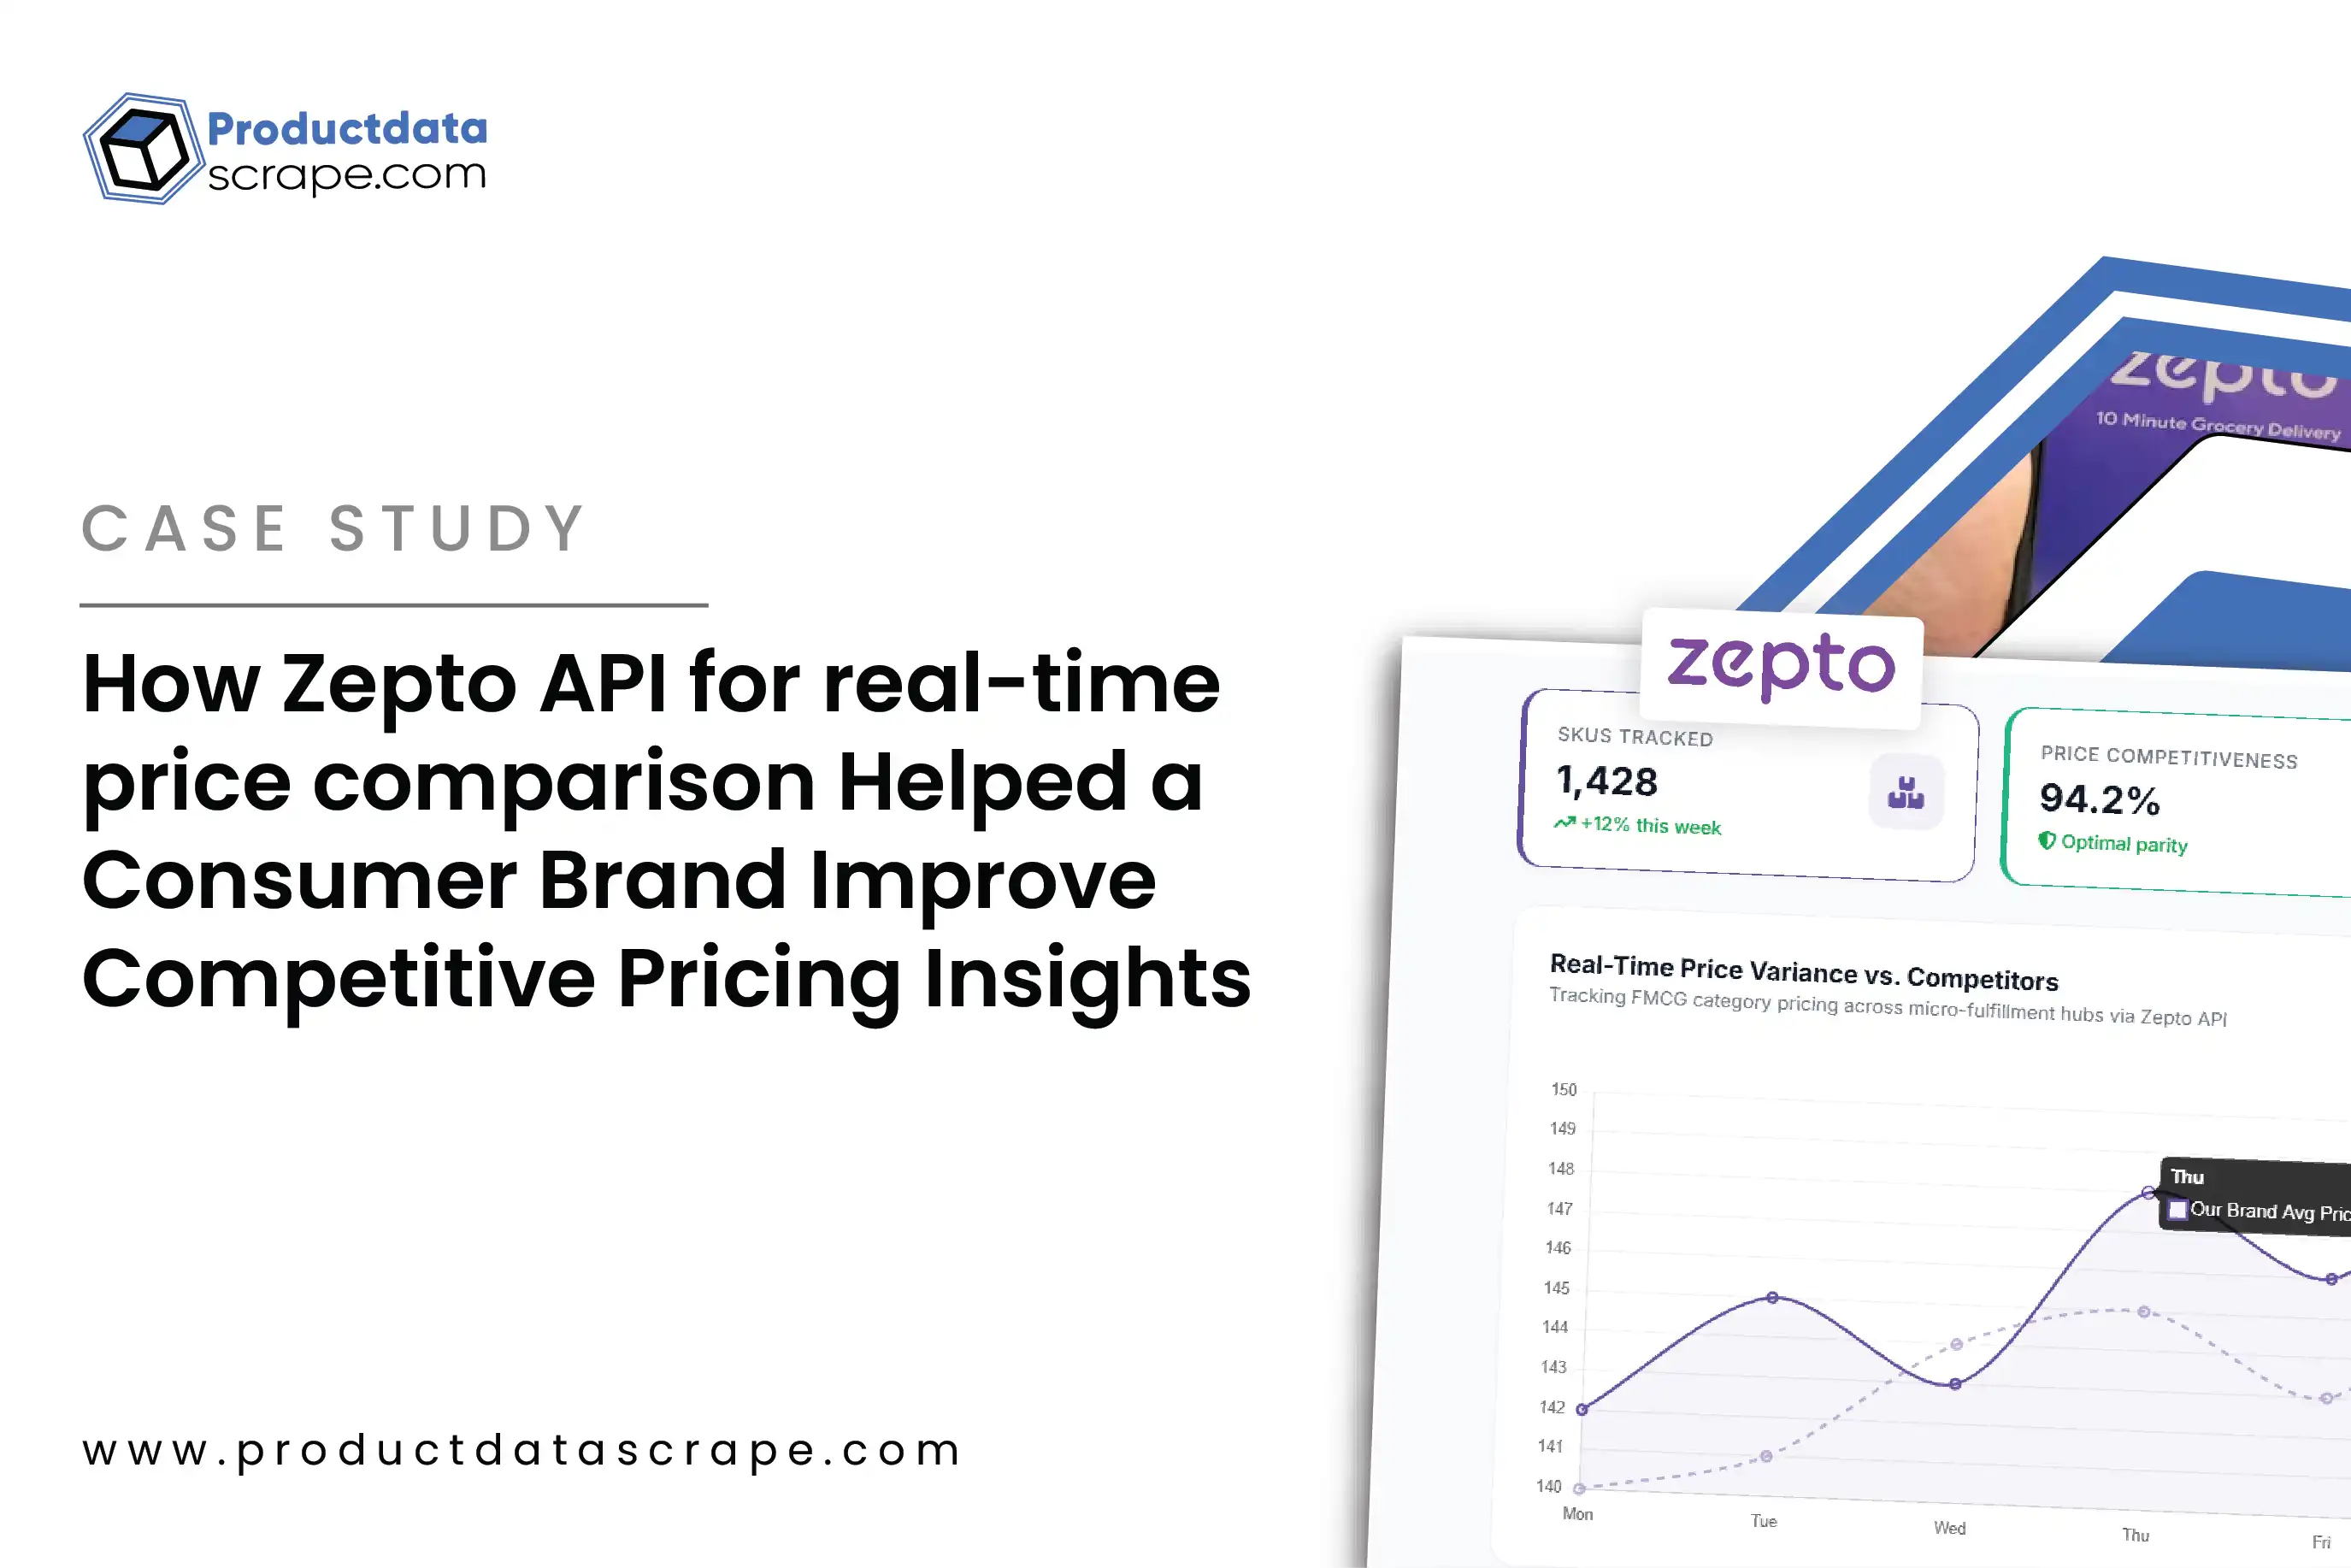
A Zepto pricing API can support structured monitoring of relevant product pricing information. A Flipkart Minutes Q-Commerce API can similarly help businesses incorporate another quick-commerce channel into their competitive dataset.
The goal is to create one consistent analytical view.
Illustrative Platform Coverage Scale (2020–2026)
| Year |
Illustrative Platforms Monitored |
Product Records |
Key Focus |
| 2020 |
2 |
500 |
Price tracking |
| 2021 |
3 |
800 |
Promotions |
| 2022 |
4 |
1,500 |
Availability |
| 2023 |
5 |
2,500 |
Market comparison |
| 2024 |
6 |
3,500 |
Assortment intelligence |
| 2025 |
7 |
5,000 |
Competitive pricing |
| 2026 |
7+ |
7,500+ |
Automated intelligence |
Location-based monitoring is also important. Quick-commerce prices can differ by service area. Availability can also vary depending on local inventory.
A business operating in Mumbai, Delhi, Bengaluru, Ahmedabad, or other markets may therefore need city-level or store-level monitoring.
Location data can be attached to each price observation. This creates a richer dataset.
For example:
Product → Platform → City → Store/Service Area → Price → Availability → Timestamp
This structure helps businesses identify regional pricing differences.
A retailer can use it to compare its pricing with local competitors. A brand can identify where promotions are stronger. An analyst can study geographic price variation.
The system can also support historical comparisons. Teams can compare current prices with previous months or years.
That makes the data useful for seasonal analysis, campaign measurement, and competitive planning.
What Can Product-Level Monitoring Reveal About Competitor Strategy?
Product-level monitoring provides deeper insights than a simple list of prices. Businesses can determine which products competitors discount, which categories remain stable, and which products frequently go out of stock.
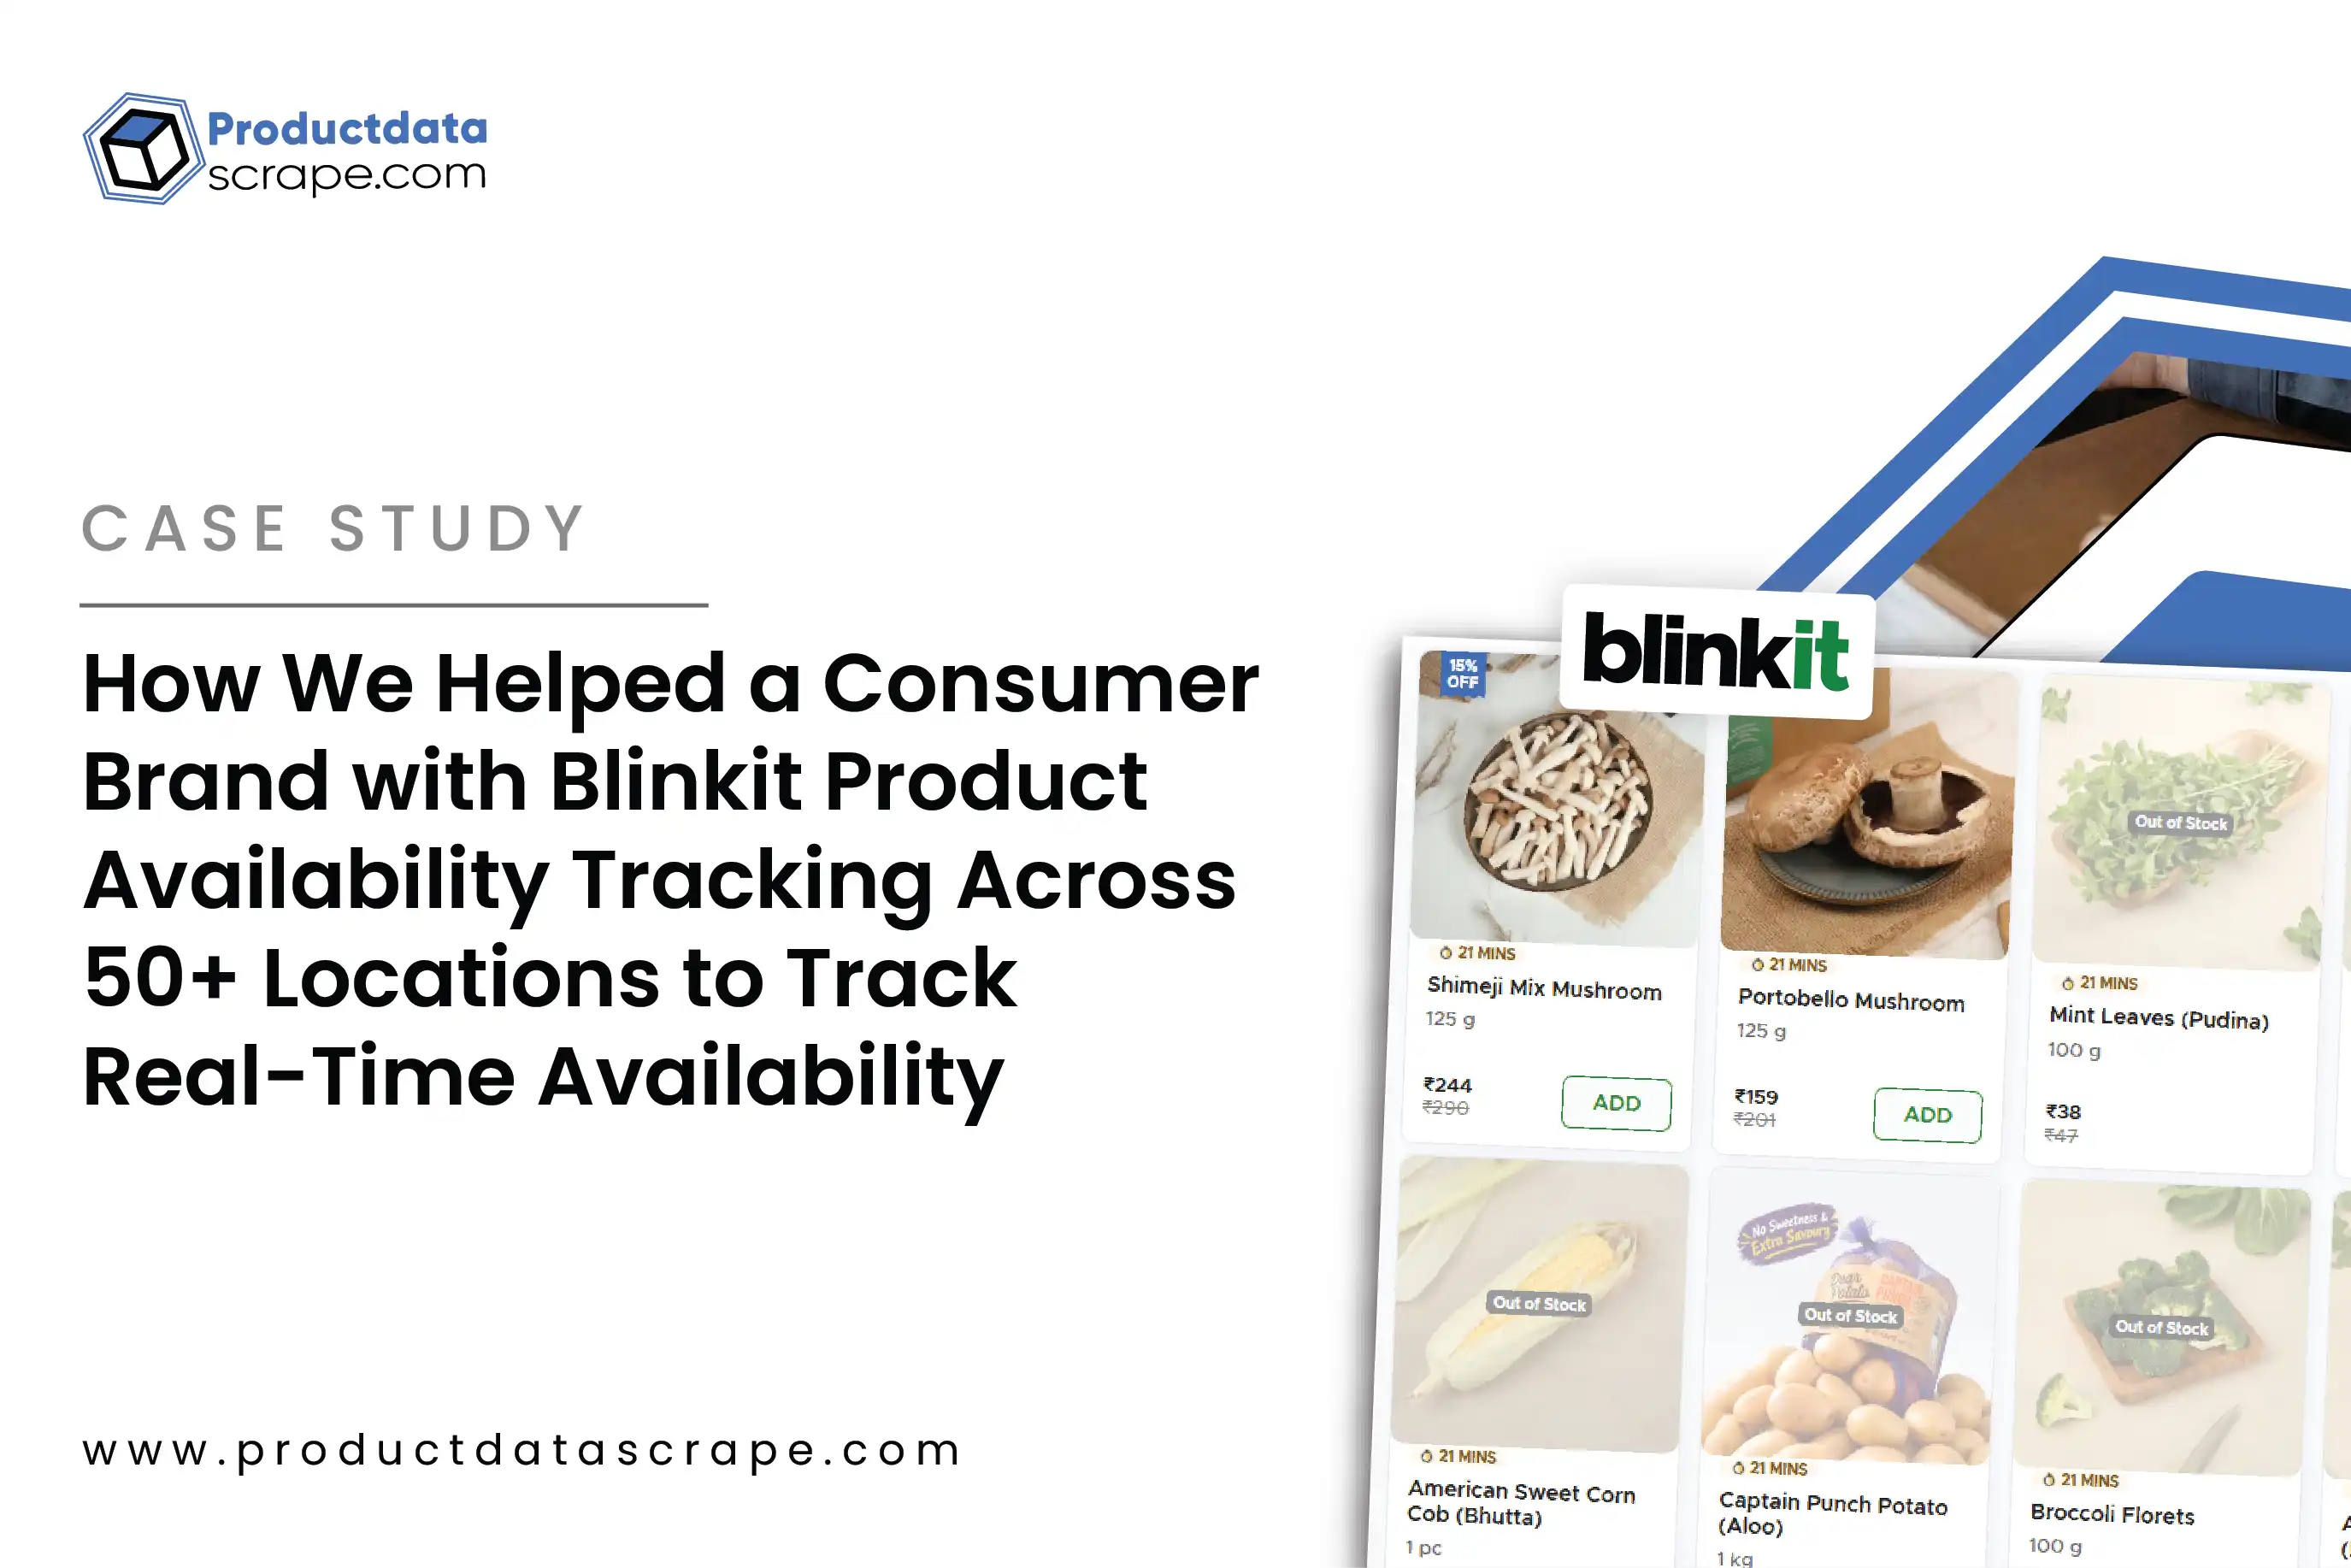
A Blinkit product price API can support structured product-level monitoring for relevant use cases. The platform's product information can then become part of a larger competitive dataset.
Blinkit monitoring can include product prices, discounts, availability, pack sizes, categories, and other publicly visible listing attributes.
Illustrative Product-Level Monitoring Scale (2020–2026)
| Year |
Illustrative Products Monitored |
Price Checks/Month |
Example Insight |
| 2020 |
500 |
1,000 |
Basic price gaps |
| 2021 |
800 |
2,500 |
Discount changes |
| 2022 |
1,500 |
6,000 |
Category trends |
| 2023 |
2,500 |
15,000 |
Competitor strategy |
| 2024 |
3,500 |
30,000 |
Promotional intensity |
| 2025 |
5,000 |
75,000 |
Dynamic price movements |
| 2026 |
7,500 |
150,000+ |
Automated alerts |
These figures are illustrative monitoring benchmarks.
The value comes from the history behind every record.
Suppose a snack brand has a stable price for six months. A competitor suddenly offers a 20% discount. The business can identify the change quickly. It can then evaluate whether the discount affects its own sales strategy.
The same approach works for household products, beverages, packaged foods, personal care products, and other categories.
Availability is equally important. A lower price does not always mean a stronger competitive position if the product is unavailable.
Teams can therefore combine price and availability signals.
For example:
- Low price + high availability = strong competitive position.
- Low price + low availability = temporary advantage.
- High price + high availability = premium positioning.
- High price + low availability = potential supply issue.
This type of analysis gives pricing teams more context.
It also helps brands measure promotional effectiveness. If a discount appears repeatedly, analysts can identify its frequency and duration.
How Can Businesses Monitor Instamart and Build Long-Term Pricing History?
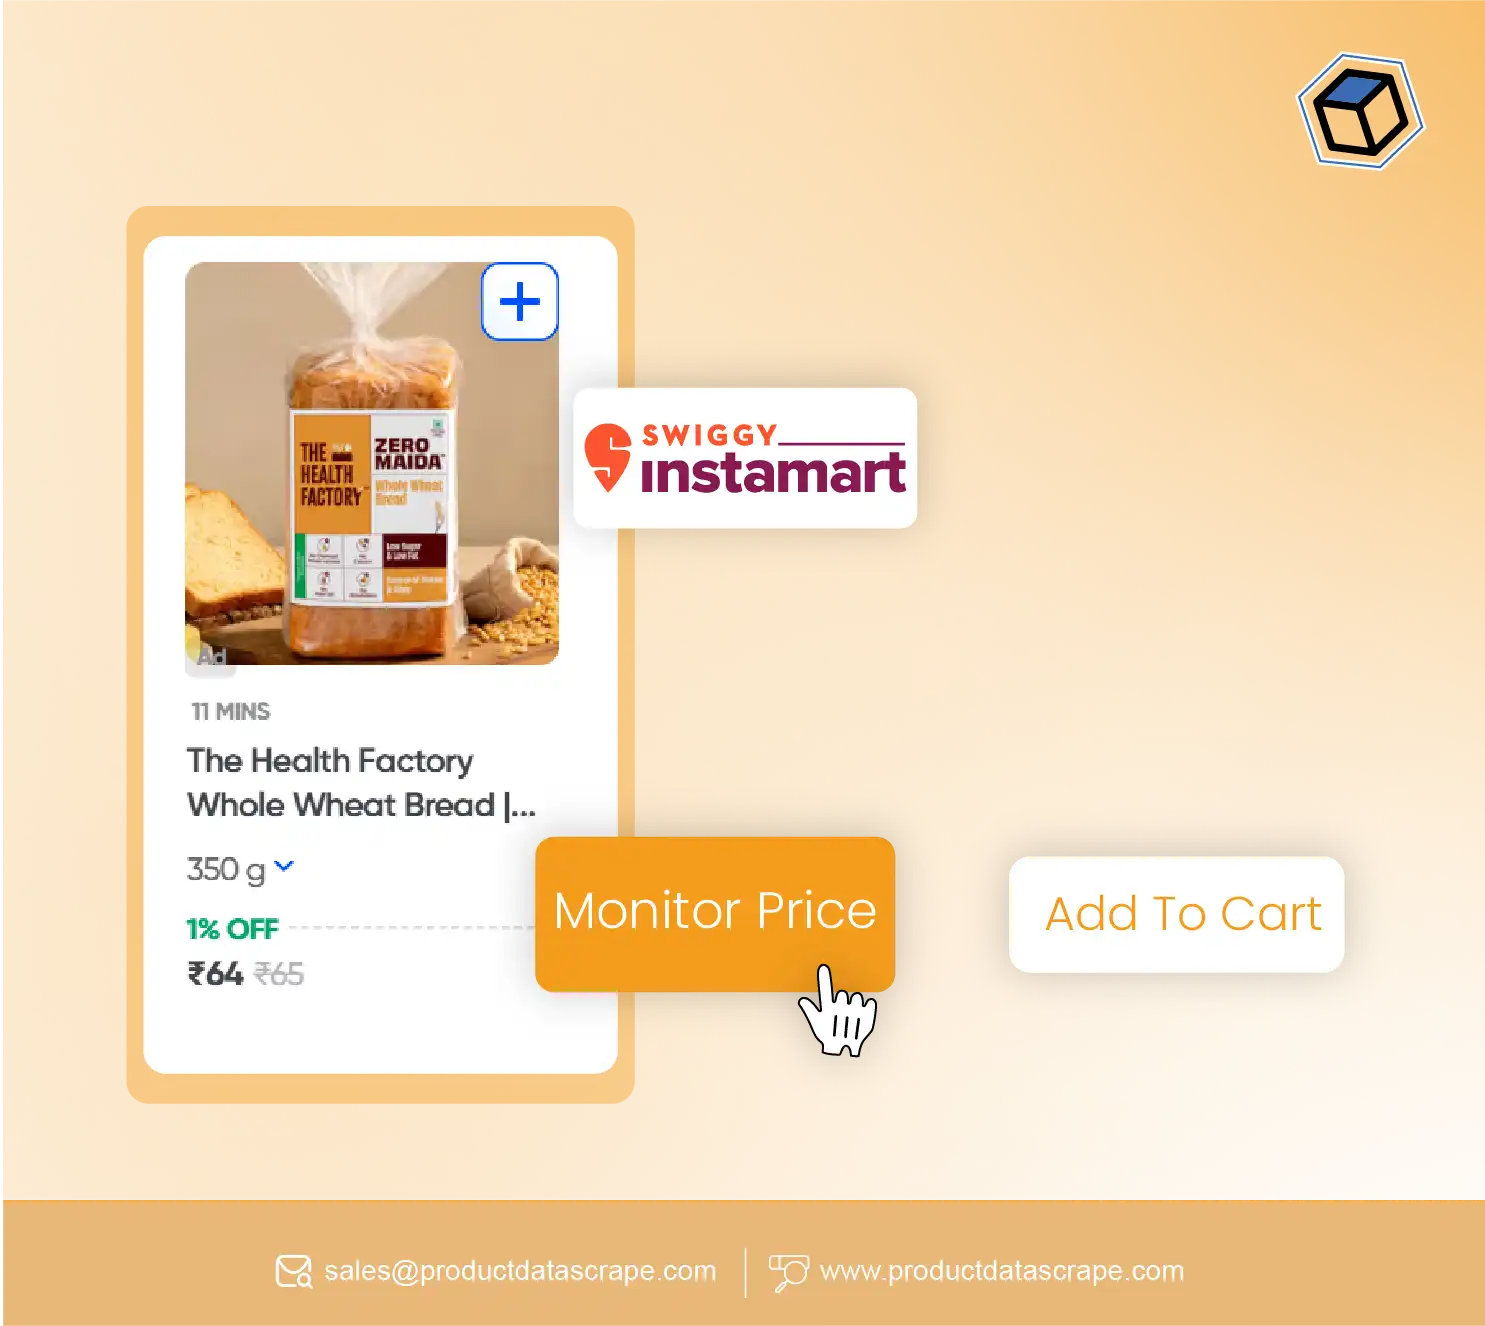
Swiggy Instamart represents another important source for quick-commerce market intelligence. Businesses that compare multiple platforms need consistent collection methods across their monitored sources.
A Swiggy Instamart data API can help structure relevant marketplace information for analysis and integration. Product records can include pricing, discounts, availability, categories, and timestamps where publicly available.
The broader Quick Commerce Price Monitoring API India framework can combine this information with other monitored platforms.
Illustrative Data Integration Scale (2020–2026)
| Year |
Illustrative Product Coverage |
Platforms |
Data Refresh |
| 2020 |
500 |
2 |
Monthly |
| 2021 |
800 |
3 |
Weekly |
| 2022 |
1,500 |
4 |
Daily |
| 2023 |
2,500 |
5 |
Daily |
| 2024 |
3,500 |
6 |
Multiple times/day |
| 2025 |
5,000 |
7 |
Hourly |
| 2026 |
7,500+ |
7+ |
Near real-time |
Long-term historical data creates several benefits.
First, businesses can identify seasonal pricing patterns. Grocery categories often experience different demand patterns during festivals, holidays, weekends, and promotional periods.
Second, companies can measure competitor behavior. A competitor that regularly discounts specific products may have a different pricing strategy from one that maintains stable prices.
Third, businesses can measure price volatility. Some products may experience frequent changes. Others may remain stable.
Fourth, historical datasets support forecasting. Analysts can use previous observations to understand potential future movements. Forecasting should not rely only on historical price data. It should also consider promotions, availability, demand, and other business signals.
The data can also feed dashboards. A dashboard can display the lowest price, average price, highest price, discount percentage, availability rate, and price change over time.
This makes large datasets easier for business teams to understand.
The key is consistency. Data should follow the same schema across platforms and collection cycles. That allows reliable comparisons over time.
Why Should Businesses Choose a Specialized Data Partner?
Quick-commerce data requires scale, consistency, and flexible extraction workflows. A specialized provider can manage complex collection requirements while allowing business teams to focus on analysis.
The solution can support Flipkart Minutes pricing API requirements for businesses that want to monitor emerging quick-commerce channels. It can also incorporate JioMart Quick Commerce Data Scraping API workflows for broader competitive coverage.
Key advantages include:
- Scalable collection: Monitor thousands of products across multiple platforms.
- Structured datasets: Receive normalized records that are easier to compare.
- Historical tracking: Maintain pricing history for trend analysis.
- Flexible schedules: Support daily, hourly, or custom collection cycles.
- Product matching: Compare equivalent products across different listings.
- Change detection: Identify important price and availability movements.
- Custom outputs: Deliver data in formats suited to dashboards, databases, and analytics systems.
A good data workflow also separates collection from analysis. This makes the infrastructure easier to maintain.
Businesses can start with a focused category. They can then expand into additional products, cities, platforms, and attributes.
This approach controls costs while creating a clear path for growth.
The third-party data partner should also provide clear data definitions. Teams should know what each field means, how often it updates, and how records are matched.
For complex pricing programs, this transparency matters.
Conclusion
Quick-commerce platforms move fast. Prices, discounts, product availability, and assortments can change throughout the day. Businesses need structured information to understand these movements.
A JioMart grocery API can contribute additional marketplace information to a broader competitive dataset. Automated Price scraping can then collect recurring observations for historical comparison and analysis.
The result is a stronger foundation for pricing intelligence. Teams can compare competitors, monitor promotions, identify price gaps, track availability, and understand regional differences.
The right Quick Commerce Price Monitoring API India solution can turn fragmented marketplace information into structured business intelligence.
With the right collection frequency and product coverage, businesses can move from occasional price checks to continuous monitoring.
Partner with Product Data Scrape to build a scalable quick-commerce pricing data solution tailored to your products, platforms, locations, and competitive intelligence goals!
FAQs
1. What is quick-commerce price monitoring?
Quick-commerce price monitoring tracks product prices, discounts, availability, and promotions across fast-delivery platforms. It helps businesses compare competitors and identify pricing changes.
2. Which platforms can businesses monitor?
Businesses can monitor platforms such as Zepto, Blinkit, Instamart, BigBasket, Amazon Now, Flipkart Minutes, and JioMart, depending on their data requirements.
3. How often should prices be monitored?
Monitoring frequency depends on the category. High-volatility products may require hourly or near-real-time checks, while stable categories may need daily monitoring.
4. Can historical pricing data be collected?
Yes. Historical datasets can store product prices, discounts, availability, and timestamps. Businesses can use this information to analyze trends and measure competitive pricing changes.
5. Can Product Data Scrape provide custom quick-commerce datasets?
Yes. Custom datasets can be structured around selected platforms, products, categories, locations, attributes, refresh schedules, and output formats for specific business requirements.


 Singapore
 EMAIL
EMAIL
 PHONE
PHONE


.webp "thumb")













.webp)






