The Client
A national FMCG brand in the packaged foods and home-care space, with a catalogue of roughly 180 SKUs on Flipkart and a sales organisation structured across five regional territories. Flipkart was the brand's second-largest online channel and its fastest-growing one.
Client details are anonymised. Figures are representative of the engagement.
The Problem: A National Brand With a Metro-Sized View
The brand's e-commerce team ran a price-monitoring dashboard. It was well built, updated daily, and used in the weekly pricing review. It was also captured entirely from a single metro location.
Every pricing decision the brand made — every promotional response, every competitive benchmark, every price-integrity check — rested on data from one pincode.
The team knew this was a limitation. What they did not know was how large a limitation it was. The working assumption, shared across the organisation, was that Flipkart pricing was broadly national, with only minor delivery-time variation across regions. Nobody had tested the assumption because nobody had the data to test it with.
Three symptoms suggested something was wrong.
- Tier-2 revenue was underperforming forecast across two consecutive quarters, in regions where category demand was demonstrably growing.
- Regional sales heads were reporting price complaints from distributors — claims that the online price in their territory was out of line with the offline MRP — and the e-commerce team could not verify or refute them, because their dashboard showed one price and the distributors were describing another.
- A competitor appeared to be gaining share in specific eastern and central markets, with no visible change in the competitor's price on the brand's dashboard.
The e-commerce lead put it directly: we are making national decisions with metro data, and we have no idea how wrong we are.
The Solution: A 2,000+ Pincode Monitoring Panel
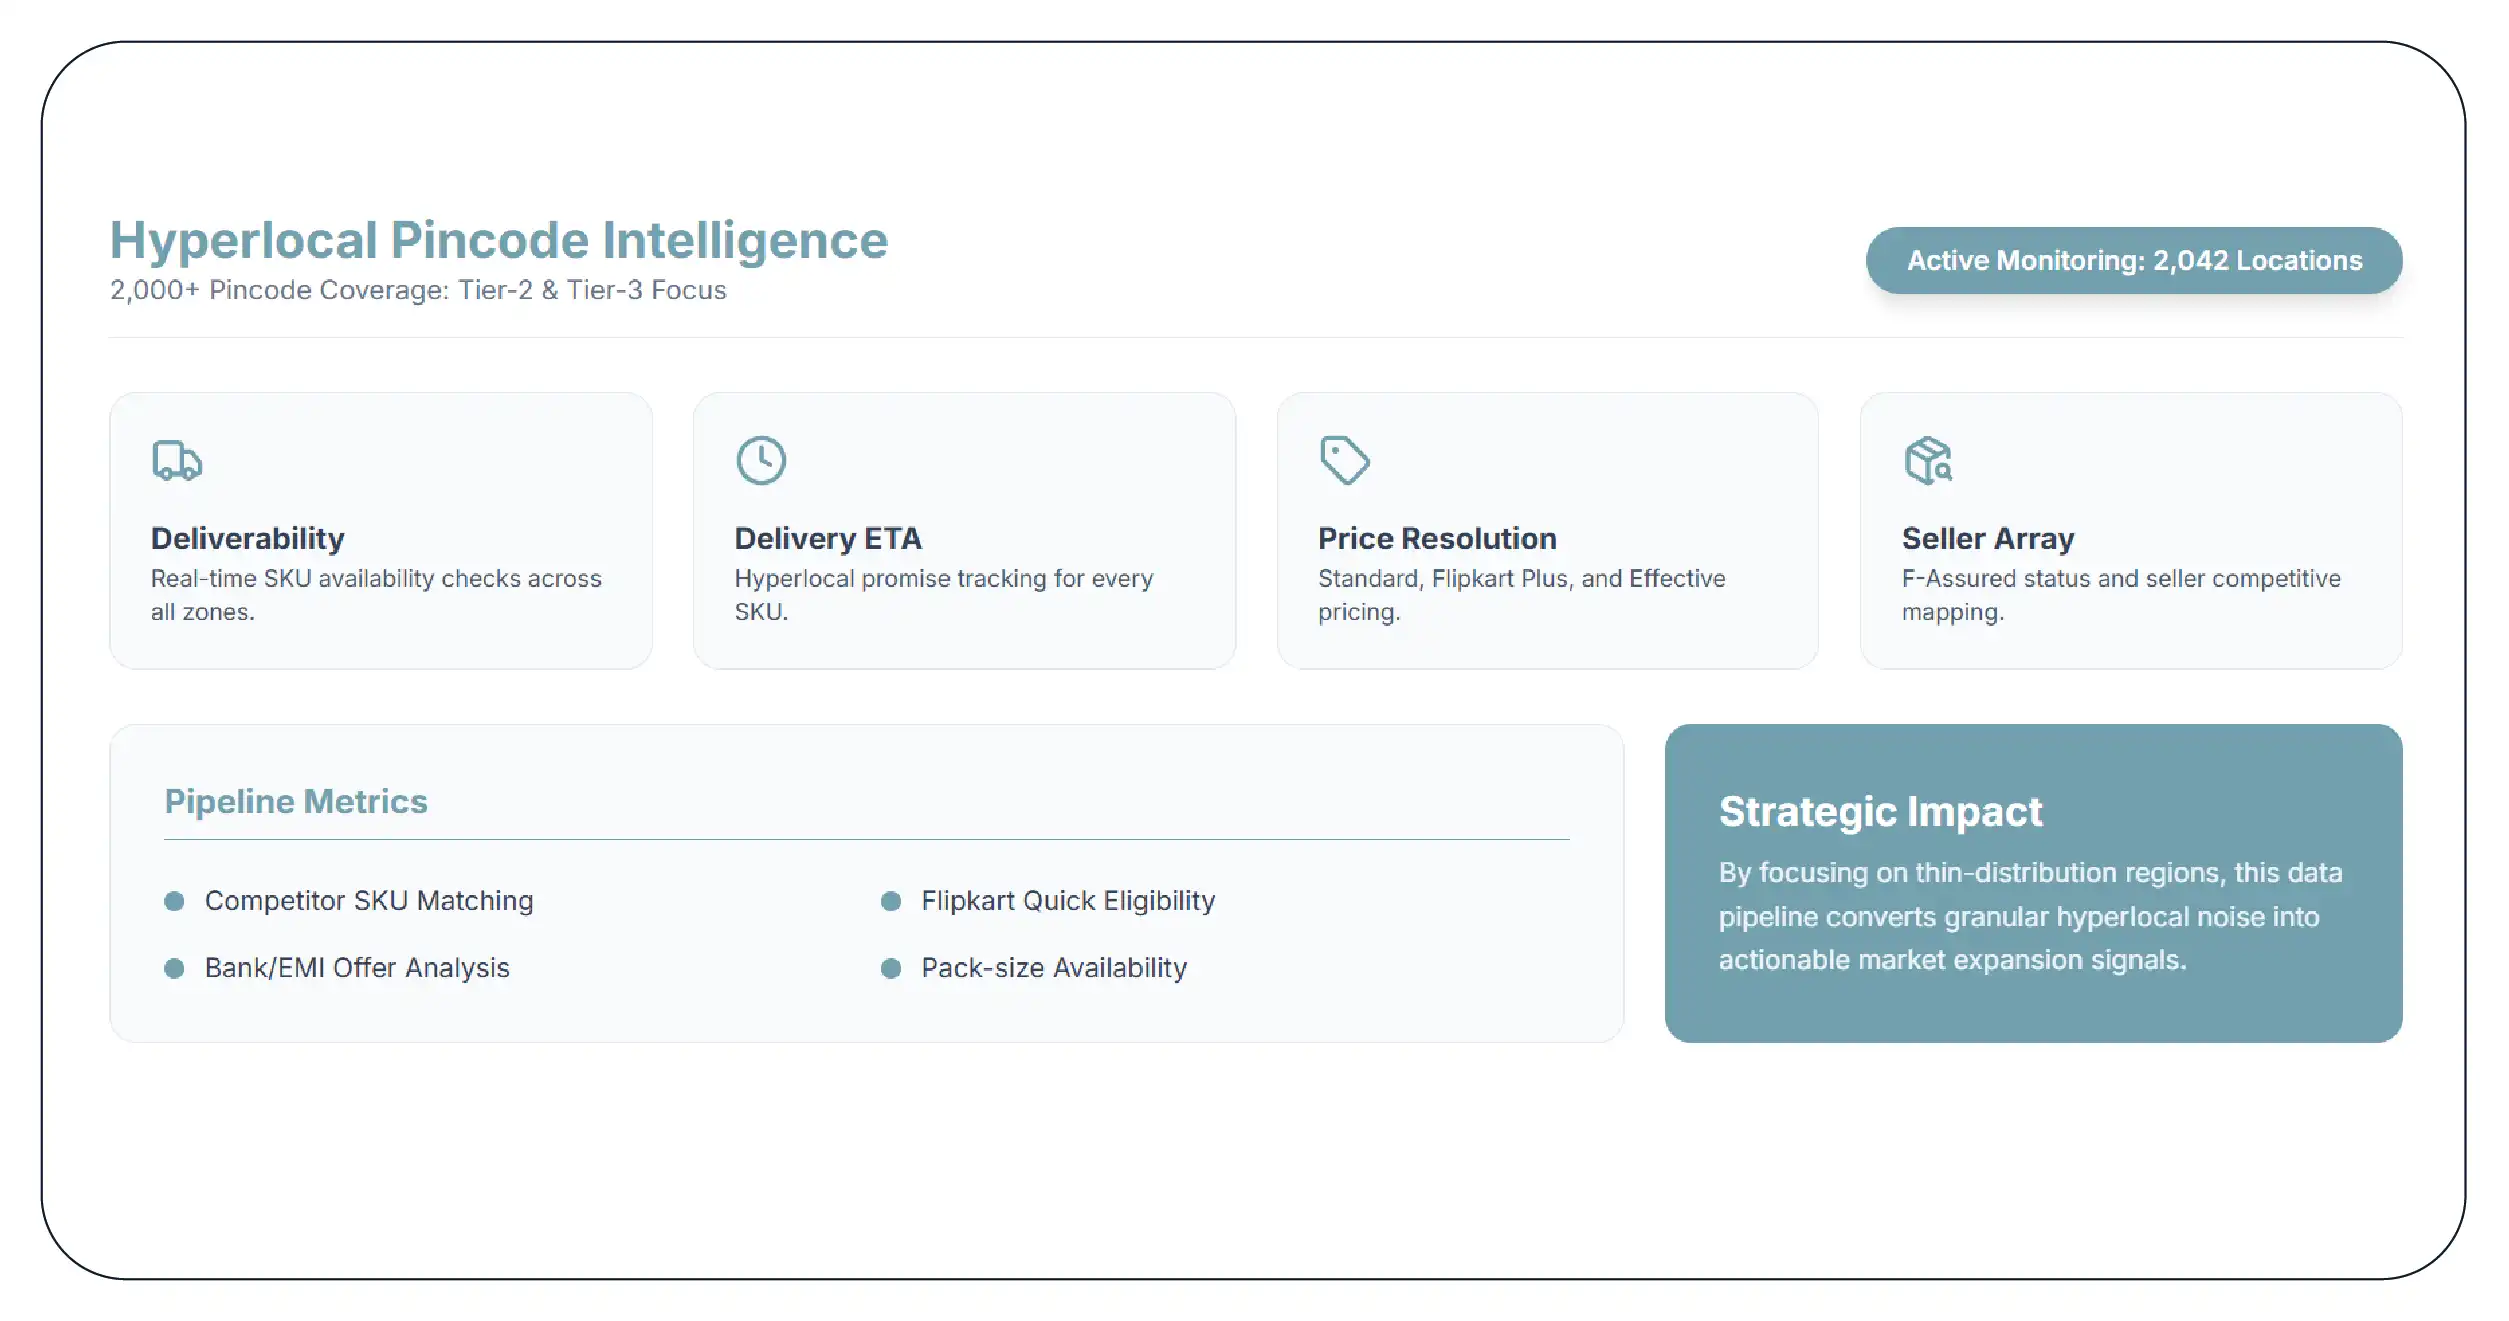
Product Data Scrape deployed a hyperlocal Flipkart pricing data pipeline built around a pincode panel spanning more than 2,000 Indian pincodes — weighted deliberately toward tier-2 and tier-3 markets and toward the regions where the brand's distribution was thinnest.
The panel captured, per SKU per pincode:
- Deliverability — whether the SKU could be delivered to that pincode at all.
- Delivery ETA — the promised delivery window.
- Standard price and Flipkart Plus price — both tiers, resolved for that location.
- Effective price — after applicable bank offers, no-cost EMI, and SuperCoin earn value.
- Full seller array — which sellers served that pincode, at what price, with F-Assured status.
- Per-variant stock — pack-size level availability.
- Flipkart Quick eligibility — whether 10-minute delivery reached that pincode.
- Competitor SKUs — the same fields for a matched competitor basket.
Capture ran daily for hero SKUs across the full panel, and weekly for the long tail across a reduced panel. Records rolled up automatically into the brand's five sales territories.
Sample Data: The Slide That Changed the Conversation
The first delivered dataset produced this view of a single hero SKU. Illustrative values.
| Territory |
Pincodes in Panel |
Deliverable % |
Median Price |
Median Effective Price |
Avg Sellers |
Quick Coverage |
| West |
512 |
96% |
449 |
405 |
5.2 |
41% |
| South |
478 |
94% |
449 |
412 |
4.8 |
33% |
| North |
466 |
91% |
459 |
429 |
3.9 |
22% |
| Central |
331 |
79% |
479 |
471 |
2.1 |
4% |
| East |
289 |
62% |
489 |
489 |
1.4 |
0% |
The metro-only dashboard had been reporting a price of 449 and an effective price of 405.
In the East, the median price was 489, the effective price was also 489 — because the bank offers driving the metro discount were not applicable there — and 38 percent of panel pincodes could not receive the product at all.
The gap between what the brand believed and what was true: 84 rupees on effective price, roughly 21 percent, in the territory that was underperforming forecast most severely.
And the mechanism was visible in the same table. Seller depth collapsed from 5.2 in the West to 1.4 in the East. With effectively one seller and no competition, there was no downward price pressure. The brand's product was more expensive in exactly the markets least able to absorb the premium.
The distributor complaints the regional heads had been forwarding were not noise. They were accurate, and the brand had been unable to see it.
What the First 30 Days Surfaced
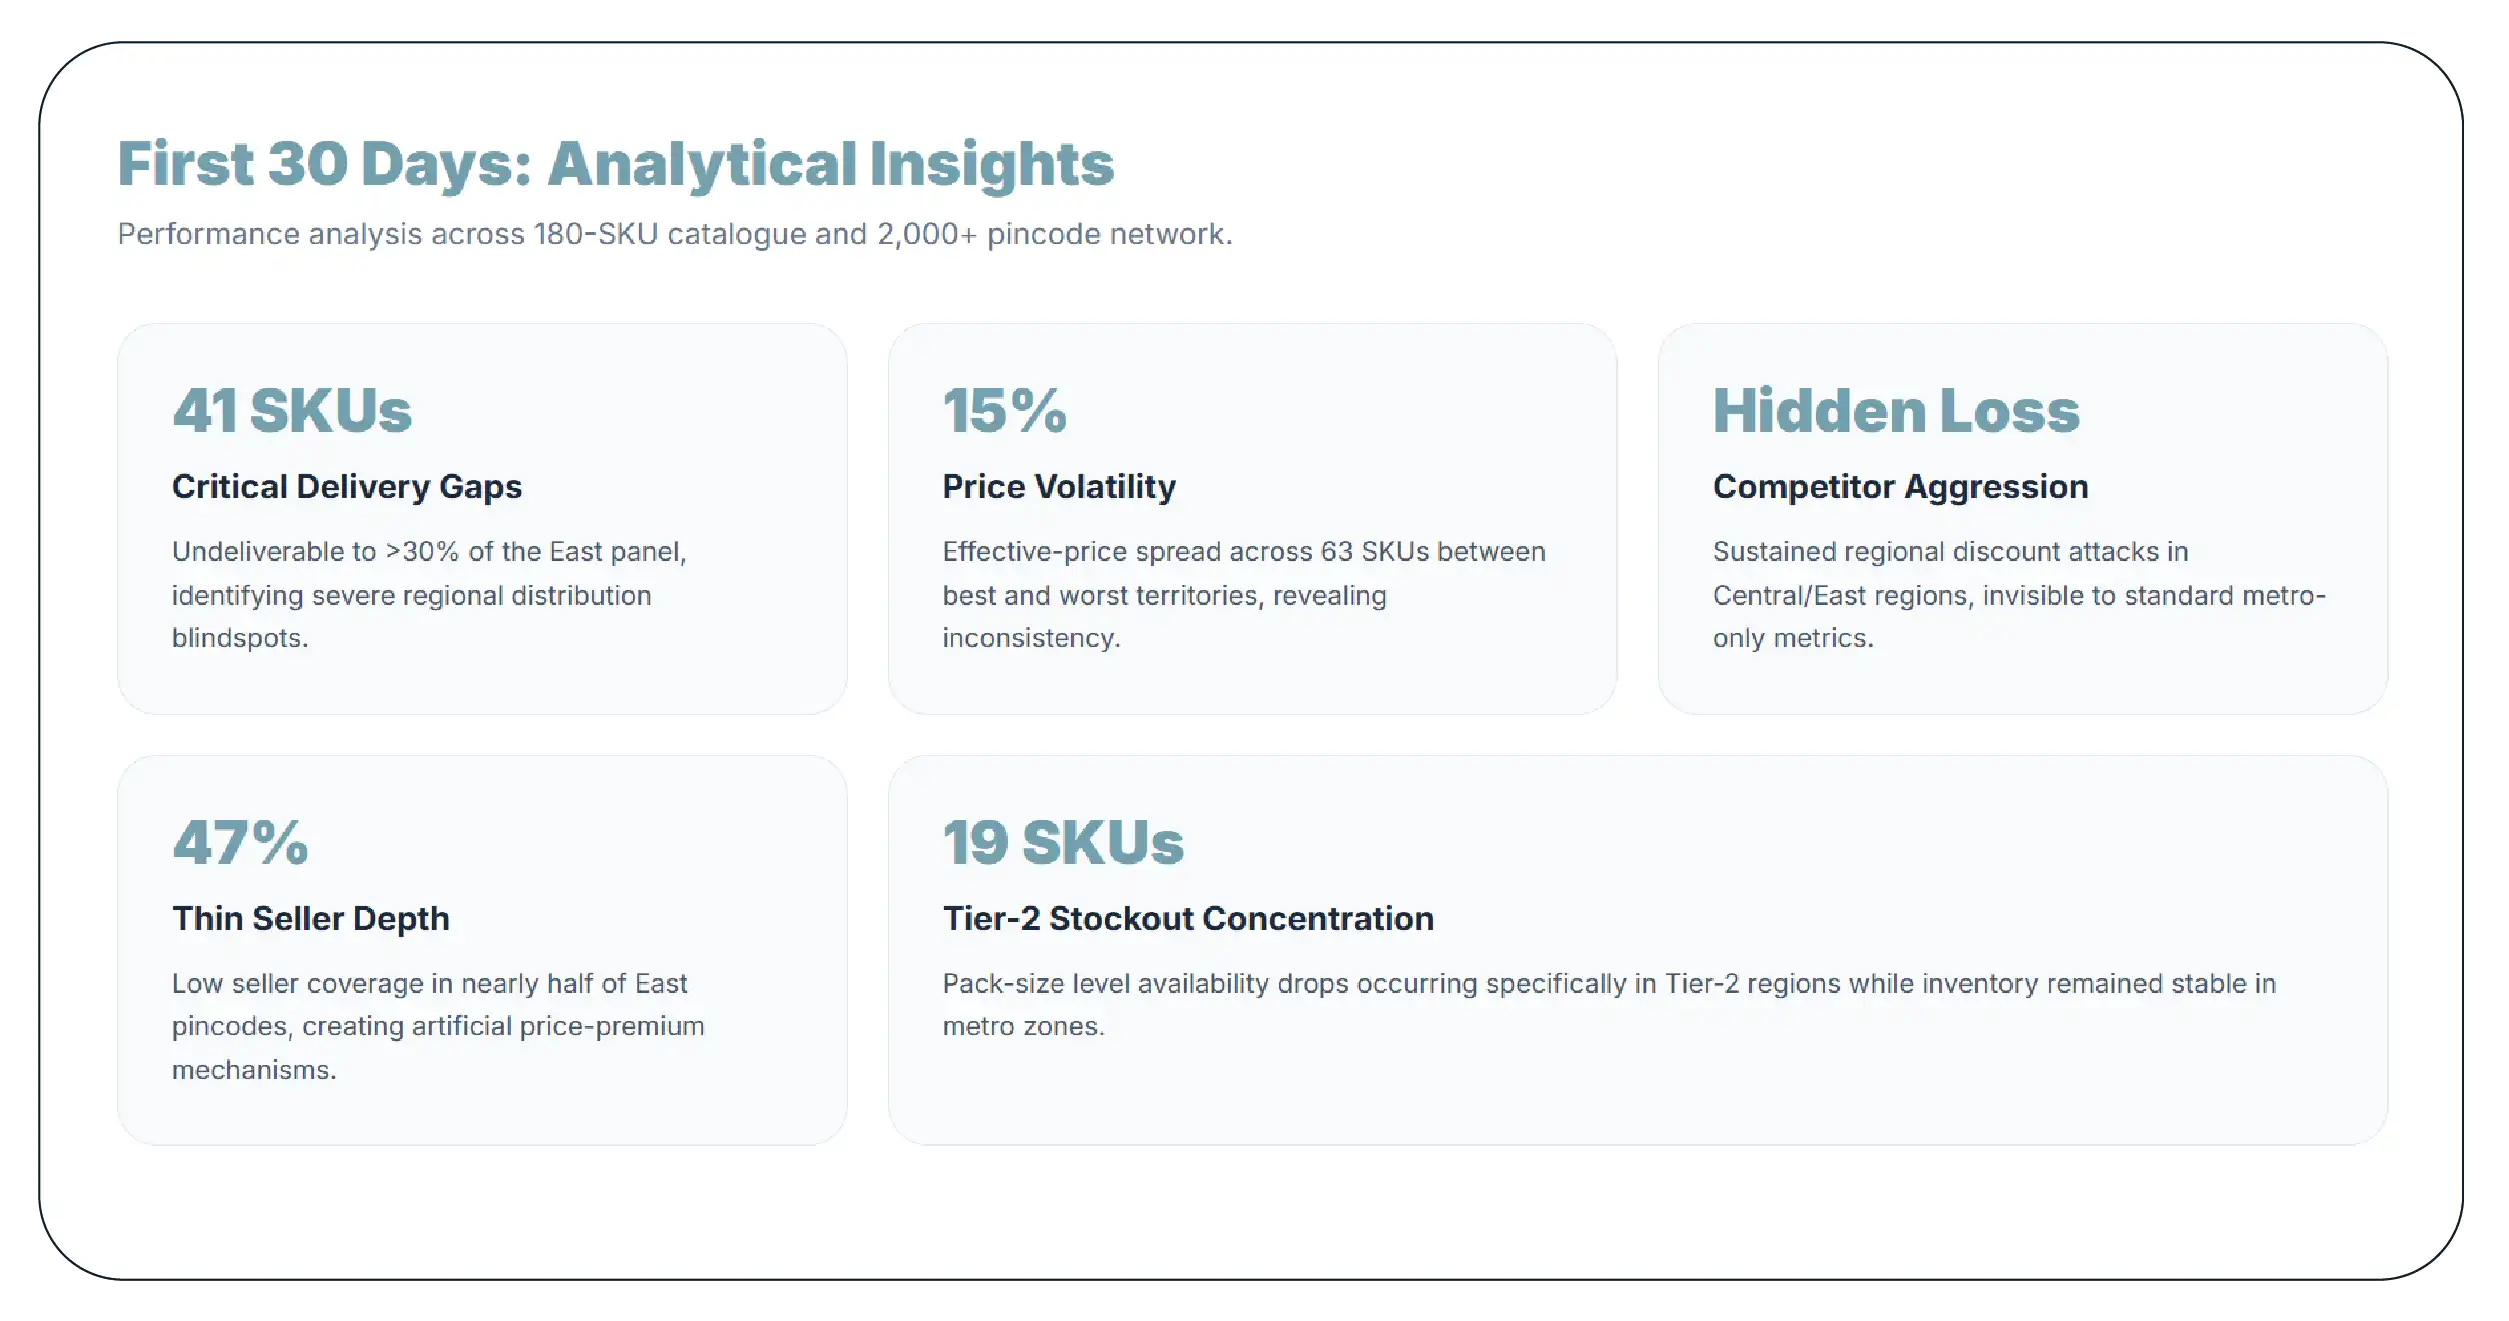
Across the full 180-SKU catalogue:
- 41 SKUs were undeliverable to more than 30 percent of the East panel.
- The effective-price spread between best and worst territory exceeded 15 percent on 63 SKUs.
- A competitor was running a sustained regional discount across Central and East pincodes — invisible on the brand's metro dashboard, where the competitor's price had not moved at all. This was the share loss the brand could not explain.
- Seller depth below 2 in 47 percent of East pincodes, confirming the price-premium mechanism.
- 19 SKUs showed pack-size-level stockouts concentrated in tier-2 pincodes while metro availability stayed full.
What the Brand Did
Distribution. The deliverability map went straight to the supply and channel team. Undeliverable pincode clusters mapped almost exactly onto known warehouse and fulfilment-partner gaps. Two regional fulfilment partnerships were prioritised on the strength of this data.
Seller recruitment. The seller-depth finding produced a concrete, unglamorous, and highly effective action: recruit and onboard additional authorised sellers serving Central and East pincodes. More sellers meant more price competition meant a lower effective price in the exact markets where the brand needed volume.
Competitive response. The competitor's regional discount campaign was matched — regionally, not nationally. The brand protected its metro margin while responding where the attack was actually happening. On a metro-only dashboard, the only available response would have been a national price cut costing many times more.
Price integrity. A territory-level price band was defined and alerted on. Regional sales heads now receive a weekly report of pincodes where the effective price sits outside band — and, importantly, the e-commerce team can now verify distributor complaints in minutes rather than dismissing them.
Bank offer scoping. The finding that metro bank offers were not applying in the East led to a renegotiation of promotional scope with the brand's banking partners.
The Results (Two Quarters)
| Metric |
Before |
After Two Quarters |
| Panel deliverability, East territory |
62% |
88% |
| Effective-price spread, best vs worst territory |
21% |
9% |
| Authorised sellers serving Central + East |
4 |
11 |
| SKUs undeliverable to >30% of East panel |
41 |
9 |
| Tier-2 Flipkart revenue, indexed |
100 |
131 |
| Competitive share, Central + East |
Declining |
Stabilised, modest recovery |
Figures are representative of the engagement outcome.
Tier-2 Flipkart revenue grew 31 percent over two quarters. Notably, the brand did not cut its national price to achieve it. The problem had never been that the product was too expensive. The problem was that it was too expensive in specific places, unavailable in specific places, and that nobody could see which places.
The Broader Lesson
There is a temptation to treat pincode-level monitoring as a precision upgrade — the same picture, at higher resolution.
It is not. It is a different picture.
The brand's metro dashboard was not a slightly blurry version of the national truth. On the metrics that mattered most, it was reporting numbers that were simply wrong: a price 40 rupees below reality in the East, full deliverability where a third of the region could not receive the product, and a stable competitor who was in fact running an aggressive regional campaign.
For a national FMCG brand in India, where growth is concentrated in exactly the markets a metro panel cannot see, this is not an edge case. It is the central case.
Work With Product Data Scrape
Product Data Scrape builds hyperlocal Flipkart pricing data pipelines across configurable pincode panels — capturing price, Plus pricing, effective price, deliverability, delivery ETA, seller array, per-variant stock, and Flipkart Quick eligibility, rolled up into the territories your sales organisation actually uses.
If your Flipkart dashboard runs from one location, we will run a diagnostic pass on a sample of your SKUs across a representative national panel and show you the difference.
Product Data Scrape — turning marketplace complexity into decision-ready data.


 USA
USA
 EMAIL
EMAIL
 PHONE
PHONE

















.webp)






