Introduction
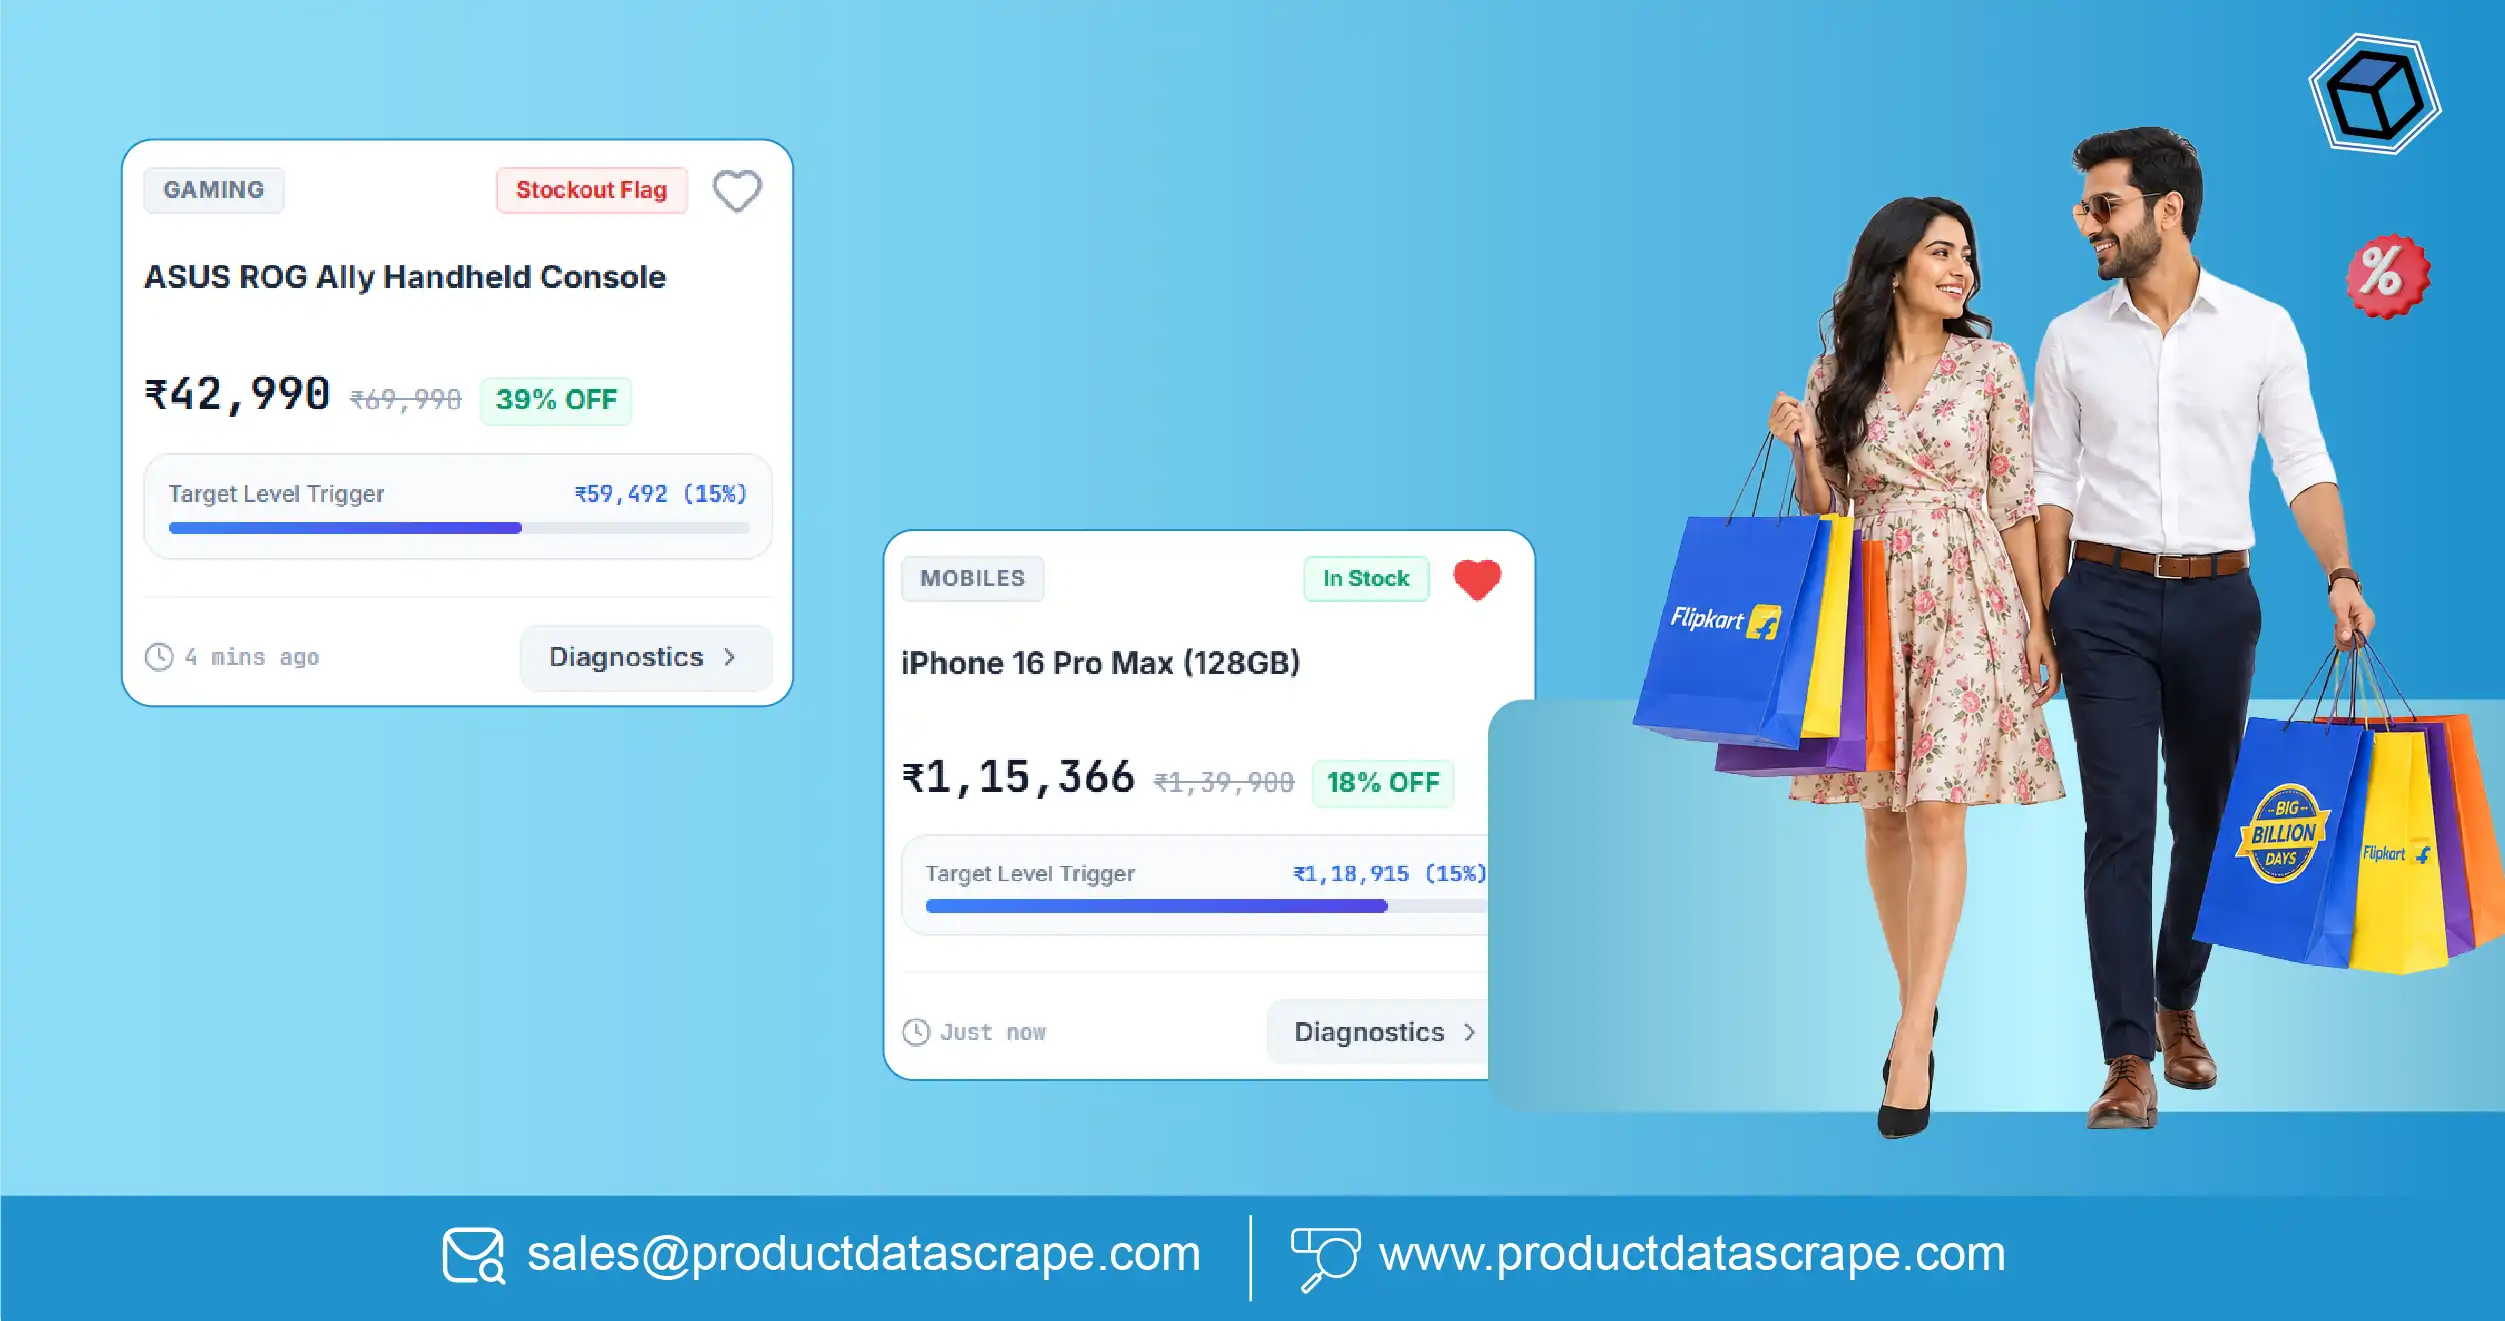
Big Billion Days is not a promotion. It is a compressed trading year.
For most brands on Flipkart, a meaningful share of the annual revenue for the category moves inside a handful of days. Prices that held steady for months reset within hours. Competitors who repriced twice a quarter start repricing several times a day. Hero SKUs that had never once gone out of stock sell through their allocation before the second morning.
And this is precisely the moment when most price-monitoring programmes fail.
They fail in two ways, and the second is worse than the first. Some fail loudly: the scraper breaks, the pipeline stalls, the dashboard goes stale, and everyone knows. Others fail quietly: the pipeline keeps running, keeps returning data, keeps populating the dashboard — but at a capture frequency that made sense in a normal week and is meaningless during a sale. The team sees numbers. The numbers are hours old. Decisions get made on them anyway.
This guide covers Big Billion Days price tracking that actually holds up: what changes during the event, what has to be captured, how often, what the data looks like, and how to build a monitoring plan that starts long before the sale opens.
Why Big Billion Days Breaks Conventional Monitoring

Velocity. In a normal week, a competitor's price on a given SKU might move once, or not at all. During Big Billion Days, the same SKU can move several times a day — flash deals open and close on the hour, deal quantities exhaust, and sellers respond to each other in something close to real time. Daily capture, which is entirely adequate in November, produces a picture that is systematically hours out of date in the only week where hours matter.
Volume. Sale-period monitoring is not the same catalogue at the same frequency. It is a wider catalogue — because competitor SKUs you ignore in a normal quarter suddenly matter — captured far more often. Request volume can rise by an order of magnitude against baseline. Infrastructure sized for the average silently throttles at the peak.
Structure. Sale events introduce page elements that do not exist the rest of the year: deal banners, countdown timers, deal-quantity indicators, tier-specific pricing, early-access windows for Flipkart Plus members. A parser built against the ordinary product page encounters something it has never seen and either breaks or, worse, returns a plausible-looking wrong value.
Stakes. In a normal week, a monitoring gap costs you a slightly stale dashboard. During Big Billion Days, a four-hour gap on a hero SKU can be the gap in which a competitor undercut you, cleared their allocation, and took the demand you had planned your quarter around. There is no recovering it. The customers have already bought.
What "Real Time" Has to Mean During a Sale
"Real time" is a word that gets used loosely, and during Big Billion Days the looseness is expensive. Two things have to be sized correctly, and they are not the same thing.
Capture frequency is how often you look. Decision latency is how long it takes from a competitor's move to your response. Frequency is a component of latency, but only one — if you capture every 15 minutes and your alert lands in an inbox nobody is watching, your effective latency is a working day.
A workable structure for a serious brand:
| SKU class |
Capture frequency during BBD |
Alerting |
| Hero SKUs (top 10% by revenue) |
Every 15 minutes |
Push alert to a live channel, named owner |
| Core SKUs |
Hourly |
Push alert, batched |
| Long-tail SKUs |
Every 4–6 hours |
Daily digest |
| Competitor hero SKUs |
Every 15 minutes |
Push alert |
Two things to note. First, the tiering matters more than the raw frequency — capturing everything every 15 minutes is expensive and mostly wasted, because most of the catalogue does not move. Second, competitor hero SKUs are monitored at the same frequency as your own. Most brands under-invest here, and it is exactly backwards: you already know what you are doing.
The Fields That Matter During a Sale Event
Big Billion Days changes what you need to capture, not just how often.
| Field |
Why it matters during BBD |
| bbd_active |
Whether the SKU is in an active deal at capture time |
| deal_type |
Flash, lightning, sustained, early-access, tier-specific |
| deal_price |
The sale price, distinct from the standard price |
| deal_start / deal_end |
Deal windows — essential for reconstructing the timeline afterwards |
| standard_price |
The non-deal price, still needed as the reference |
| plus_exclusive_price |
Plus members often get early access and deeper cuts |
| mrp |
The listed reference, but see the caution below |
| effective_price |
After bank offers, no-cost EMI, exchange and SuperCoin value |
| bank_offers[] |
Offer participation intensifies sharply during the sale |
| in_stock, variants[] |
Per-variant stock — the highest-signal field of the entire event |
| stock_signal |
Low-stock and deal-quantity indicators where surfaced |
| all_sellers[] |
Seller array with price and default-position flag |
| captured_at |
Timestamp. Without it, none of the above reconstructs into a timeline |
The last row is not a formality. The value of Big Billion Days price tracking is not the snapshot — it is the series. A price of 24,999 tells you almost nothing. A price of 24,999 that has fallen three times in six hours while the competitor's stock indicator dropped from "in stock" to "few left" tells you what is about to happen next.
Sample Data: One SKU, One Day of Big Billion Days
An illustrative capture series for a single mobile SKU across day one of the sale.
| Time |
Deal Active |
Deal Price |
Competitor Price |
Effective Price |
Stock |
Sellers |
Event |
| 00:00 |
Yes |
24,999 |
25,499 |
23,499 |
In stock |
5 |
Sale opens |
| 02:15 |
Yes |
24,999 |
24,499 |
23,499 |
In stock |
5 |
Competitor undercuts |
| 06:00 |
Yes |
24,999 |
24,499 |
23,499 |
In stock |
5 |
No response |
| 09:30 |
Yes |
23,999 |
24,499 |
22,499 |
In stock |
5 |
Brand responds — 7h latency |
| 13:45 |
Yes |
23,999 |
24,499 |
22,199 |
Few left |
4 |
Competitor adds bank offer |
| 17:20 |
Yes |
23,999 |
24,499 |
22,199 |
Out of stock |
4 |
Hero variant sells out |
| 21:00 |
Yes |
23,999 |
23,899 |
21,899 |
Out of stock |
4 |
Competitor cuts again, unopposed |
Illustrative series.
Read the last column. The brand was undercut at 02:15 and responded at 09:30 — a seven-hour window in which the competitor was cheaper and the brand did not know. By 17:20 the hero variant was out of stock, and from that point every further competitor move was uncontested, because the brand had nothing left to sell.
A daily-capture pipeline would have produced one row from this day. It would have shown a price of 23,999 and a stockout, and it would have shown neither the seven-hour undercut window nor the fact that the stockout arrived at a moment when the brand was already losing.
The corresponding JSON at 13:45:
{
  "product_id": "MOBH8G7ZQJ4XYZAB",
  "title": "Smartphone Model X Pro (Midnight Blue, 128 GB)",
  "captured_at": "2026-10-04T13:45:07+05:30",
  "pincode": "400001",

  "bbd_active": true,
  "deal_type": "sustained",
  "deal_price": 23999,
  "standard_price": 27999,
  "plus_exclusive_price": 23499,
  "mrp": 31999,
  "deal_end": "2026-10-09T23:59:00+05:30",

  "effective_price": 22199,
  "bank_offers": [
    {"bank": "Bank A", "type": "instant_discount", "value": 1500, "min_txn": 20000},
    {"bank": "Bank B", "type": "cashback", "value": 1000}
  ],
  "no_cost_emi_available": true,
  "exchange_offer_max": 15000,
  "supercoins_earnable": 300,

  "in_stock": true,
  "stock_signal": "few_left",
  "variants": [
    {"variant_label": "6 GB / 128 GB", "variant_price": 23999, "in_stock": true,  "stock_signal": "few_left"},
    {"variant_label": "8 GB / 256 GB", "variant_price": 27999, "in_stock": false, "stock_signal": "out_of_stock"}
  ],

  "all_sellers": [
    {"seller_name": "AuthorisedPartner A", "price": 23999, "is_f_assured": true, "is_default_seller": true},
    {"seller_name": "Competitor Seller",   "price": 24499, "is_f_assured": true, "is_default_seller": false}
  ]
}
Four Things Brands Consistently Miss During Big Billion Days
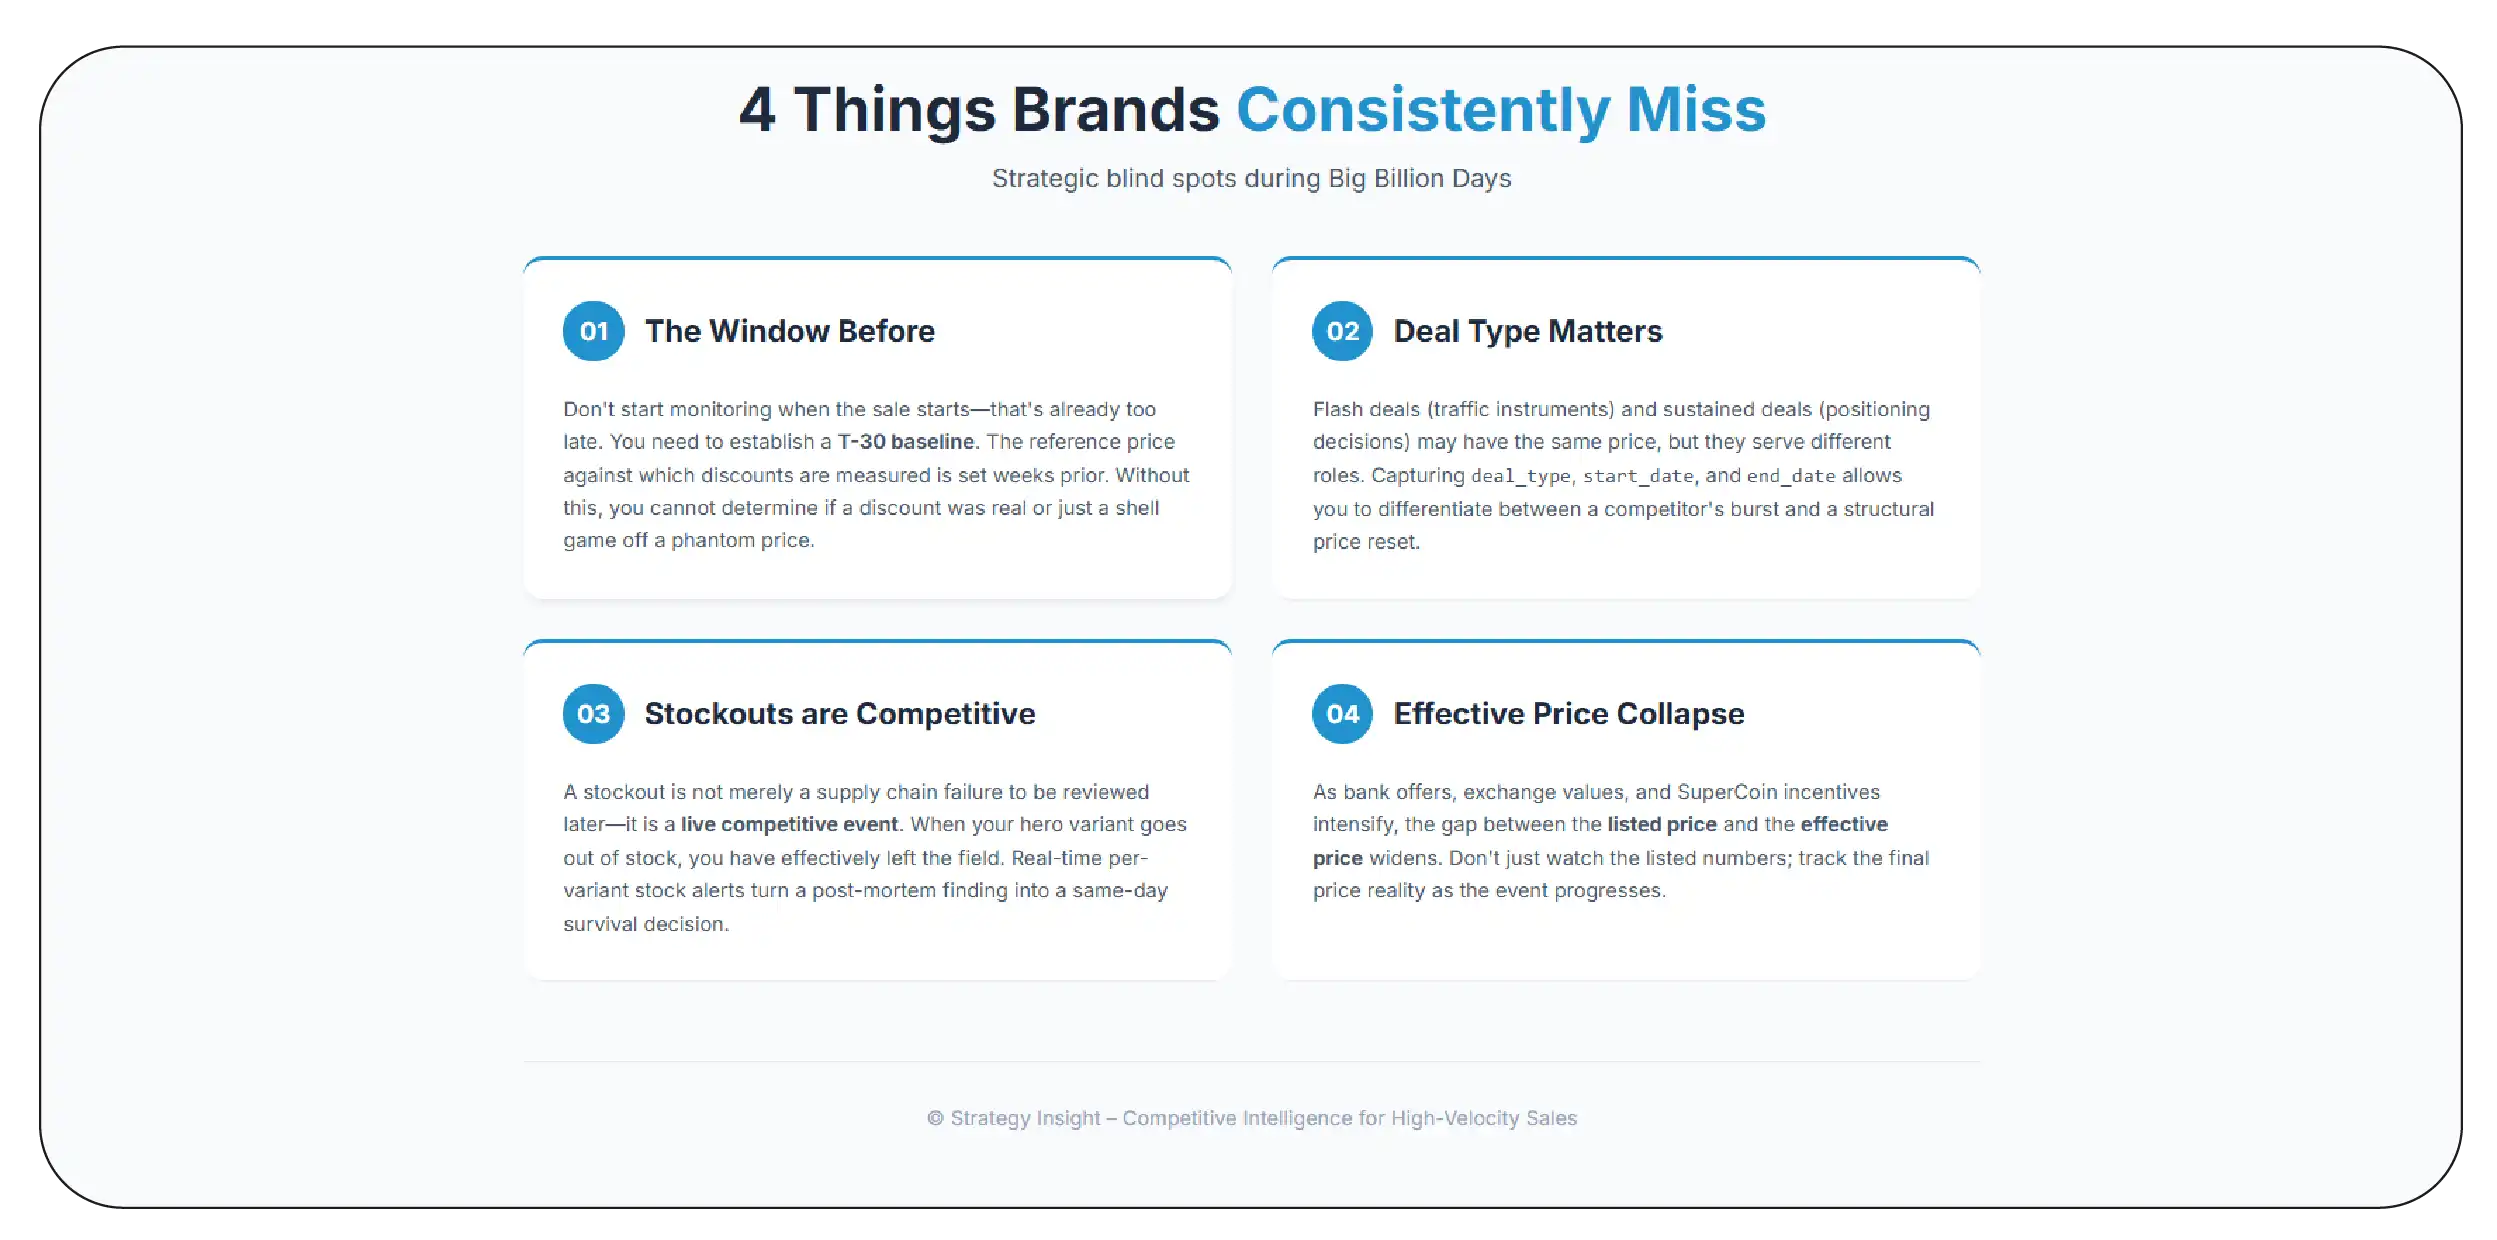
1. The window before the sale is part of the sale
Almost every brand starts monitoring when the sale starts. That is too late in a way that is easy to miss.
The reference price against which every discount is measured is set in the weeks before the event. If you have no record of what a SKU actually sold for during the thirty days preceding Big Billion Days, you cannot answer the only question that matters afterwards: was this a real discount, or was it a discount off a number nobody was paying?
Start capturing at T-30. It costs very little. It is the difference between a discount analysis and a press release.
2. Deal type matters more than deal price
A flash deal that runs for two hours and a sustained deal that runs for six days are not the same competitive event, even at the same price. The first is a traffic instrument. The second is a positioning decision.
Brands that capture only deal_price cannot distinguish them. Brands that capture deal_type, deal_start, and deal_end can — and can therefore tell the difference between a competitor running a burst and a competitor resetting their price for the event.
3. Stockout is a competitive event, not an operational one
A stockout during Big Billion Days is usually filed as a supply chain problem, reviewed after the sale, and discussed in a post-mortem.
It is not a supply chain problem while the sale is running. It is a live competitive event, and it should trigger the same urgency as a competitor price cut — because it has the same effect. When your hero variant goes out of stock on day one, every subsequent competitor move is uncontested. You are not competing badly. You have left the field.
Per-variant stock capture, alerted in real time, turns this from a post-mortem finding into a same-day decision.
4. The effective price collapses faster than the listed price
Offer participation intensifies during Big Billion Days. Banks push harder, exchange values rise, SuperCoin earn rates increase. The gap between the listed price and the effective price widens materially through the event.
A brand benchmarking on listed price during Big Billion Days is benchmarking on the layer that is moving least. It is watching the wrong number, at exactly the wrong time.
Building the Monitoring Plan: A T-30 to T+7 Timeline
T-30 to T-1 — Baseline capture. Daily capture across your SKU universe and a matched competitor basket. The output is a trailing reference price per SKU. Everything downstream depends on it.
T-7 — Infrastructure rehearsal. Run the sale-frequency configuration for a day. Confirm capacity, alerting, and ownership. Sale week is not the time to discover that the alert channel routes to a distribution list nobody reads.
T-3 — Early-access window. Flipkart Plus members frequently get early access. Deals begin before the public sale does. Monitoring should already be at sale frequency.
T0 to T+6 — Sale frequency. Tiered capture as described above, with named owners on the alert channels.
T+1 to T+7 — Post-sale price restoration. Prices do not snap back the moment the sale ends. The restoration curve — how fast competitors return to pre-sale levels, and whether they return at all — is one of the most valuable and least-collected datasets of the entire year. A competitor who does not restore has made a permanent price decision, and you want to know that within days rather than discovering it in the next quarter's review.
Why Scrapers Die on Day One
Three failure modes account for nearly all sale-period pipeline collapses.
Capacity. Request volume rises sharply, platform load rises sharply, and a pipeline provisioned for a typical Tuesday cannot absorb both at once.
Parser brittleness. Deal banners, countdown timers, and deal-quantity elements are structures the parser has never seen. A brittle parser breaks. A worse one returns a wrong value confidently.
No degradation strategy. A well-built pipeline degrades gracefully — dropping long-tail frequency to protect hero-SKU capture. A brittle one attempts everything at full frequency and fails at everything.
Product Data Scrape provisions capacity for the event rather than the average, maintains sale-specific parsing and deal flags, and tiers capture so that hero-SKU data keeps flowing even under load. The design assumption is simple: the pipeline has to work hardest on the days it is most likely to break.
Frequently Asked Questions
How often can you capture during Big Billion Days?
Down to 15-minute intervals on hero SKUs, with lower frequencies tiered across the rest of the catalogue.
Can you capture flash and lightning deals?
Yes — deal type, deal price, and the deal window are captured, which is what allows the sale to be reconstructed as a timeline afterwards.
Do you track competitor SKUs as well as our own?
Yes, and we recommend competitor hero SKUs be monitored at the same frequency as your own.
When should monitoring start?
T-30. The pre-sale baseline is what makes the discount analysis meaningful.
What happens to the data after the sale?
It becomes the reference set for next year's planning. Repricing frequency, discount depth, stockout timing, and competitor restoration behaviour are all reusable, and none of them can be reconstructed after the fact.
Track the Sale, Not the Snapshot
Big Billion Days rewards the brand that sees the move first. Not the brand with the deepest discount, and not the brand with the biggest ad budget — the brand that knows a competitor cut at 02:15 rather than finding out at 09:30.
Product Data Scrape builds Big Billion Days price tracking for brands on Flipkart: 15-minute capture on hero SKUs, deal type and deal windows, per-variant stock with real-time stockout alerting, effective price across the full offer stack, full seller arrays, and pre-sale baseline capture from T-30.
The sale is a week. The preparation is not. Talk to our team before the calendar closes in.
Product Data Scrape — turning marketplace complexity into decision-ready data.


 Singapore
 EMAIL
EMAIL
 PHONE
PHONE


.webp)
.webp "thumb")
.webp "thumb")
.webp "thumb")













.webp)






