Introduction
The global grocery industry has undergone rapid transformation driven by inflation volatility, cross-border trade, private-label expansion, and the dominance of online retail platforms. This research report, 2025 Global Grocery Price Comparison, examines grocery pricing behavior across the USA, Canada, Europe, and Southeast Asia between 2020 and 2026. The study focuses on essential food categories, premium grocery items, and fast-moving consumer goods (FMCG), highlighting how pricing strategies vary by region and economic condition.
With digital retail contributing over 35% of grocery discovery journeys worldwide in 2025, retailers and brands increasingly rely on E-commerce Price Monitoring Services to stay competitive. These services enable real-time visibility into price fluctuations, promotional patterns, and assortment changes across multiple markets. By combining historical data and forward-looking projections, this report delivers actionable insights for retailers, manufacturers, distributors, and analysts seeking clarity in a fragmented pricing environment.
Shifting Forces in Worldwide Food Markets
The year 2025 marks a pivotal point in grocery pricing evolution. Inflationary pressures between 2020 and 2022 led to sharp price increases, while stabilization phases in 2023–2024 forced retailers to rebalance margins and consumer affordability. According to Global Grocery Pricing Trends 2025, regional price divergence has widened due to logistics costs, currency fluctuations, and local sourcing strategies. Access to granular insights through a Web Data Intelligence API has become essential for tracking these changes accurately.
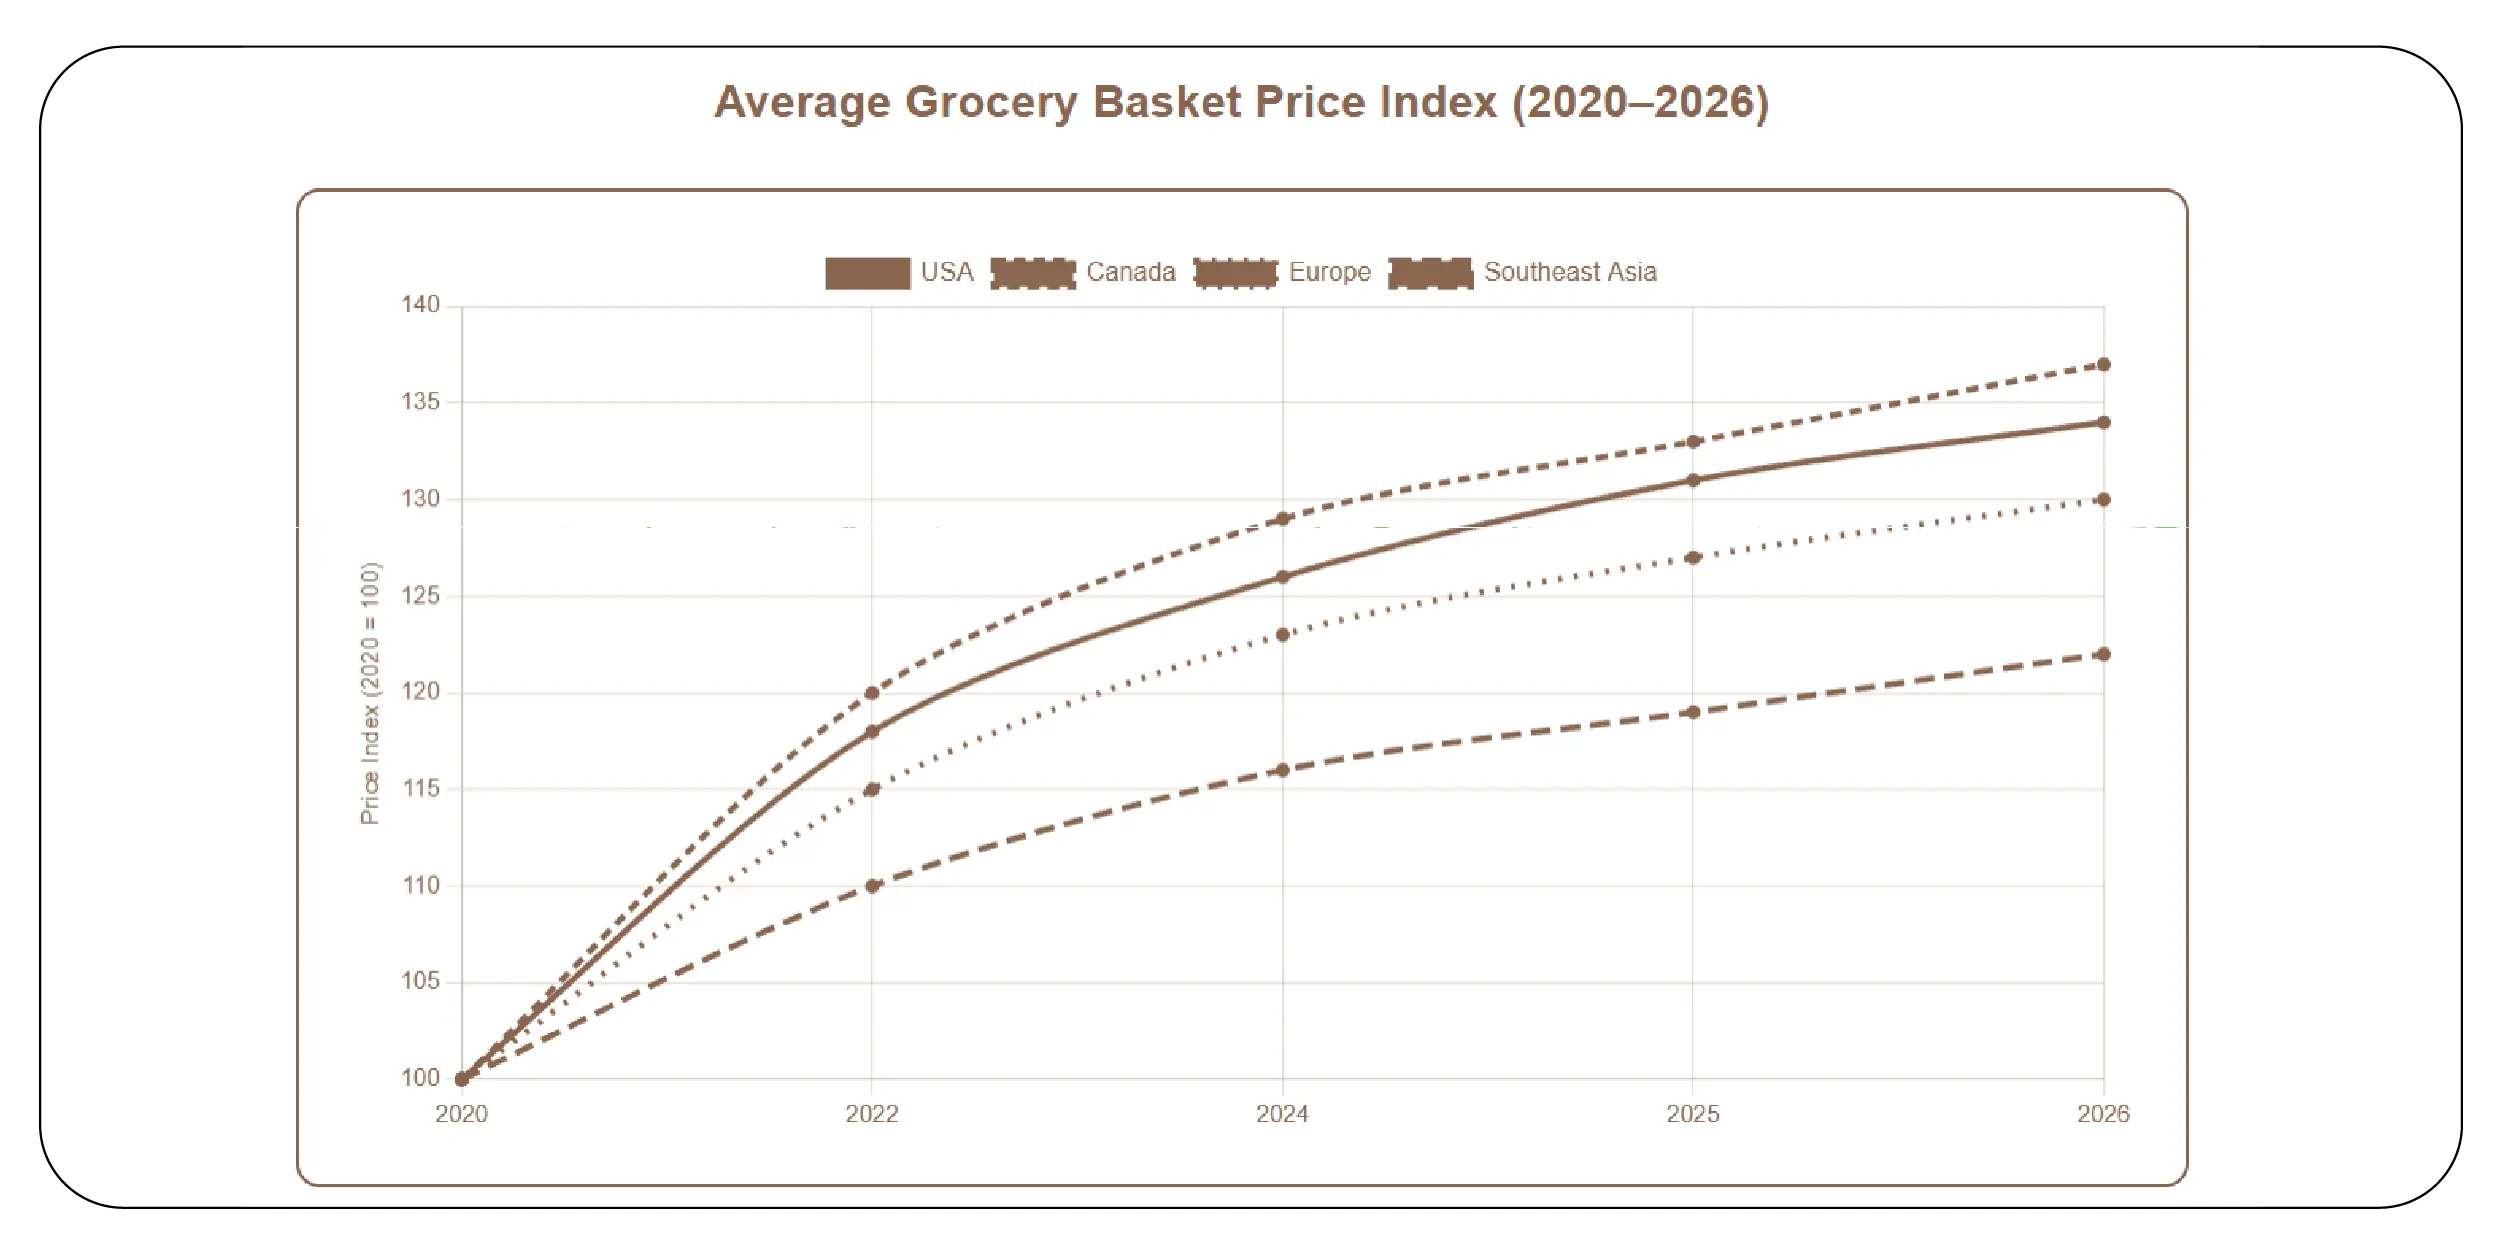
Average Grocery Basket Price Index (2020–2026)
| Region |
2020 |
2022 |
2024 |
2025 |
2026* |
| USA |
100 |
118 |
126 |
131 |
134 |
| Canada |
100 |
120 |
129 |
133 |
137 |
| Europe |
100 |
115 |
123 |
127 |
130 |
| Southeast Asia |
100 |
110 |
116 |
119 |
122 |
From 2020 to 2026, the USA and Canada show the highest sustained growth in grocery basket prices, while Southeast Asia maintains comparatively moderate increases. These shifts reflect changing supplier contracts, fuel costs, and consumer demand for premium products. Retailers increasingly rely on automated intelligence pipelines to react faster to market changes, enabling data-backed pricing decisions across borders.
Turning Raw Product Listings into Actionable Assets
Modern grocery analytics depends on the ability to Extract Grocery & Gourmet Food Data from thousands of digital storefronts. Product attributes such as brand, weight, packaging, and nutritional claims significantly impact pricing models. Retailers and manufacturers often choose to Buy Custom Dataset Solution options to gain tailored insights that align with their strategic objectives.
Category-Wise Price Growth (%)
| Category |
2020–2022 |
2022–2024 |
2024–2026* |
| Staples (Rice, Wheat) |
+14% |
+7% |
+5% |
| Dairy Products |
+18% |
+9% |
+6% |
| Packaged Snacks |
+20% |
+11% |
+8% |
| Organic & Gourmet |
+25% |
+15% |
+10% |
Custom datasets allow stakeholders to track category-specific inflation and premiumization trends across geographies. Between 2020 and 2026, organic and gourmet foods show the fastest growth, especially in Europe and North America. Accurate extraction and normalization of product data enable better forecasting, assortment optimization, and supplier negotiations in increasingly competitive grocery ecosystems.
Understanding Cross-Border Price Dynamics
A detailed 2025 International Grocery Pricing Analysis reveals stark contrasts in how regions absorb global cost pressures. North America shows higher absolute prices but slower percentage growth post-2024, while Southeast Asia experiences steady increases driven by urbanization and rising disposable income.
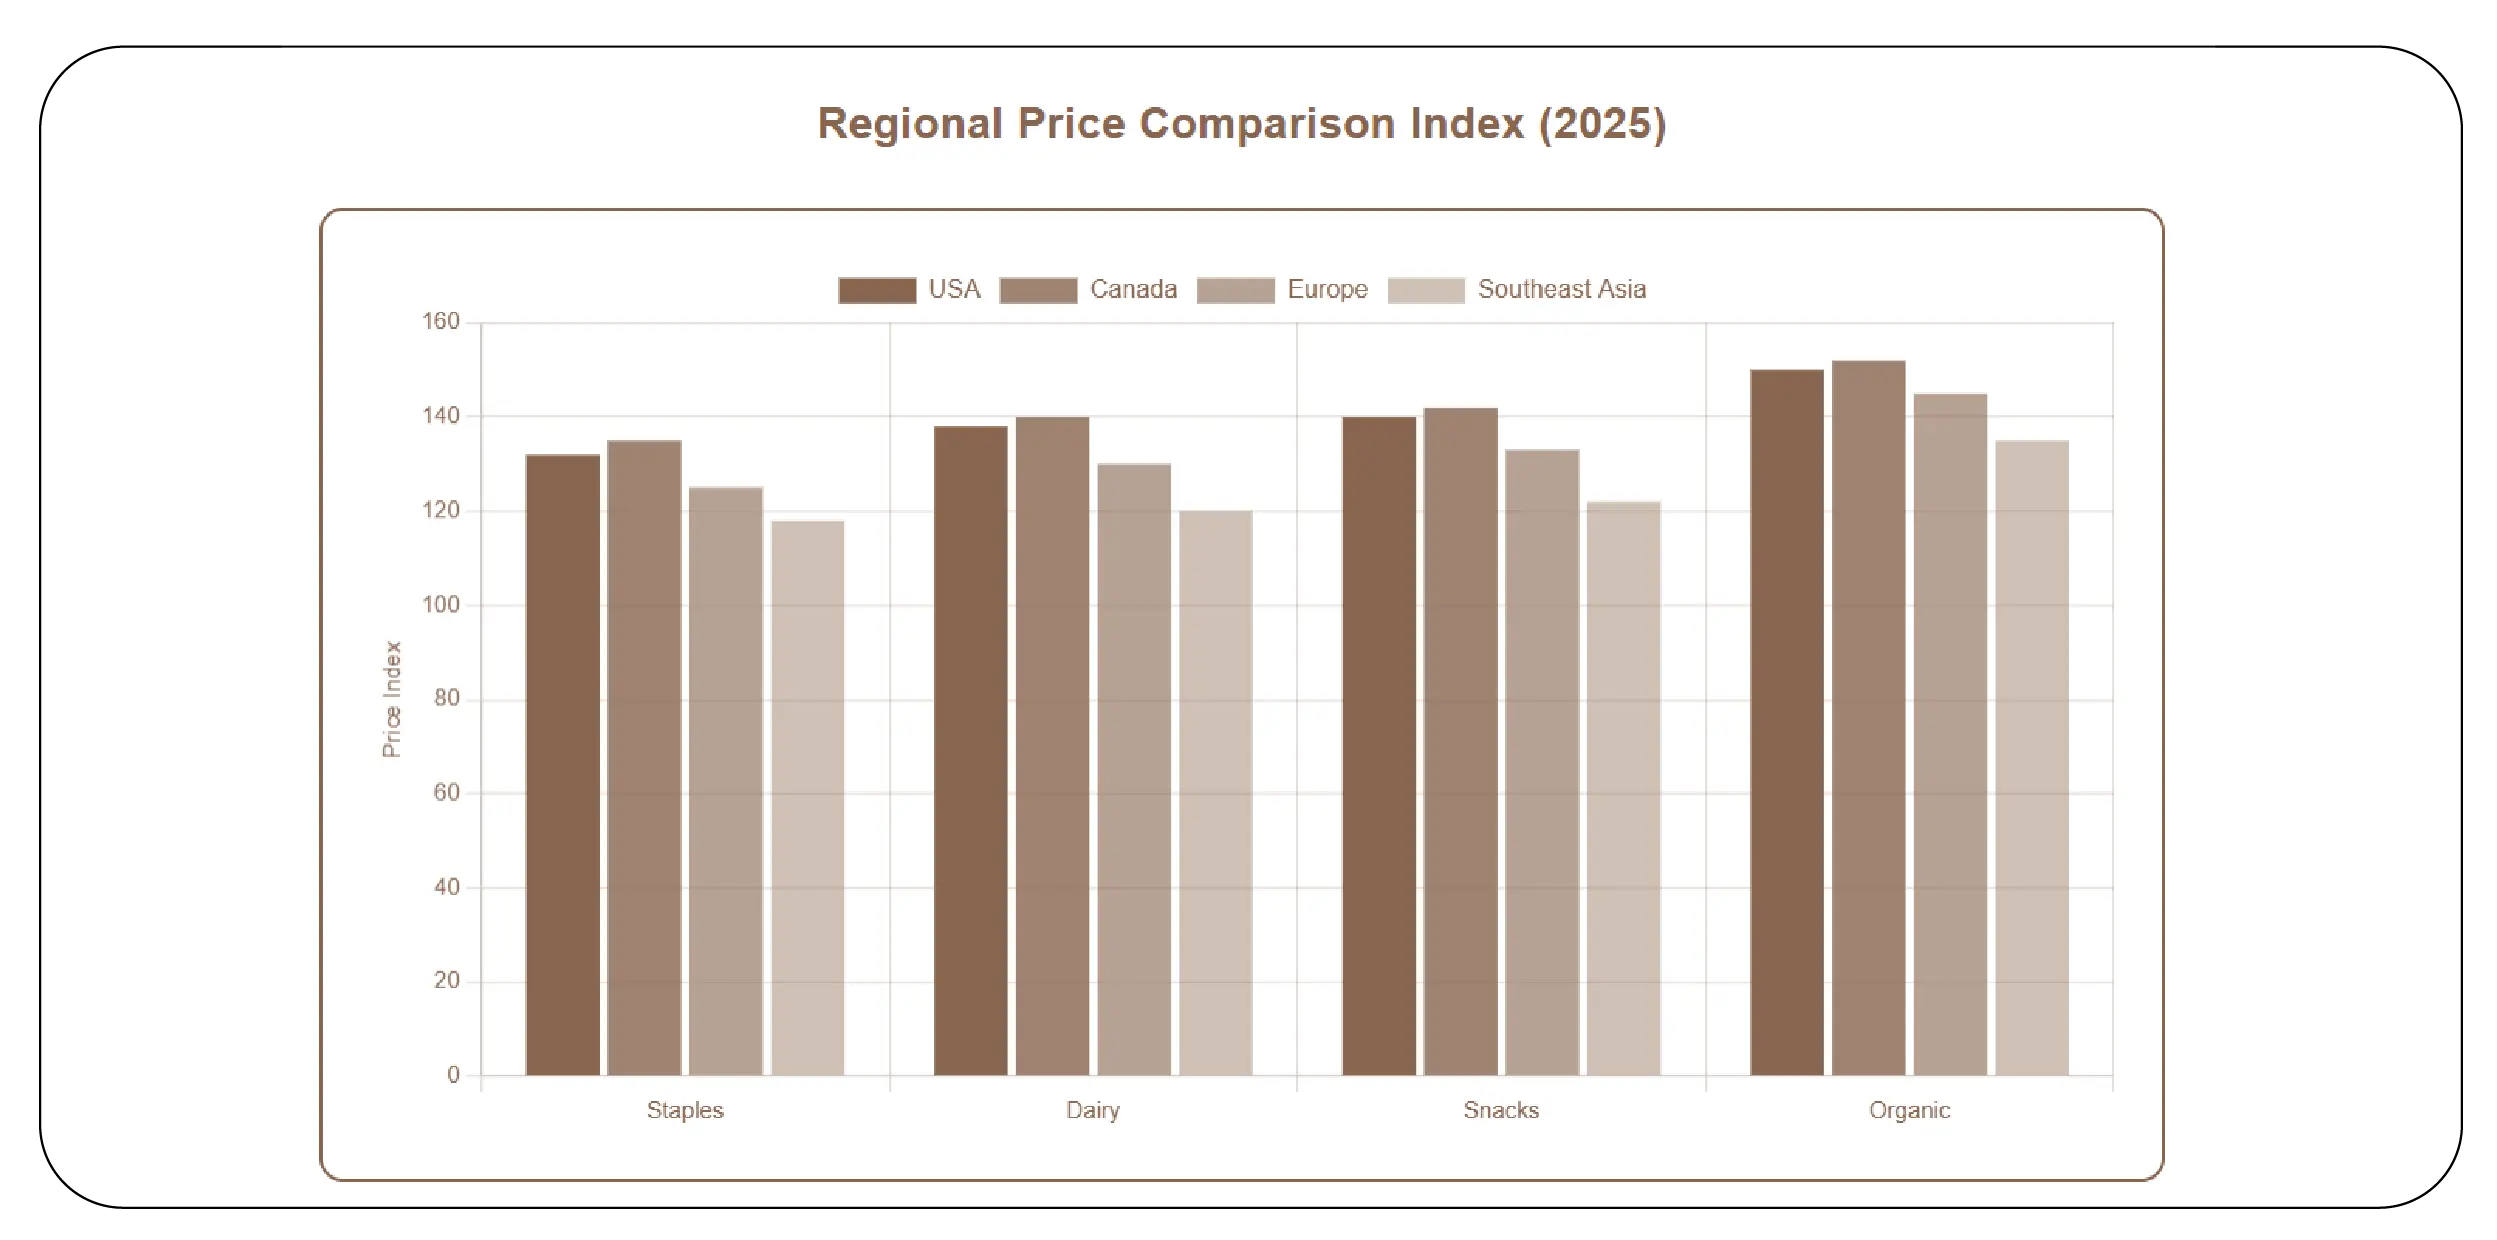
Regional Price Comparison Index (2025)
| Region |
Staples |
Dairy |
Snacks |
Organic |
| USA |
132 |
138 |
140 |
150 |
| Canada |
135 |
140 |
142 |
152 |
| Europe |
125 |
130 |
133 |
145 |
| Southeast Asia |
118 |
120 |
122 |
135 |
These differences underline the importance of regional pricing strategies. Multinational brands must adapt price positioning to local purchasing power while maintaining global brand equity. Access to historical and real-time datasets allows businesses to identify arbitrage opportunities and optimize cross-border expansion plans.
Data-Driven Decision Making in Modern Retail
As competition intensifies, Pricing Intelligence Services have become a strategic necessity rather than an operational add-on. Leveraging a Real-Time Grocery Pricing API for Global Markets enables retailers to monitor price movements, detect undercutting, and respond instantly to promotional changes.
Frequency of Price Changes (Monthly Average – 2025)
| Region |
Avg. Price Changes |
| USA |
6–8 |
| Canada |
5–7 |
| Europe |
4–6 |
| Southeast Asia |
3–5 |
Retailers in North America update prices more frequently due to dynamic promotions and competitive intensity, while Southeast Asian markets maintain relatively stable pricing cycles. Real-time APIs empower organizations to automate alerts, reduce manual tracking efforts, and enhance pricing governance across thousands of SKUs.
Scalable Access to Multi-Market Price Feeds
An International Grocery Price Scraping API enables seamless access to structured pricing data from diverse online sources. These APIs support large-scale data collection across regions, currencies, and languages, ensuring consistency and accuracy.
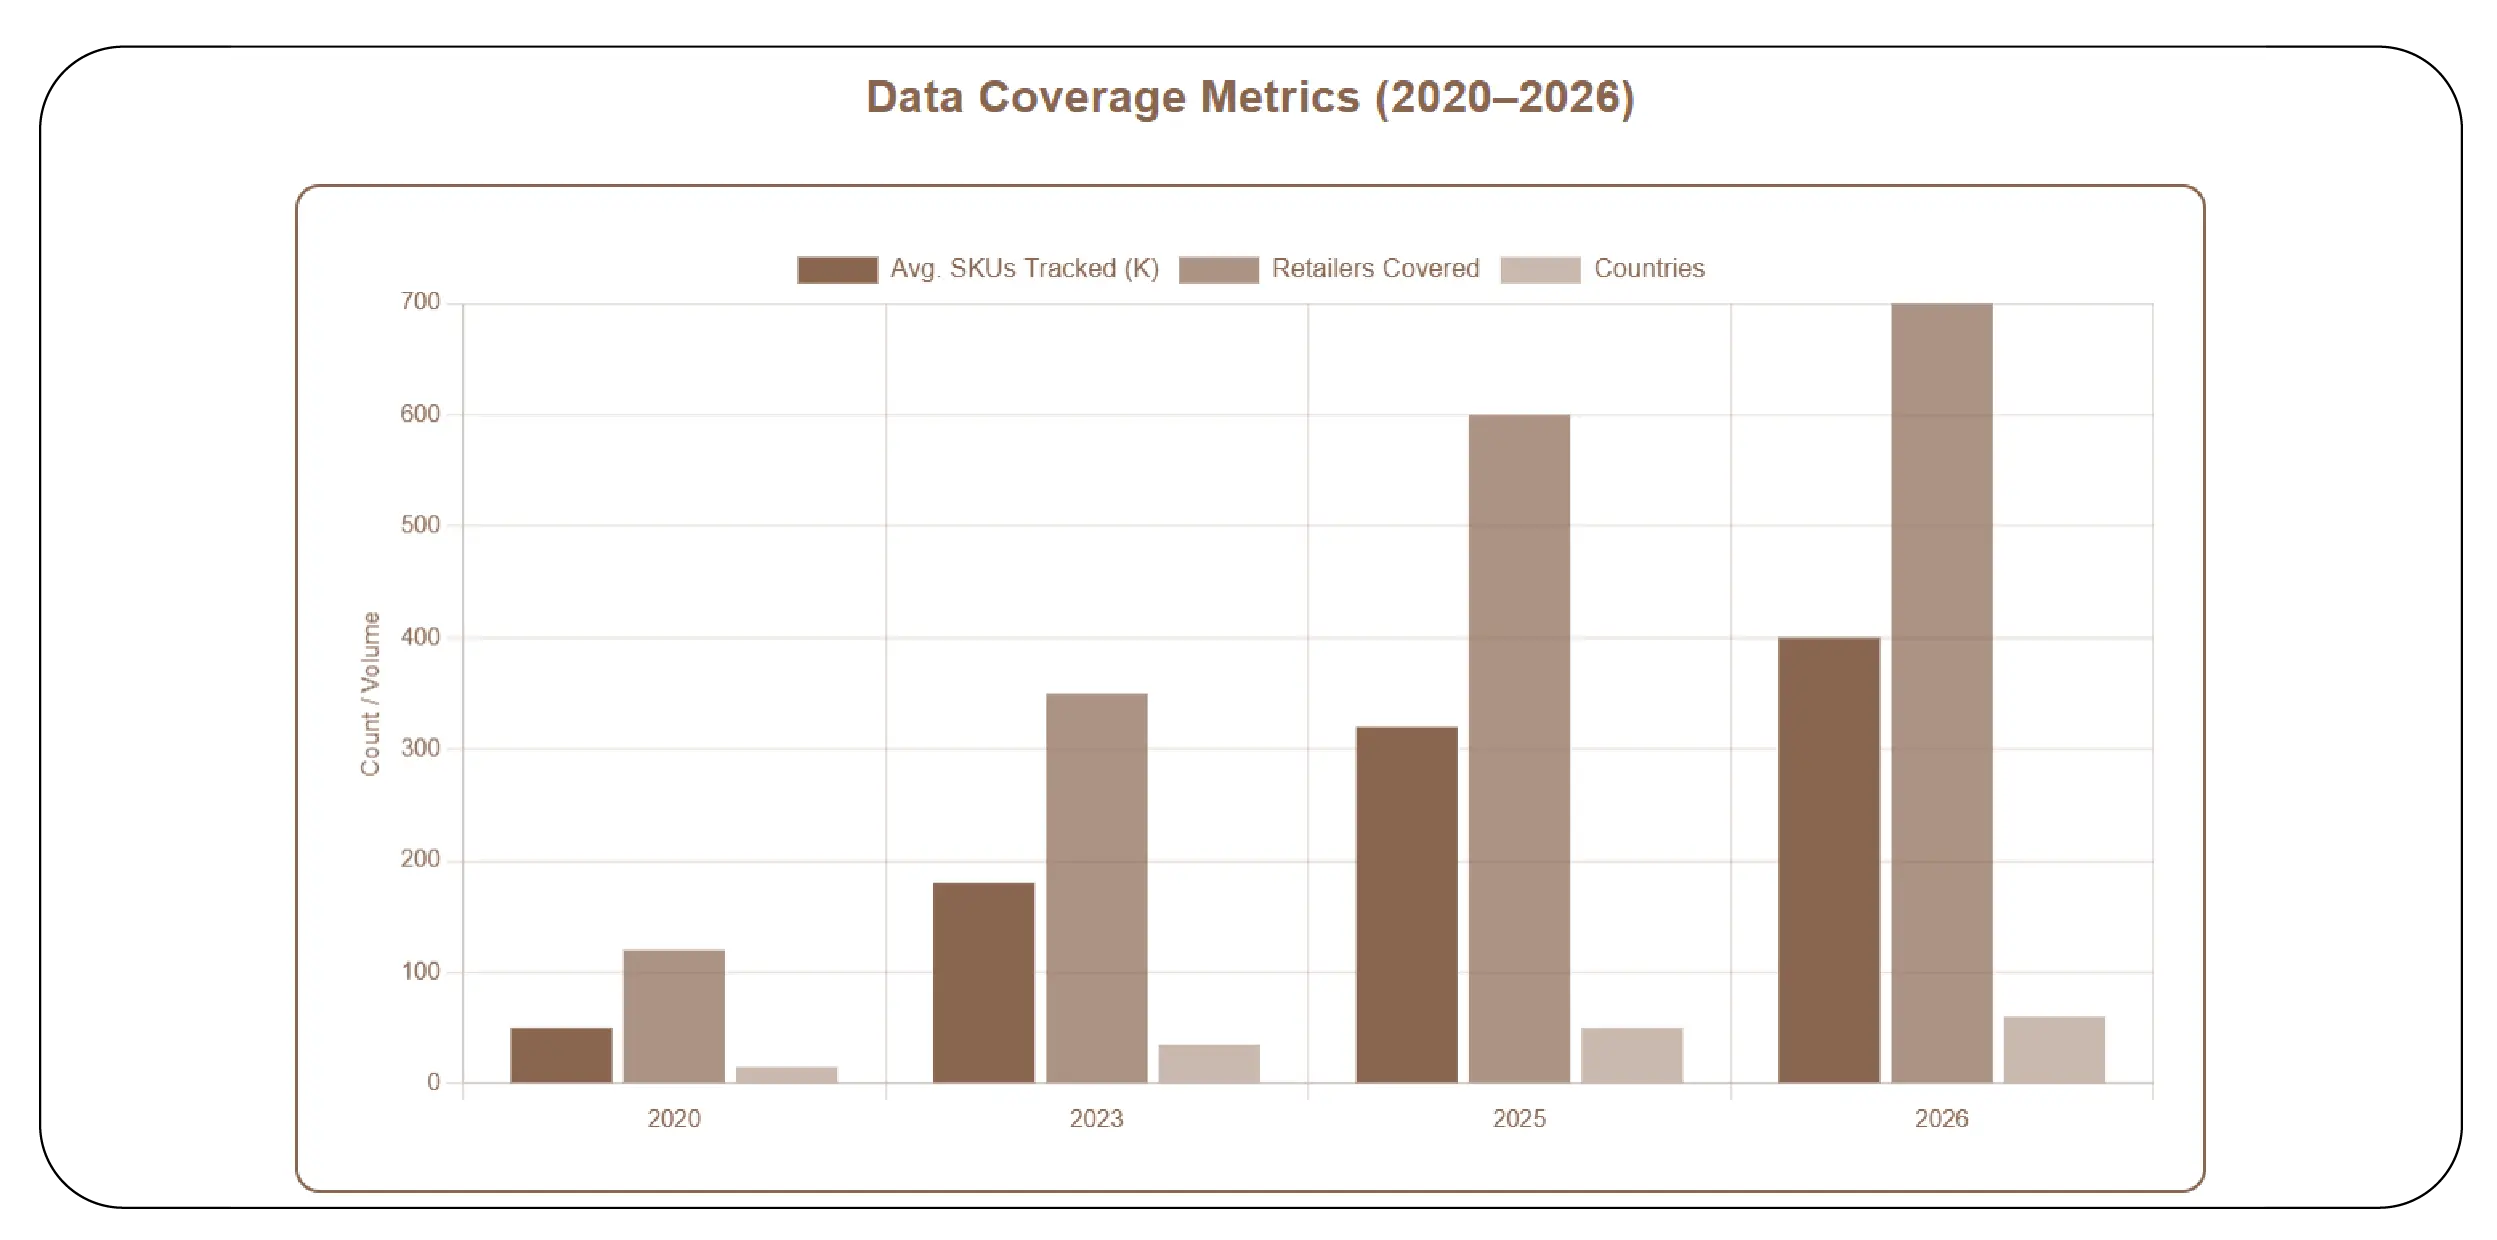
Data Coverage Metrics (2020–2026)
| Metric |
2020 |
2023 |
2025 |
2026* |
| Avg. SKUs Tracked |
50K |
180K |
320K |
400K |
| Retailers Covered |
120 |
350 |
600 |
700 |
| Countries |
15 |
35 |
50 |
60 |
The rapid expansion in data coverage reflects growing reliance on automated scraping solutions. Businesses gain the flexibility to scale monitoring efforts without compromising data quality, supporting long-term analytics, forecasting, and strategic planning initiatives.
Staying Ahead in a Competitive Landscape
In 2025, Competitor Price Monitoring Services play a critical role in sustaining market relevance. Grocery retailers track rivals’ pricing, promotions, and assortment strategies to refine their own positioning.
Impact of Competitive Monitoring (2025 Survey Results)
| Outcome |
% of Retailers |
| Improved Margin Control |
68% |
| Faster Price Adjustments |
74% |
| Better Promotion ROI |
61% |
| Reduced Price Wars |
45% |
These insights demonstrate how continuous competitor monitoring enables smarter pricing decisions. Retailers that integrate competitive data into their pricing workflows achieve stronger margins and improved customer trust, even in volatile economic conditions.
Why Choose Product Data Scrape?
Product Data Scrape empowers businesses to Compare Grocery Prices Across USA, Canada, Europe & SEA with unmatched accuracy and scalability. Our solutions deliver SKU-Level Global Grocery Price Intelligence, enabling retailers, brands, and analysts to track millions of products across regions in real time. With advanced data validation, flexible delivery formats, and dedicated support, Product Data Scrape transforms raw web data into strategic intelligence that drives growth and resilience in competitive grocery markets.
Conclusion
The global grocery landscape between 2020 and 2026 reflects a complex interplay of inflation, consumer behavior, and digital transformation. Insights into Global Supermarket Pricing Trends 2025 highlight the growing need for reliable, scalable, and real-time pricing intelligence across international markets.
Partner with Product Data Scrape today to unlock comprehensive grocery pricing insights and stay ahead of global market shifts with confidence and precision.


.webp)